Natural Gas: Key Moving Averages and Price Forecasts
Natural gas futures rose ~3.9% on August 3, 2016, compared to the previous session. The gain was caused by weather reports suggesting hotter weather.
Aug. 5 2016, Published 7:13 a.m. ET

Natural gas prices
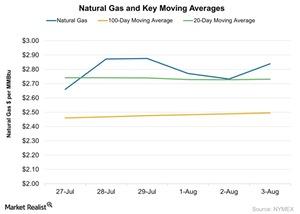
In the last five trading sessions, natural gas (UNG) (FCG) (BOIL) (GASL) (GASX) (UGAZ) (DGAZ) futures have risen by 6.7%. They closed at ~$2.84 per MMBtu (million British thermal units) on August 3, 2016. Natural gas futures rose ~3.9% on August 3, compared to the previous session. The gain was caused by weather reports suggesting hotter weather.
On July 1, active natural gas futures hit a 2016 high of $2.99—the highest level since May 2015. Currently, natural gas is ~5% below its 2016 high.
Factors driving natural gas prices
On July 28, the EIA (U.S. Energy Information Administration) announced a 17 Bcf (billion cubic feet) addition to the natural gas inventory level for the week ending July 15. Analysts expected an addition of 27 Bcf, according to a survey by the Wall Street Journal. This eased supply glut fears and supported prices. Natural gas futures rose 8% on July 28.
EIA forecasts
The EIA forecast indicates that total natural gas consumption could average at 76.5 Bcf per day and 77.7 Bcf per day in 2016 and 2017, respectively. Natural gas consumption was 75.3 Bcf per day in 2015. Higher consumption and slowing production could help prices rally.
Natural gas price movements will impact natural gas–weighted stocks such as Memorial Resource Development (MRD), EXCO Resources (XCO), WPX Energy (WPX), Rex Energy (REXX), Comstock Resources (CRK), Southwestern Energy (SWN), and Range Resources (RRC).
Why natural gas prices fell in early 2016
Last winter, natural gas usage for heating was weak due to the mild weather. As a result, prices were weak. At the end of March 2016, US natural gas inventories were at 2.5 trillion cubic feet—67% higher than corresponding 2015 levels and 53% higher than their five-year average. Natural gas futures hit a 2016 and 17-year low of $1.64 on March 3.
Key moving averages
On August 3, natural gas futures (UNG) (FCG) (BOIL) (GASL) (GASX) (UGAZ) (DGAZ) were trading ~13.7% above their 100-day moving average and 4% above their 20-day moving average. Prices above the 20-day moving average and the 100-day moving average indicate bullish sentiment for natural gas. The above graph shows the price performance of natural gas futures relative to key moving averages.
Natural gas sentiment also impacts ETFs such as the ProShares Ultra Oil & Gas ETF (DIG), the PowerShares DWA Energy Momentum Portfolio (PXI), the Vanguard Energy ETF (VDE), the iShares U.S. Energy ETF (IYE), and the Fidelity MSCI Energy Index ETF (FENY).
Memorial Resource Development (MRD), EXCO Resources (XCO), WPX Energy (WPX), Rex Energy (REXX), Comstock Resources (CRK), Southwestern Energy (SWN), and Range Resources (RRC) operate with production mixes of 78.1%, 88.7%, 67.0%, 62.4%, 72.0%, 92%, and 71.2%, respectively, in natural gas.
In the next part of this series, we’ll discuss the crude oil rig count.
