Whiting Petroleum Corp
Latest Whiting Petroleum Corp News and Updates
Are Oil’s Supply Concerns Rising?
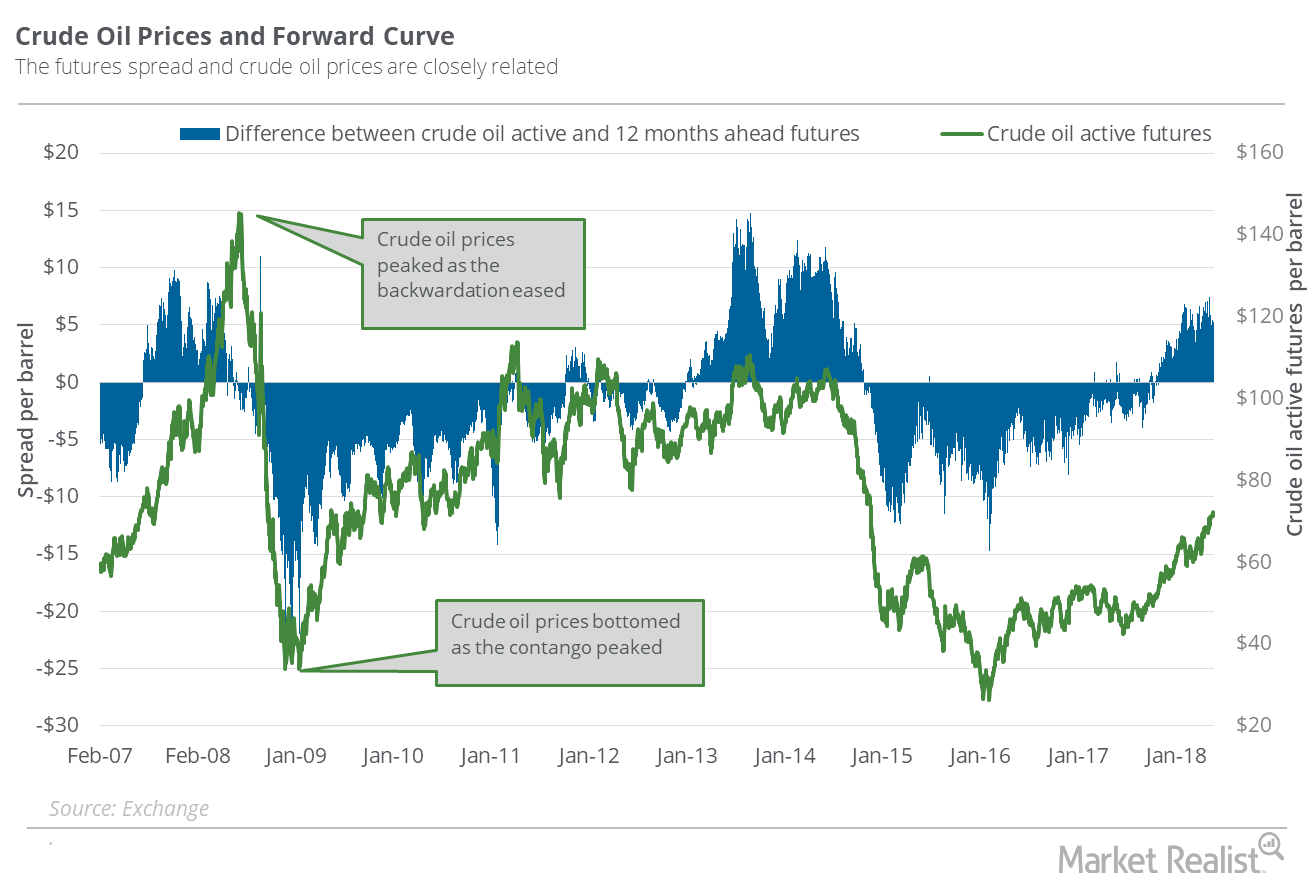
On May 21, US crude oil July futures closed $5.97 above the July 2019 futures contract. On May 14–21, US crude oil July futures rose 1.9%.
Top Energy Losses Last Week
On June 8–15, Whiting Petroleum (WLL) and California Resources (CRC) fell the most on our list of energy stocks.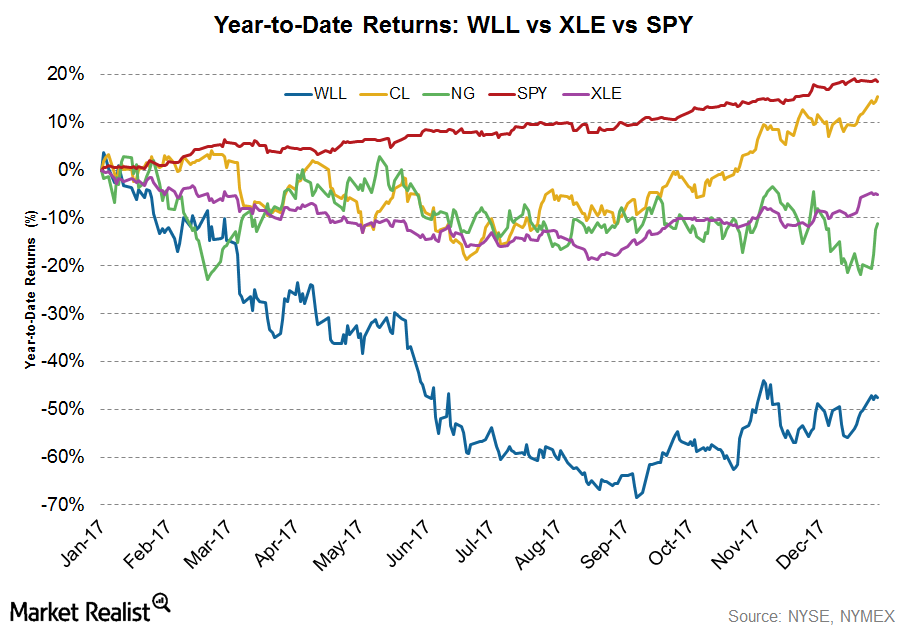
What Drove Whiting Petroleum Stock in 2017?
Whiting Petroleum (WLL) stock rose 5.3% in the week ending December 29 from the previous week. However, the stock fell ~47.6% by the end of 2017.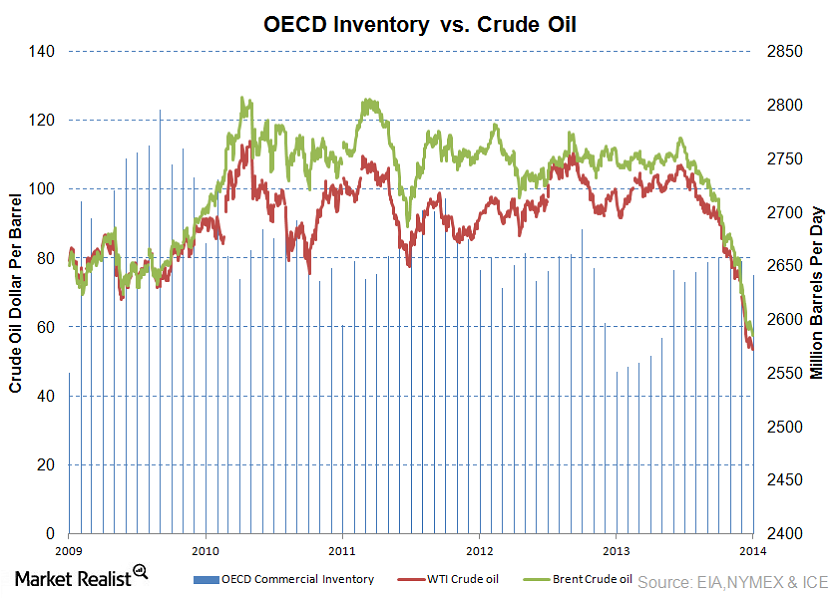
Why investors should track crude oil inventory levels
The difference between actual and expected changes in US crude oil inventory levels affects crude prices and thus revenues and earnings of major companies.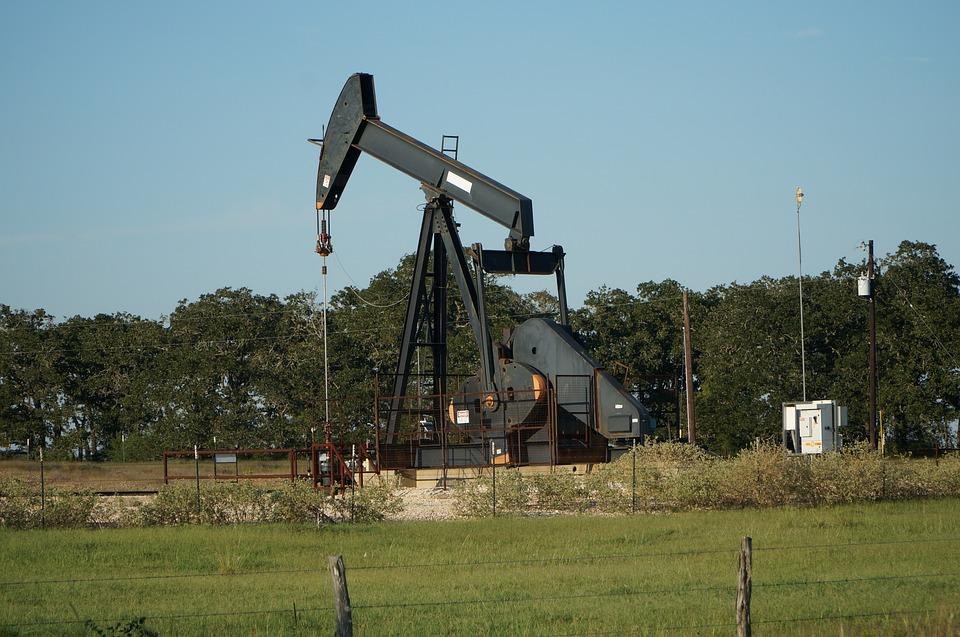
Are You Looking at the Right Oil-Weighted Stocks?
On May 16, US crude oil June futures rose 0.3% and closed at $71.49 per barrel, a more-than-three-year high.
Why Did Oil Prices Fall?
On March 22, natural gas April 2018 futures declined 0.8% and settled at $2.62 per million British thermal units.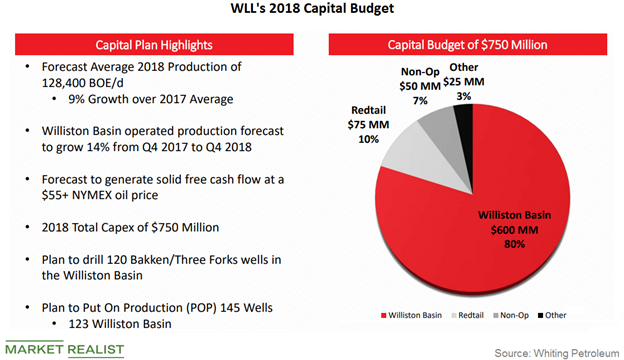
Whiting Petroleum’s Capex Plans for 2018
Whiting Petroleum’s (WLL) 2018 capital expenditure forecast is $750 million, compared to its capex of $912 million in 2017.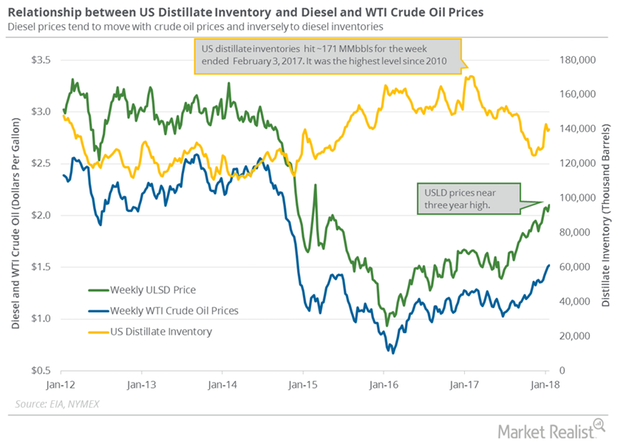
US Distillate Inventories Rose for the Eighth Time in 10 Weeks
US distillate inventories rose by 0.64 MMbbls (million barrels) to 139.8 MMbbls on January 12–19, 2018, according to the EIA.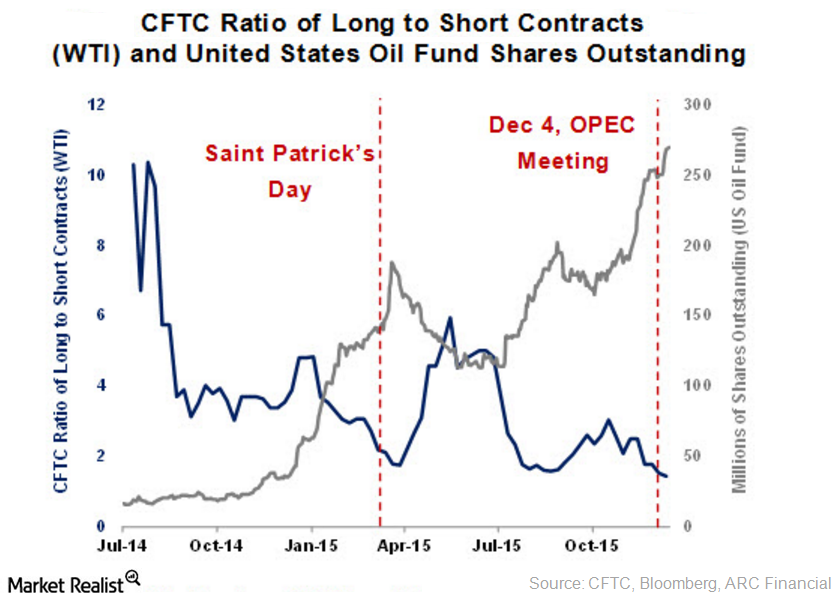
Long Positions Fall in the CFTC’s Commitment of Traders Report
The CFTC’s COT report states that hedge funds reduced their long positions for the week ending January 12, 2016. The net long positions fell by 20,673 contracts to 163,504 contracts during the week.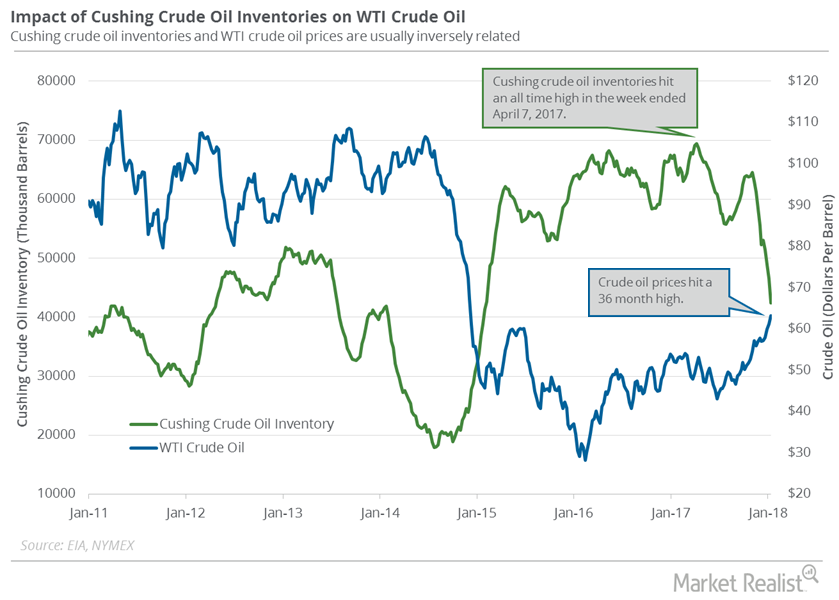
Cushing Inventories Hit January 2015 Low
A Bloomberg survey estimates that the crude oil inventories at Cushing could have declined by 2.3 MMbbls (million barrels) on January 12–19, 2018.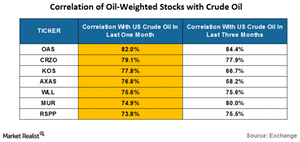
Crude Oil’s Comeback: Analyzing Oil-Weighted Stocks
On August 15, 2016, US crude oil (USO) (OIIL) (USL) (SCO) contracts for September delivery closed at $45.74 per barrel—2.8% above its previous closing price.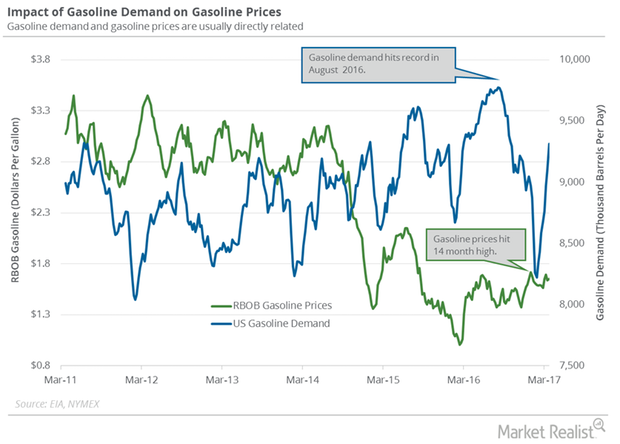
US Gasoline Demand: Key Crude Oil Driver in 2017
The EIA estimated that four-week average US gasoline demand rose by 210,000 bpd (barrels per day) to 9,312,000 bpd from March 17–24, 2017.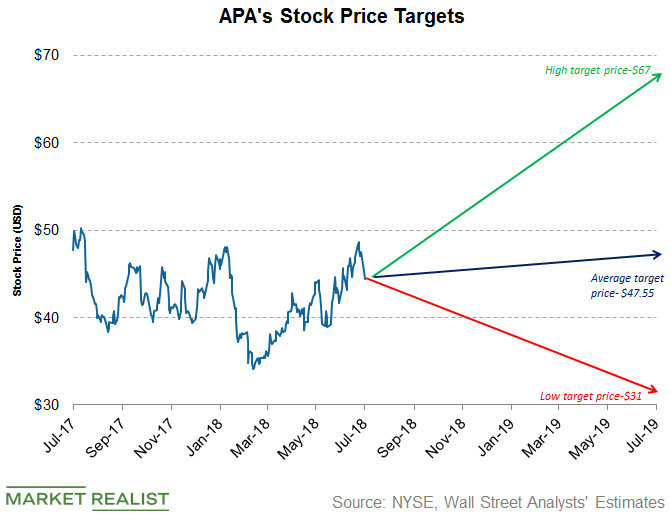
Apache Stock: What Are Analysts’ Recommendations?
On June 11, Argus upgraded Apache stock from “hold” to “buy.” On March 7, UBS initiated coverage on Apache stock with a “sell” rating.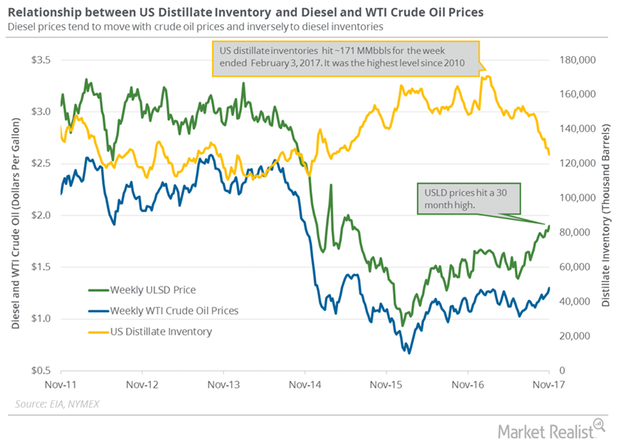
US Distillate Inventories Are at 32-Month Low
The EIA reported that US distillate inventories fell by 3,359,000 barrels to 125.5 MMbbls (million barrels) or 2.6% between October 27, 2017, and November 3, 2017.Financials Why the inverted head and shoulder pattern is formed
The inverted head and shoulder pattern is the reverse of the head and shoulder pattern. It’s formed at the bottom of the downtrend.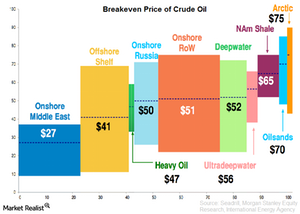
Why is the breakeven price of crude oil so important?
Knowing the breakeven price of crude oil is important when trying to figure out what OPEC needs in order to regain market share.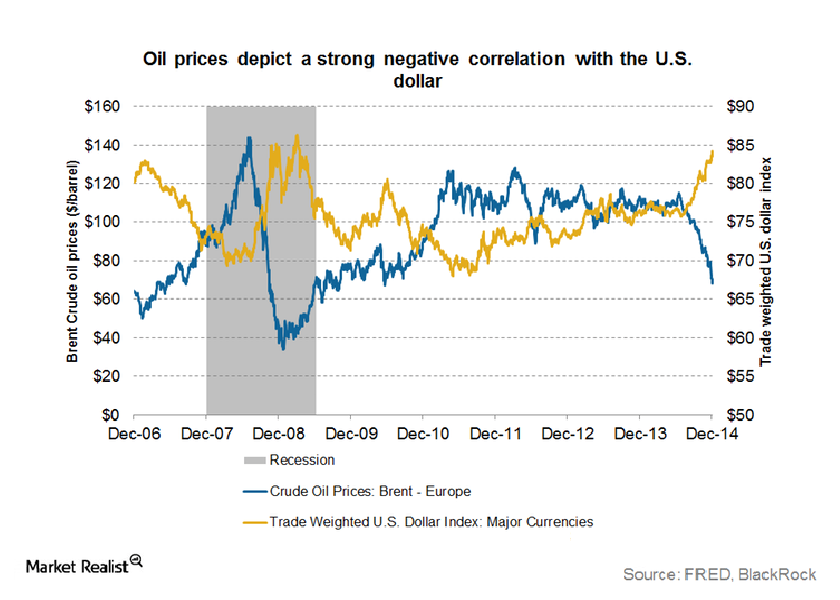
How the strengthening US dollar is impacting crude oil prices
The US dollar plays a major role in the price movements of commodities such as gold and crude oil. A strengthening US dollar is often seen as negative.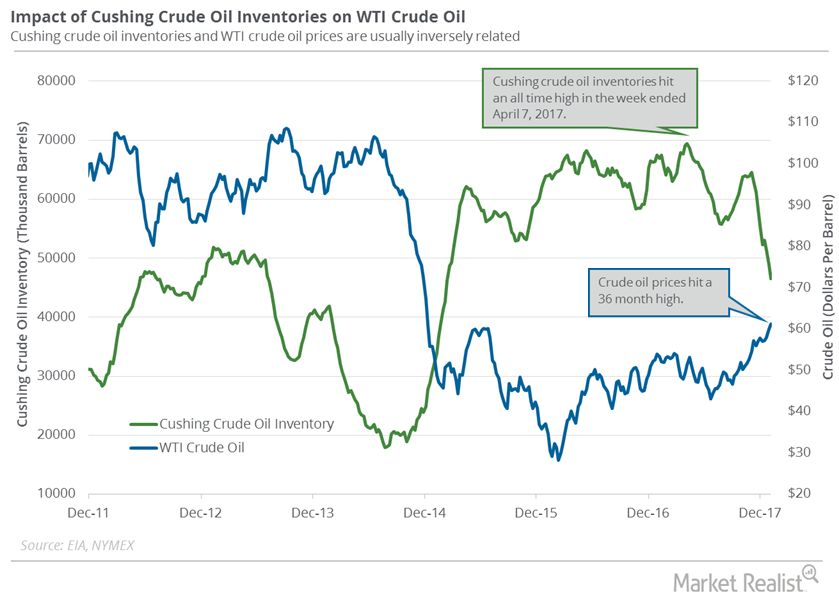
Cushing Inventories Fell 33% from the Peak
Analysts expect that Cushing crude oil inventories could have declined on January 5–12, 2018. A fall in Cushing inventories is bullish for oil prices.
Traders Could Start Booking a Profit in Crude Oil Futures
On January 16, 2018, Goldman Sachs said that crude oil prices could exceed its forecast in the coming months.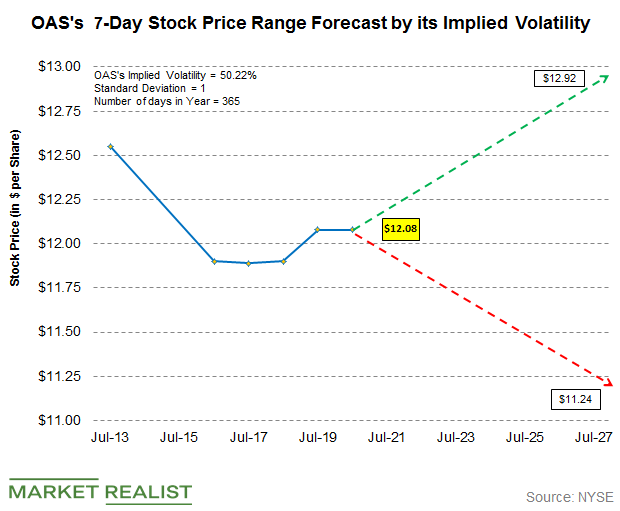
Using Implied Volatility to Forecast Oasis’s Stock Price Range
Oasis Petroleum (OAS) stock’s current implied volatility is ~ 50.22%, which is ~2.08% higher than its 15-day average of 49.19%.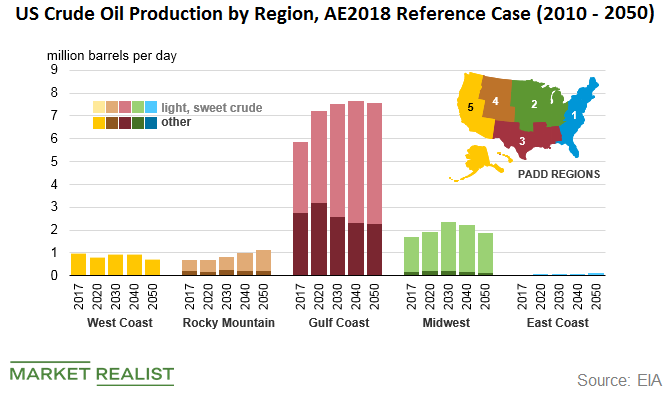
Light Sweet Crude Oil Drives US Crude Oil Production Growth
According to the EIA (U.S. Energy Information Administration), recent growth in US crude oil production has been driven primarily by light, sweet crude oil.
Key Energy Events This Week
The EIA’s crude oil and natural gas inventory data are scheduled to be released on April 25 and April 26, 2018, respectively.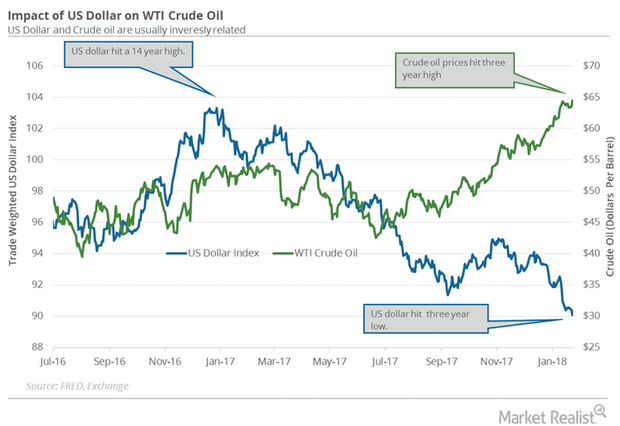
US Dollar Hit a 3-Year Low: Is It Bullish for Crude Oil?
The US Dollar Index (UUP) fell 0.34% to 90.09 on January 23—the lowest level since December 2014. The fall supported crude oil prices on January 23, 2018.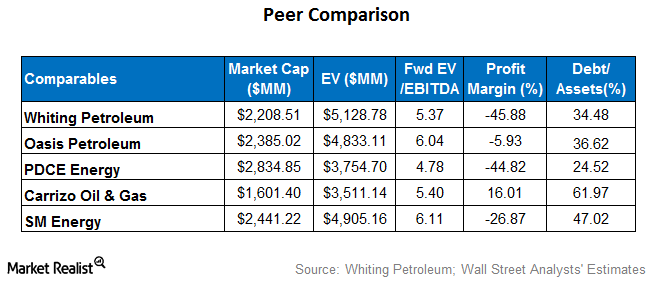
Where Whiting Petroleum Stands Next to Peers
Whiting Petroleum’s (WLL) forward EV-to-EBITDA multiple of ~5.4x is mostly in line with the peer average of 5.5x.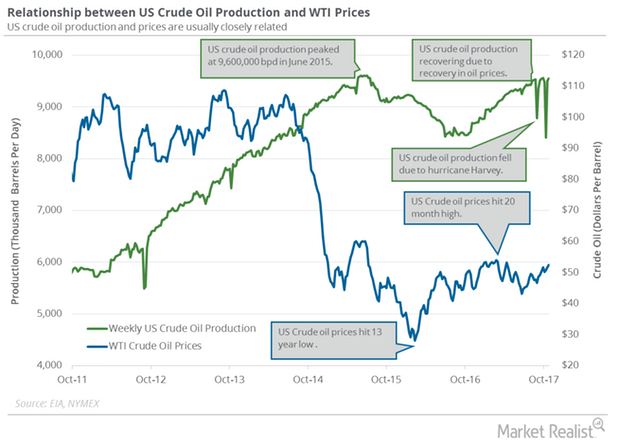
Will Non-OPEC and US Crude Oil Production Impact Oil Prices?
The EIA (U.S. Energy Information Administration) estimates that US crude oil production rose by 46,000 bpd to 9,553,000 bpd on October 20–27, 2017.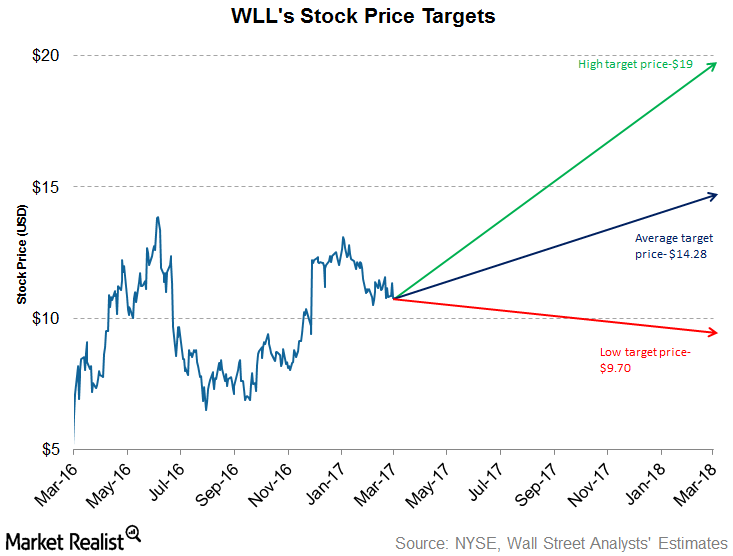
What Do Analysts Recommend for Whiting Petroleum?
Approximately 38.5% of the analysts rated Whiting Petroleum (WLL) as a “buy,” while ~56.4% rated it as a “hold.” The average broker target price is $14.28.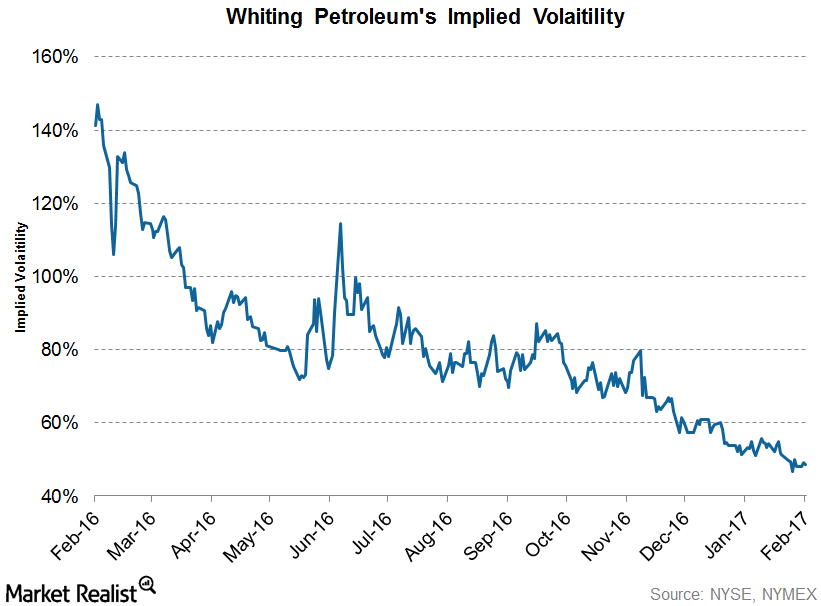
Whiting Petroleum’s Implied Volatility: Key Trends
Whiting Petroleum’s (WLL) implied volatility as of February 22, 2017, was 48.5%, which was ~4.3% lower than its 15-day average of 50.7%.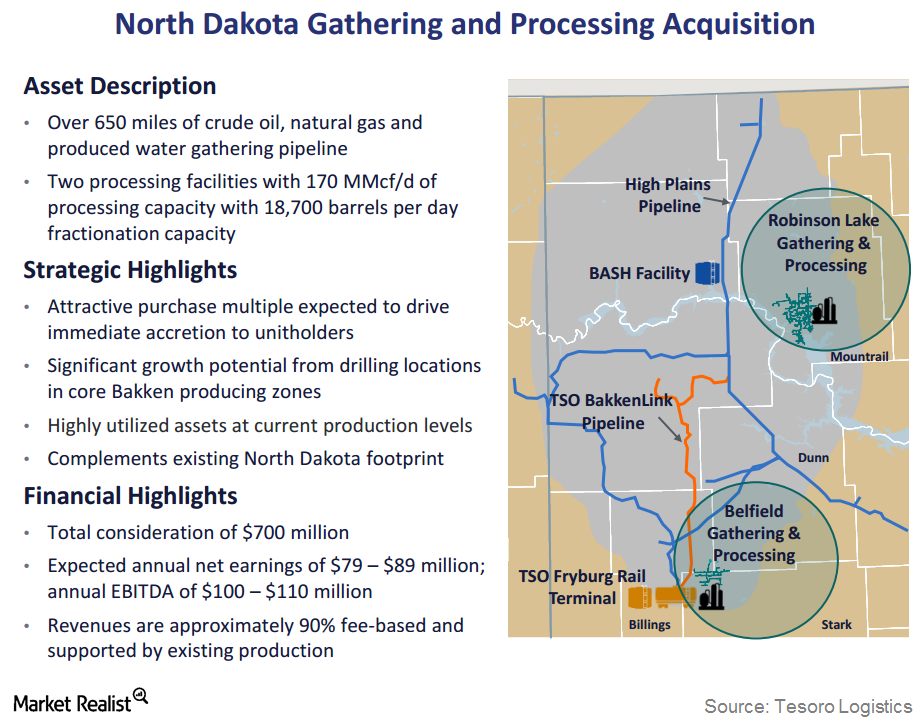
Whiting Petroleum Announces Bakken Midstream Divestiture
On November 21, 2016, Whiting Petroleum announced its intention to sell its Bakken midstream assets to an affiliate of Tesoro Logistics Rockies for $375 million.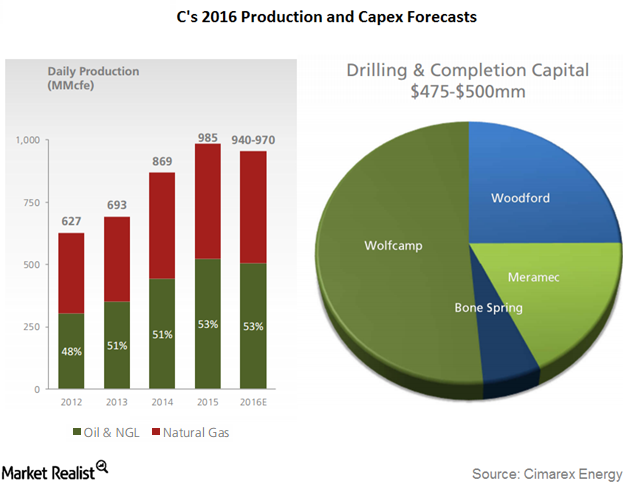
What Happened to Cimarex’s 1Q16 Production Volumes and Realized Prices?
Cimarex Energy’s (XEC) total production volume in 1Q16 was 973 MMcfe (millions of cubic feet equivalent). This represents a rise of ~3% YoY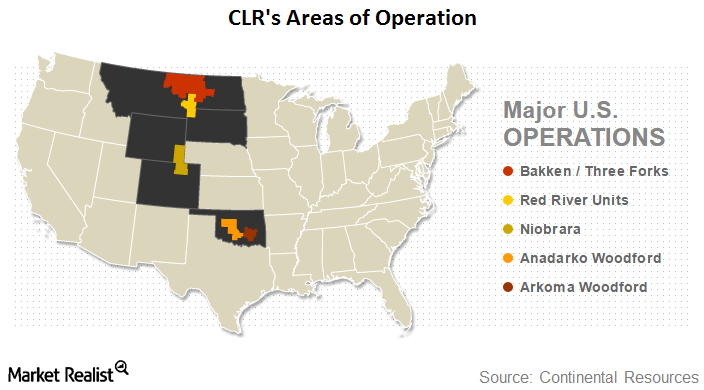
Continental Resources: An Introduction
In this series, we will analyze how badly Continental Resources (CLR) was hit by weak oil prices, and what measures it has taken to counter this situation. In 2015, crude oil accounted for 66% of CLR’s total production and 85% of its revenues.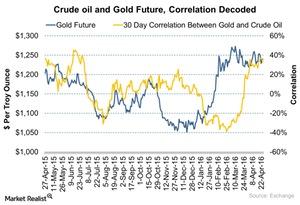
Gold and Crude Oil: How Does the Correlation Work?
Gold (GLD) can be considered an indicator of economic fear and inflation expectations. Driven by these fears, gold gains during equity market turmoil.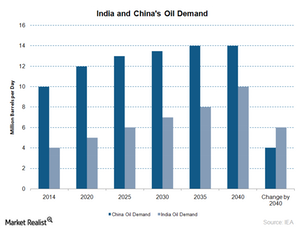
India’s Crude Oil Demand Will Likely Drive the Crude Oil Market
The EIA reported that India produced 1 MMbpd (million barrels per day) of crude oil in 2014 and 2015. It’s expected to increase marginally in 2016 and 2017.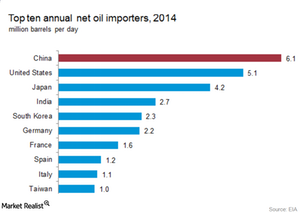
Top Crude Oil Importers’ Role in 2016
China and the United States are the largest crude oil importers in the world. In 2015, they consumed about 30.5 MMbpd (million barrels per day) of crude oil and liquid fuels, per the EIA.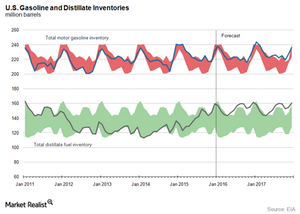
Gasoline and Distillate Inventories Overshadow Crude Oil Market
The EIA (U.S. Energy Information Administration) reported that the US gasoline inventory rose by 8.4 MMbbls to 240.4 MMbbls for the week ending January 8, 2016.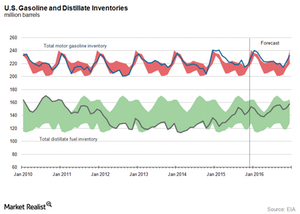
Will the Gasoline and Distillate Inventory Pressure Crude Oil Prices?
The API (American Petroleum Institute) published its weekly crude oil, gasoline, and distillate inventory report on January 12, 2016.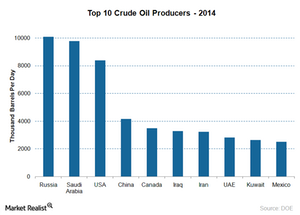
How Top Crude Oil Producers Impact the Crude Oil Market
The world’s largest producer of crude oil is Russia. It is also among the largest crude oil exporters.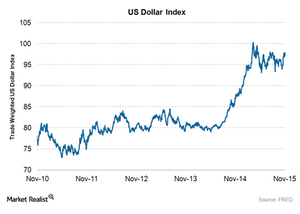
How Does the US Dollar Index Influence Crude Oil Prices?
Crude oil and the US Dollar Index are inversely related. The appreciation of the US dollar will negatively influence crude oil prices.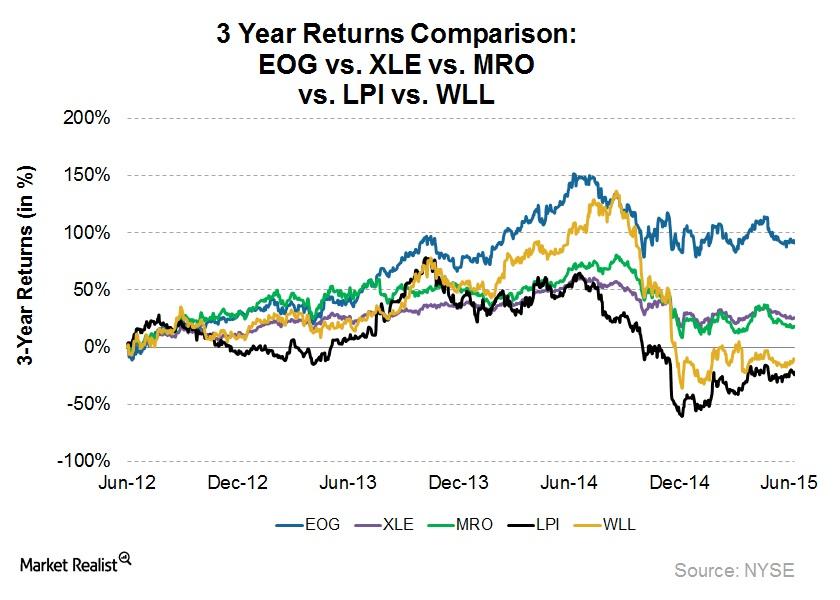
Why EOG Resources Is among the Best Upstream Stocks
EOG Resources (EOG) has generated above-par returns over a three-year period. EOG returned 91.8% in the last three years, mainly due to its strong performance.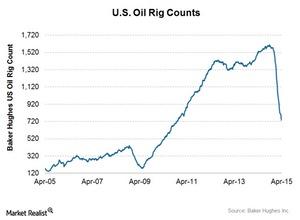
US Crude Oil Rig Count Down for 19 Straight Weeks
US crude oil rig count decreased by 26 for the week ended April 17 down from 760 to 734. The number of oil rigs is now at its lowest level since December 3, 2010.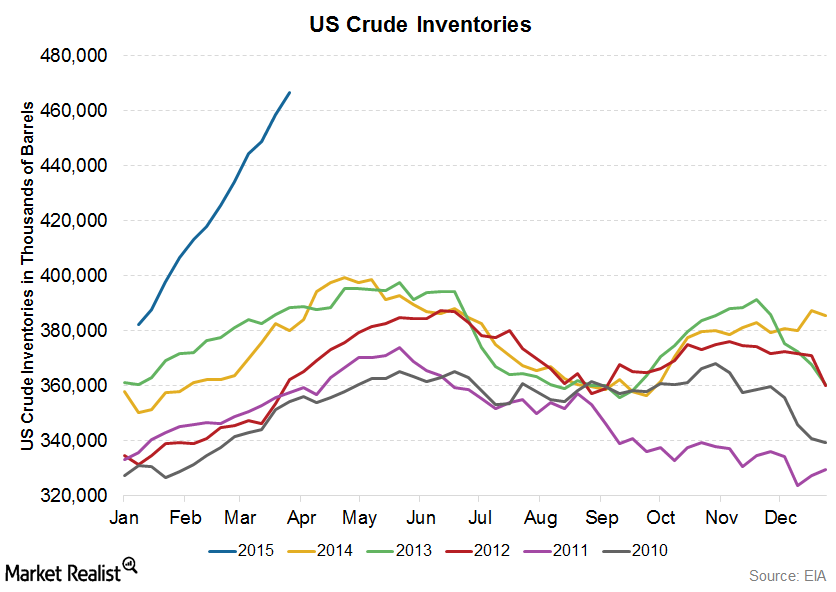
EIA Crude Oil Inventory Report: Essentials for Energy Investors
Crude oil inventory levels change based on demand and supply trends. Demand comes primarily from refineries that process this crude into refined products.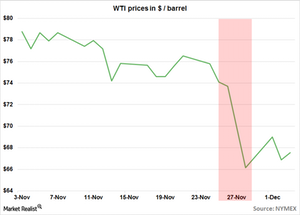
Why the bottom fell out of crude oil
Oil markets had been watching what OPEC would do in its November 27 meeting. Crude oil fell ~30% since June. It decided to stay production levels. Crude oil dropped ~10% after the news.
