Baker Hughes Co
Latest Baker Hughes Co News and Updates
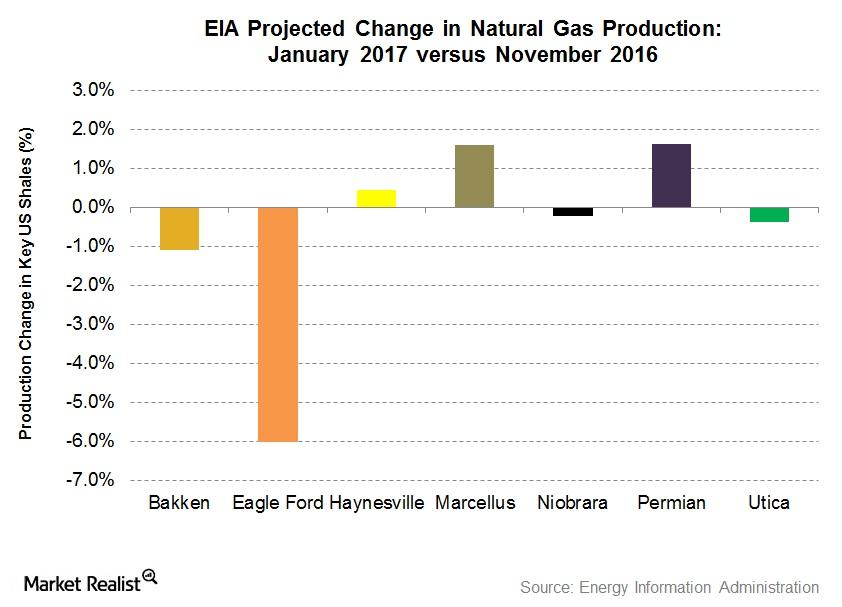
January 2017 EIA Estimates: US Shale Gas Production Could Fall
The EIA expects less natural gas production at four key US shales by January 2017 compared to November 2016. It expects production to rise at three key US shales.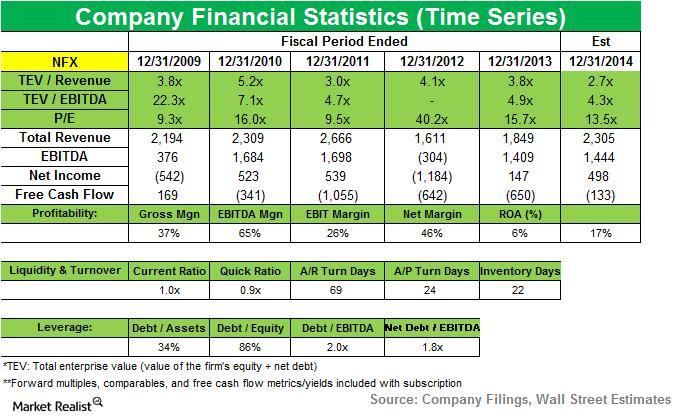
Balyasny exits position in Newfield Exploration Co.
BAM exited its position in Newfield Exploration Co. in 3Q14. It accounted for 1.31% of BAM’s second quarter portfolio. NFX is an energy company.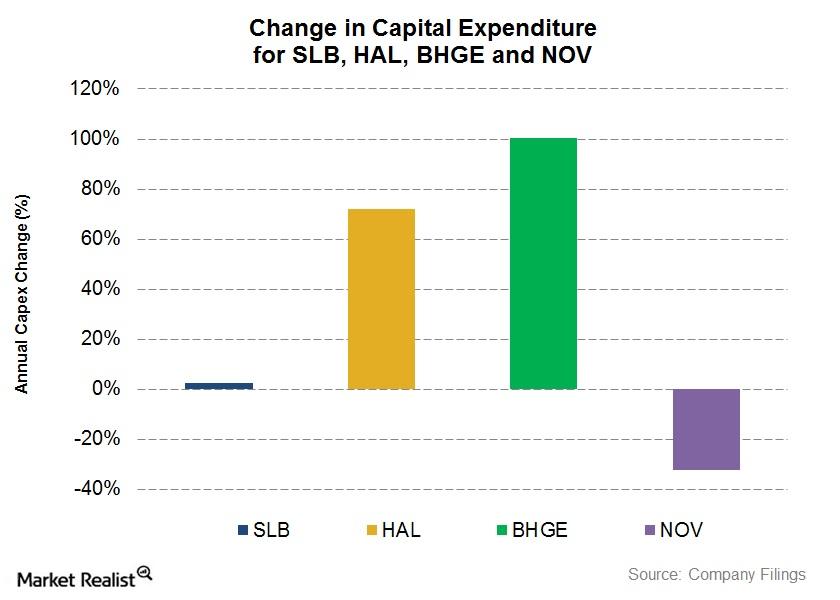
SLB, HAL, NOV, and BHGE: Comparing the Capex Growth
National Oilwell Varco’s (NOV) capital expenditure or capex fell ~32% in fiscal 2017—compared to its capex spend in fiscal 2016.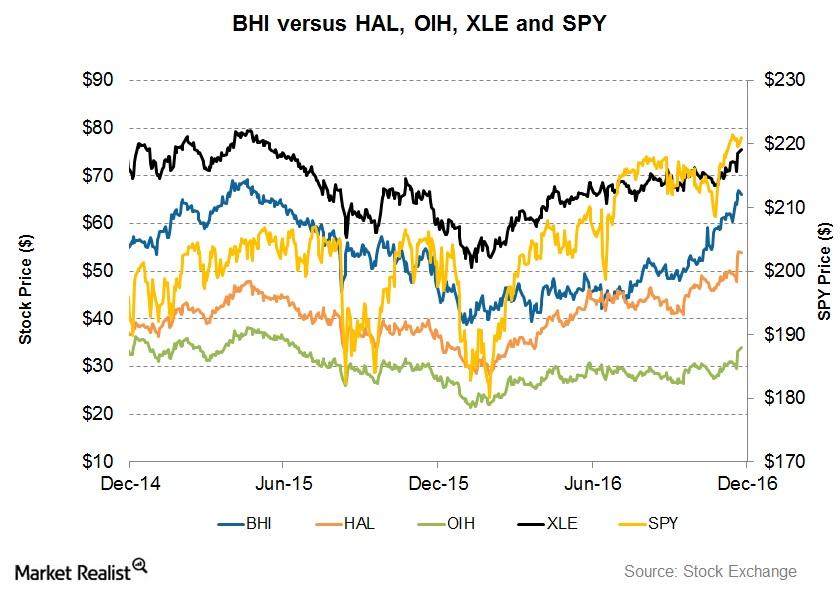
Will a Partnership with GE Improve BHI’s Returns?
Between December 2014 and December 2016, Baker Hughes (BHI) stock hit its peak in April 2015. It troughed at ~$39 in January 2016.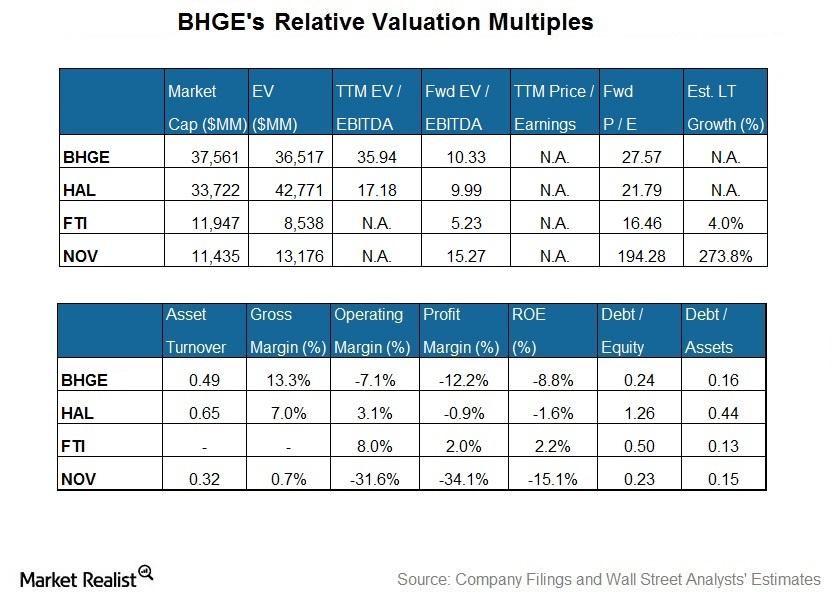
What’s Baker Hughes’s Current Valuation versus Peers?
Baker Hughes, a GE Company (BHGE), is the largest company by market capitalization in our select set of major oilfield services and equipment companies.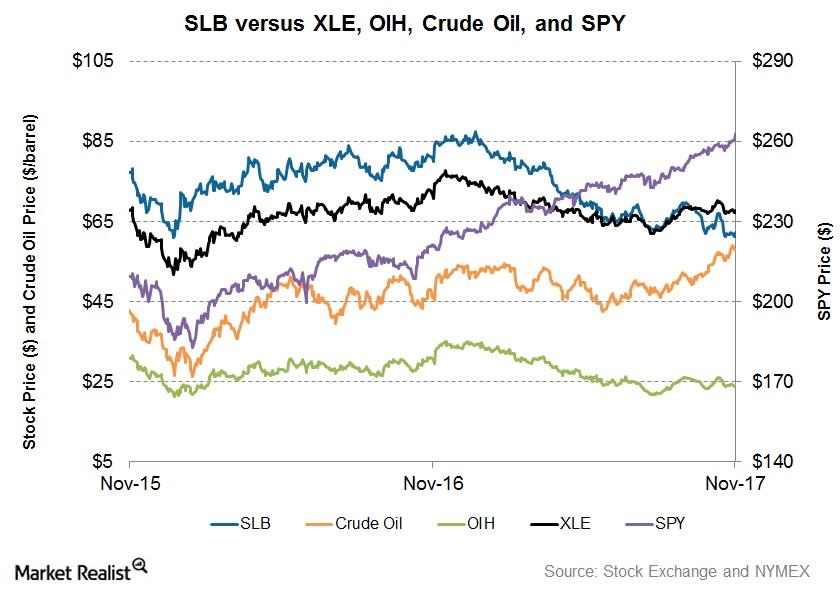
What Are Schlumberger’s SPM Project Plans?
In the past one year, SLB has performed nearly in line with the industry ETF and has hugely underperformed the broader market index.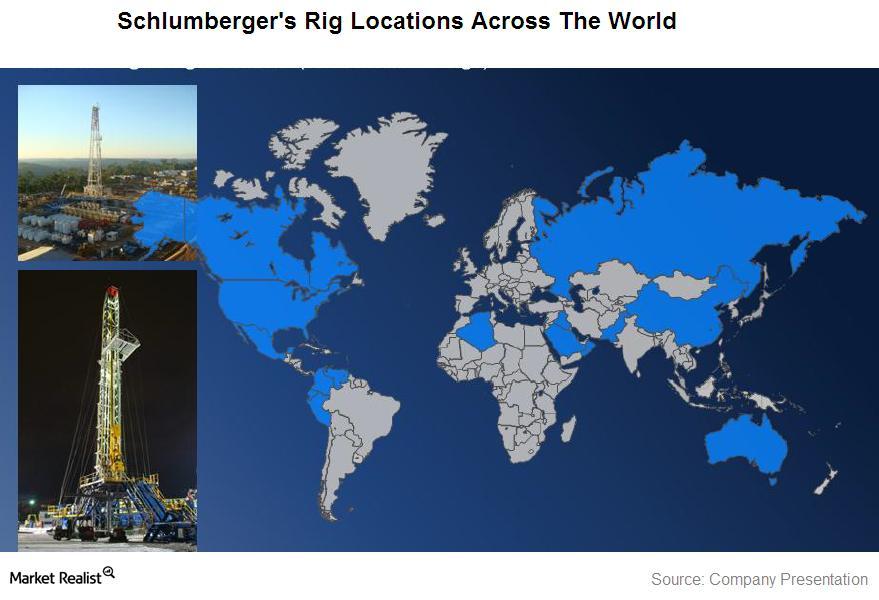
A quick overview of oil and gas field services biz Schlumberger
Schlumberger Limited is a Houston-based energy company. It provides technology, integrated project management, and information solutions to oil and gas exploration and production (or E&P) companies around the world.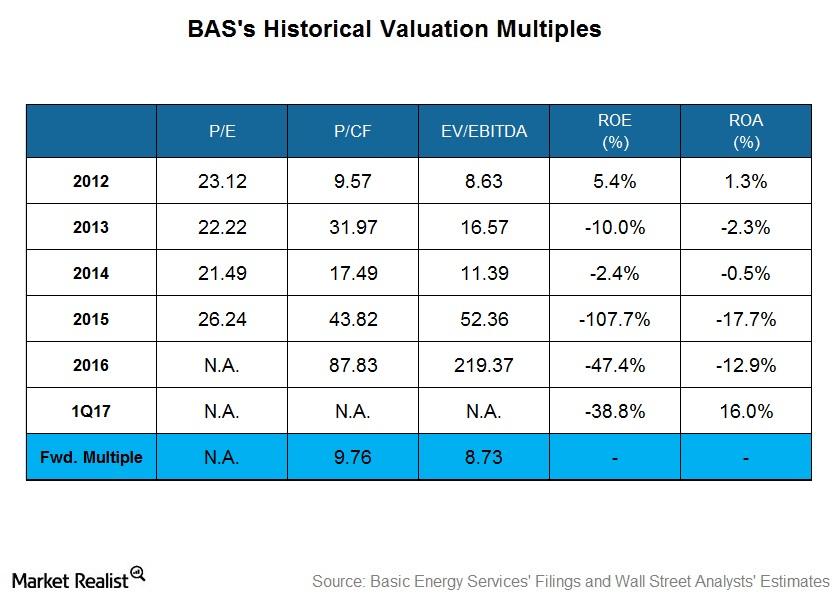
What Does Basic Energy Services’ Historical Valuation Suggest?
On March 31, 2017, Basic Energy Services’ (BAS) stock price had fallen 6% from December 30, 2016.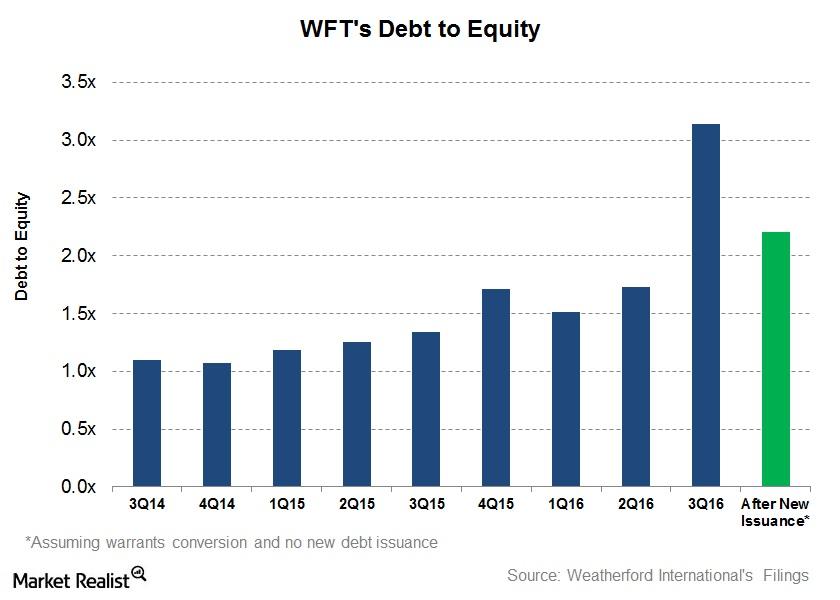
Weatherford International Issues Stocks Again
On November 16, Weatherford International (WFT), an oilfield equipment and services company, disclosed that it issued 84.5 million ordinary stocks.
The Top 5 Oilfield Companies by Net Debt-To-Equity Ratio
In this series, we’ll analyze the top five OFS (oilfield equipment and service) companies by net debt-to-equity ratio in fiscal 2017.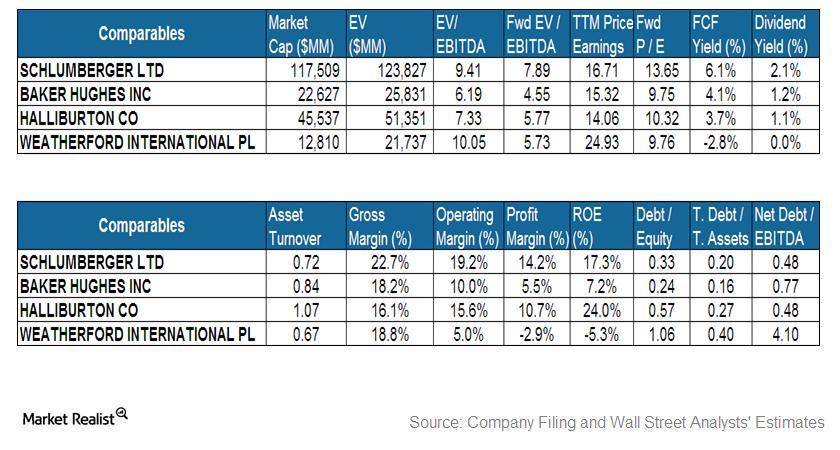
Must-read comparison: Schlumberger and its peers
Schlumberger’s yearly price-to-earnings ratio is in line with the group. Haliburton has the lowest price-to-earnings ratio.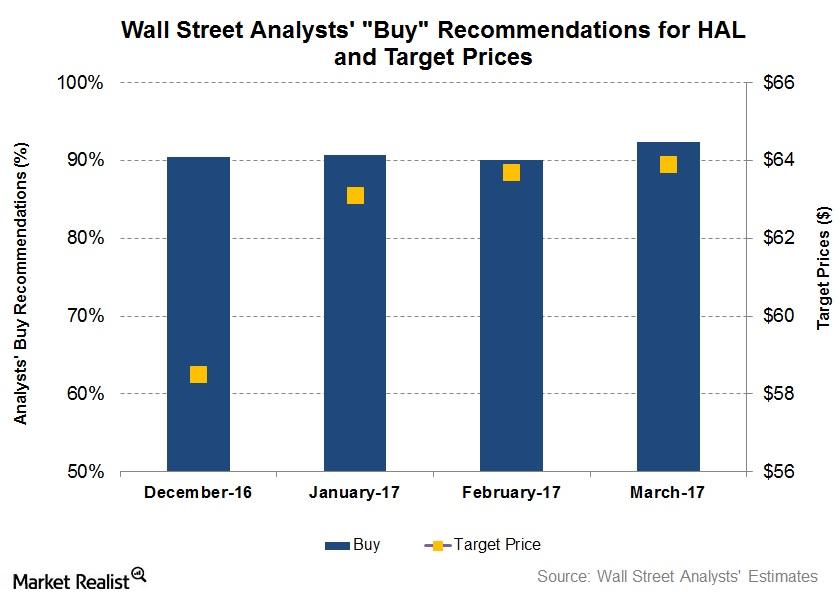
What Do Analysts Recommend for Halliburton?
On March 24, 92% of the analysts tracking Halliburton rated it as a “buy,” ~5% rated it as a “hold,” and 3% rated it as a “sell.”
ValueAct Capital discloses activist stake in Baker Hughes
Activist hedge fund ValueAct Capital declared a 5.1% stake in Baker Hughes in its 13D filing on January 15, 2015.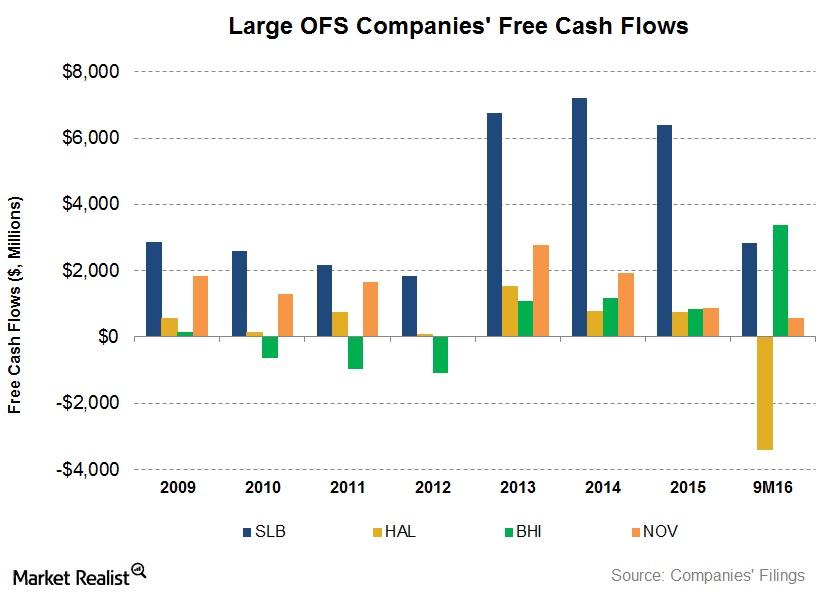
Free Cash Flow Trends: Are OFS Companies Burning Cash?
Many oilfield equipment and services (or OFS) companies’ cash flows have taken a beating following the energy price weakness in the past two years.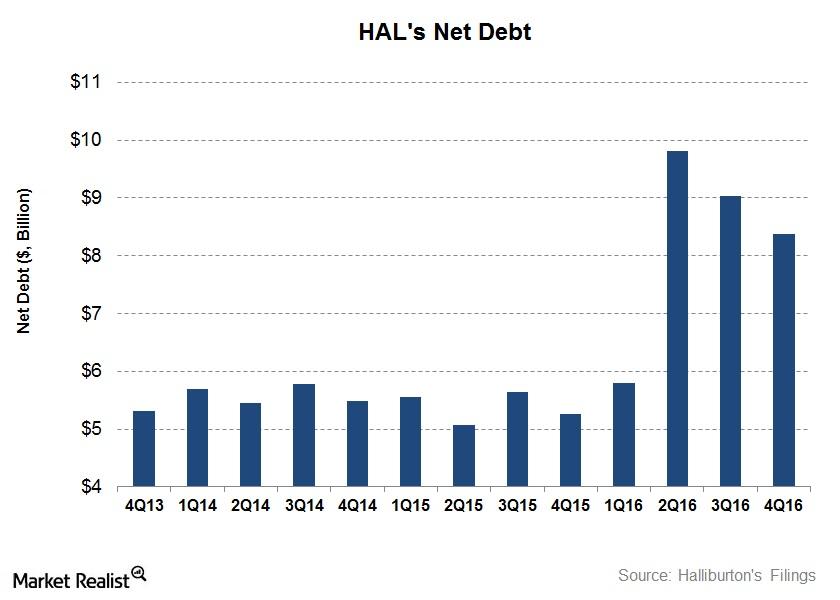
A Look at What’s Happening to Halliburton’s Debt
In 4Q16, Halliburton’s total debt fell 19% compared to a year earlier, and its cash and marketable securities fell 60%. In effect, its net debt rose 59% to ~$8.4 billion as of December 30, 2016.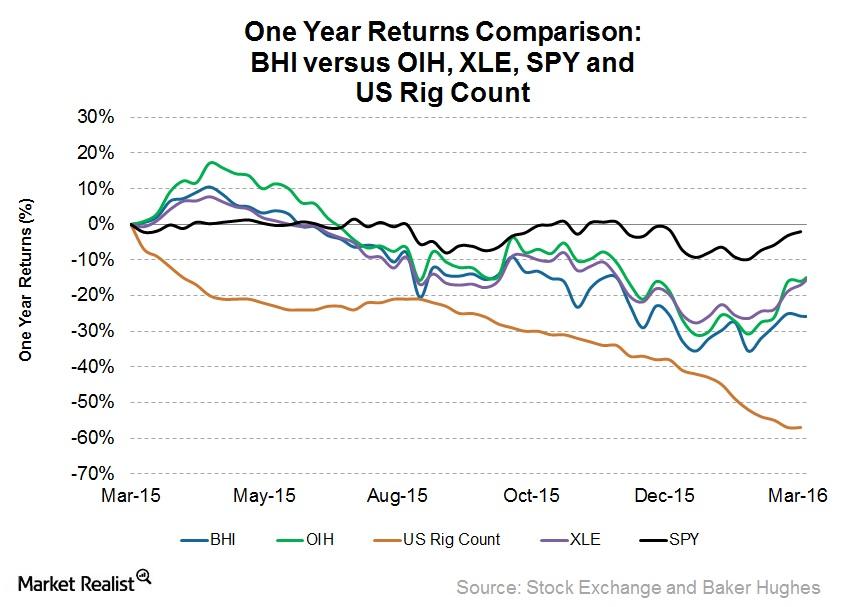
Why Did Baker Hughes Underperform the Industry ETFs?
Oilfield equipment and services companies like Baker Hughes (BHI) are affected by rig counts and energy prices. In the past year, West Texas Intermediate crude oil prices have dropped ~16%.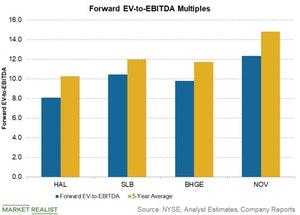
Why Is Halliburton’s Valuation Attractive?
Halliburton (HAL) is trading at a forward EV-to-EBITDA multiple of ~8.1x, which is lower than its five-year average multiple of 10.2x.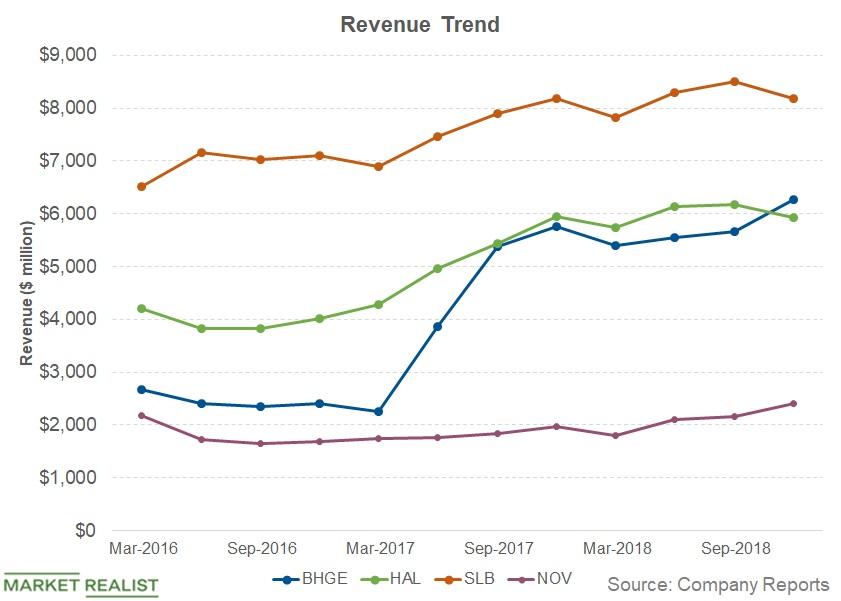
SLB, HAL, BHGE, and NOV: Analyzing the Revenue Trends
Halliburton (HAL) and National Oilwell Varco (NOV) recorded 16% revenue growth in 2018—compared to 2017.
Why Weatherford’s 1Q18 Earnings Beat Estimates
Weatherford International released its 1Q18 earnings results today.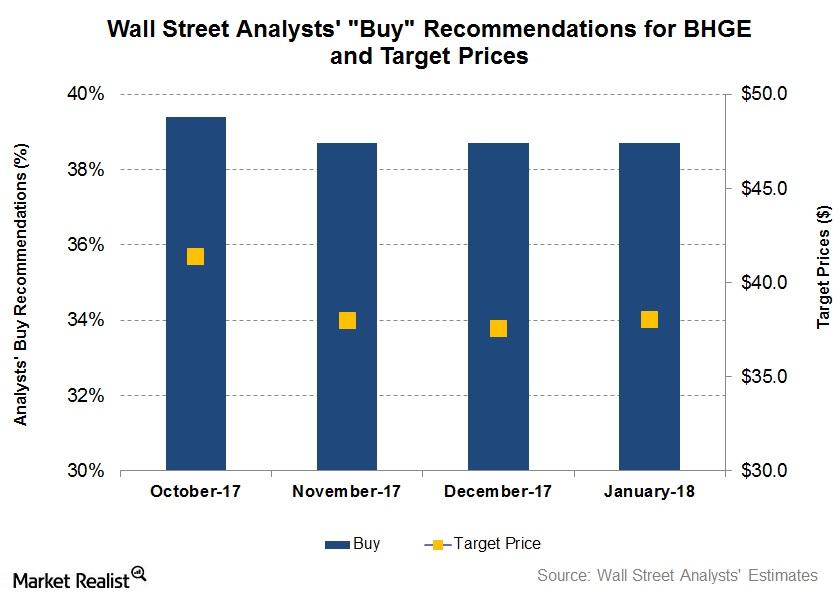
Wall Street’s Forecasts for Baker Hughes after Its 4Q17 Earnings
In this article, we’ll look at Wall Street analysts’ forecasts for shares of Baker Hughes, a GE company (BHGE) following its 4Q17 earnings release.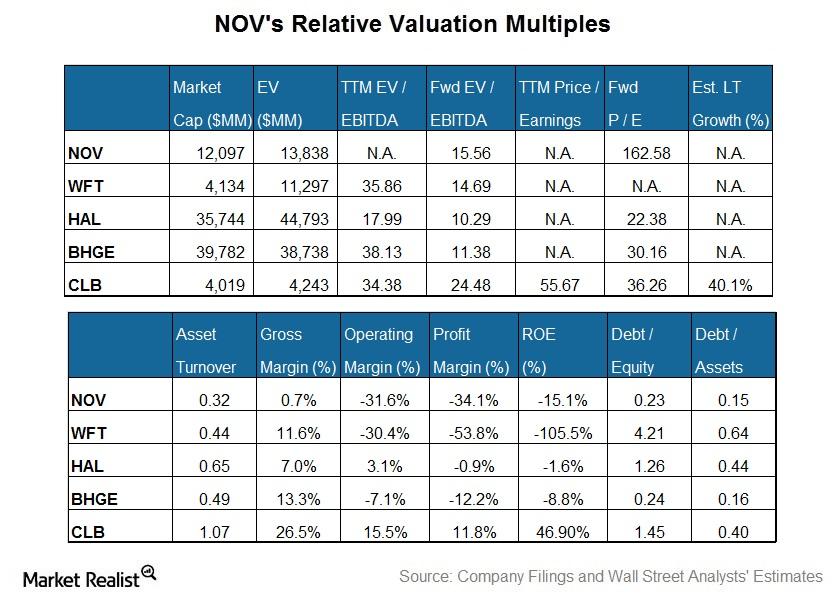
National Oilwell Varco’s Valuation Compared to Its Peers
National Oilwell’s valuation, expressed as the TTM PE (price-to-earnings) multiple, isn’t available due to its negative adjusted earnings.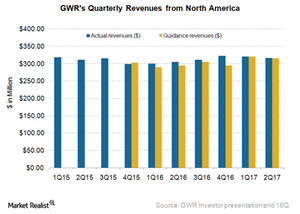
Genesee & Wyoming’s North American Revenues in 2Q17
In 2Q17, GWR’s North American revenues were $315.7 million, a 3.6% rise from $304.6 million in the same quarter last year.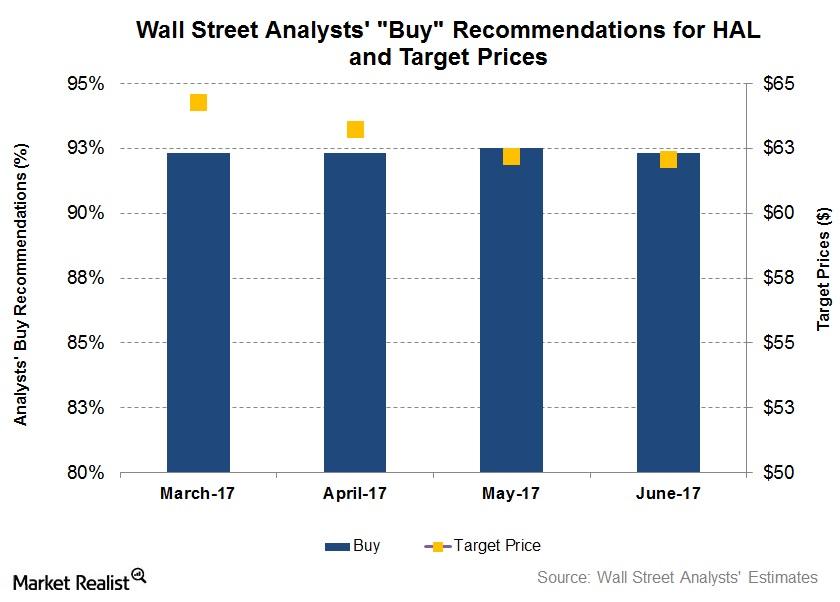
Analysts’ Recommendations for Halliburton
On June 12, 92% of the analysts tracking Halliburton rated it as a “buy,” ~3% of the analysts rated it as a “sell,” and the other 5% rated it as a “hold.”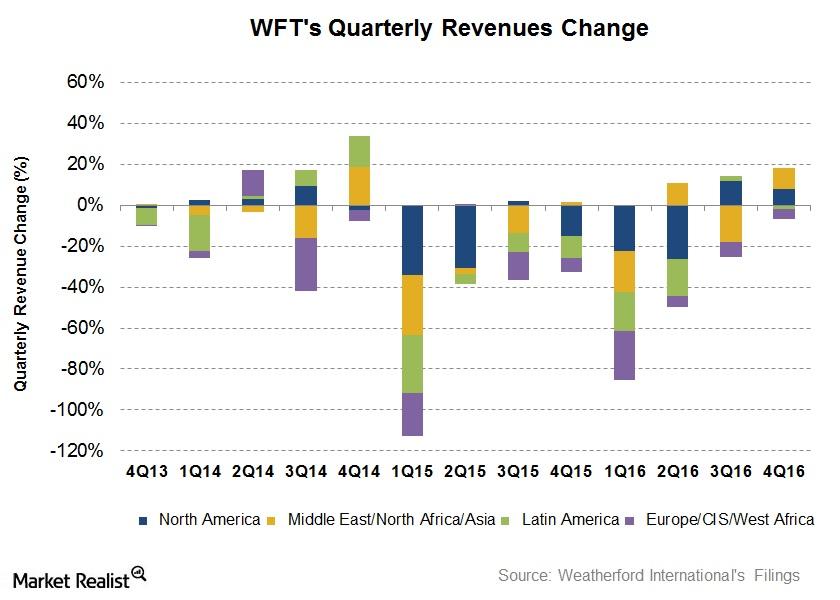
Analyzing Weatherford International’s Growth Drivers in 4Q16
Revenues from Weatherford International’s (WFT) Europe/Sub Saharan Africa/Russia region fell the most with a 36.5% fall from 4Q15 to 4Q16.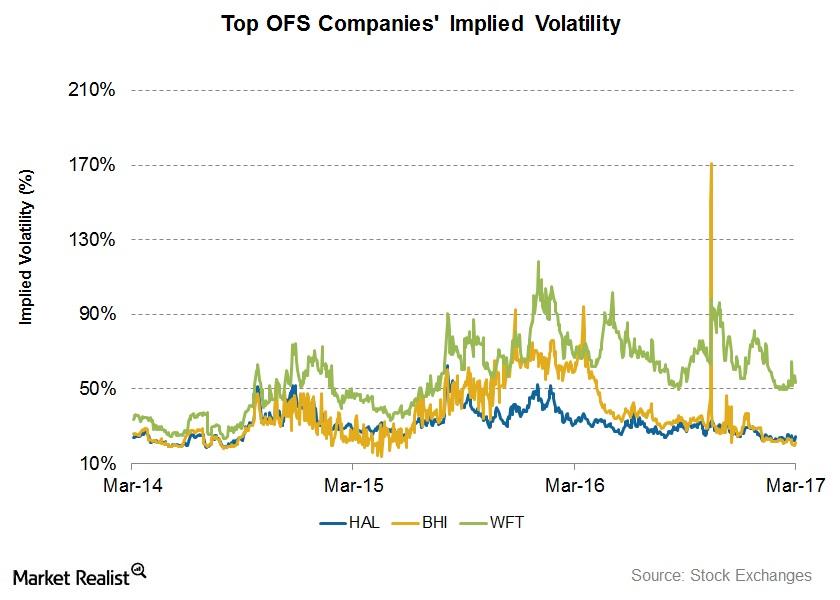
How Volatile Are the Top Oilfield Services Companies?
In this part of the series, we’ll compare the implied volatilities of the top OFS companies as rated by Wall Street analysts for 1Q17.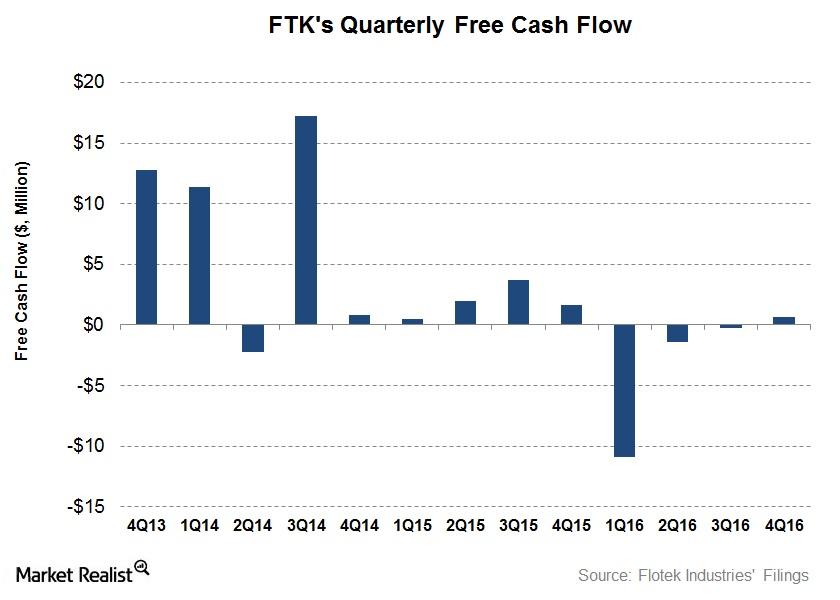
Flotek Industries’ Capex: Impact of a Credit Facility Agreement
In this article, we’ll analyze how Flotek Industries’ (FTK) operating cash flows trended over the past few quarters.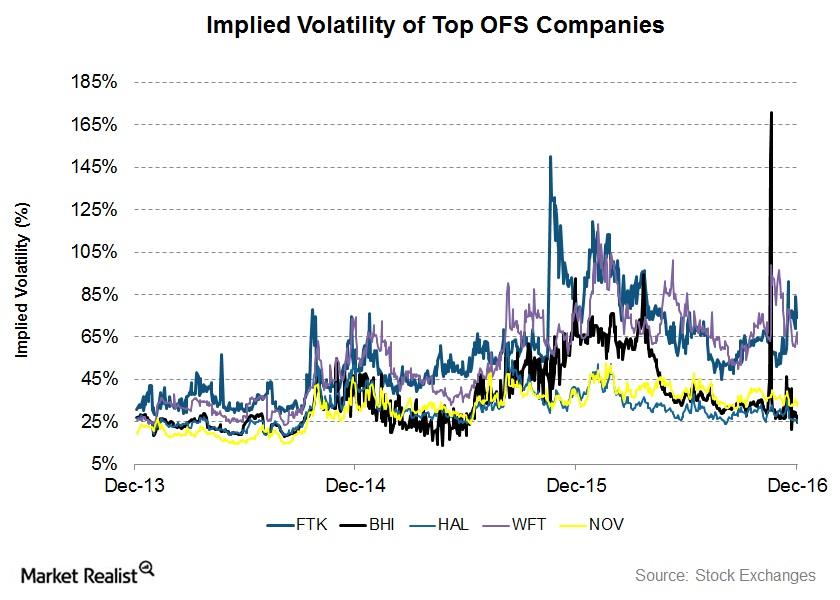
Top Oilfield Service Stocks: Analyzing Implied Volatility
In this article, we’ll compare implied volatility fr the top oilfield services (or OFS) companies, as rated by Wall Street analysts, for 4Q16.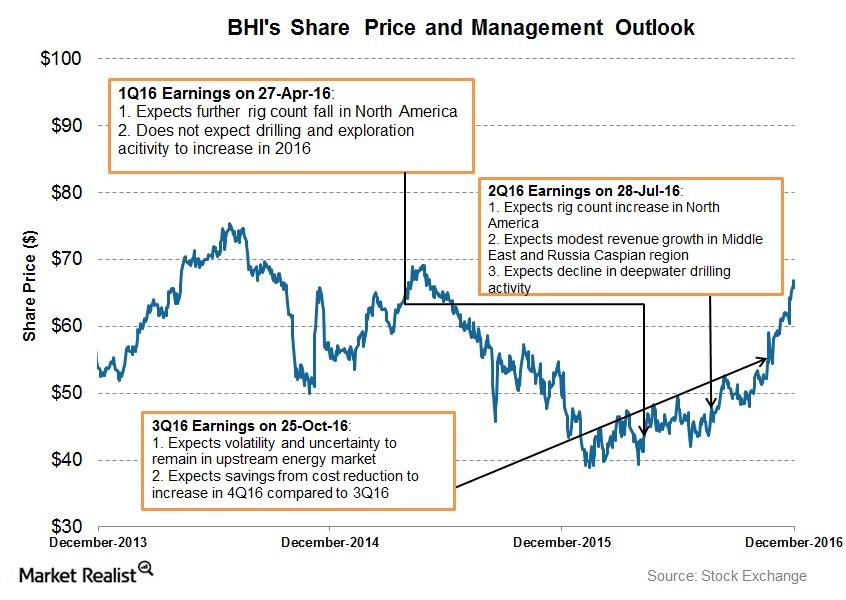
How Does Baker Hughes’s Management View 4Q16?
In 4Q16, Baker Hughes’s (BHI) management expects a trade-off between strong North American upstream activity and a weaker international energy environment.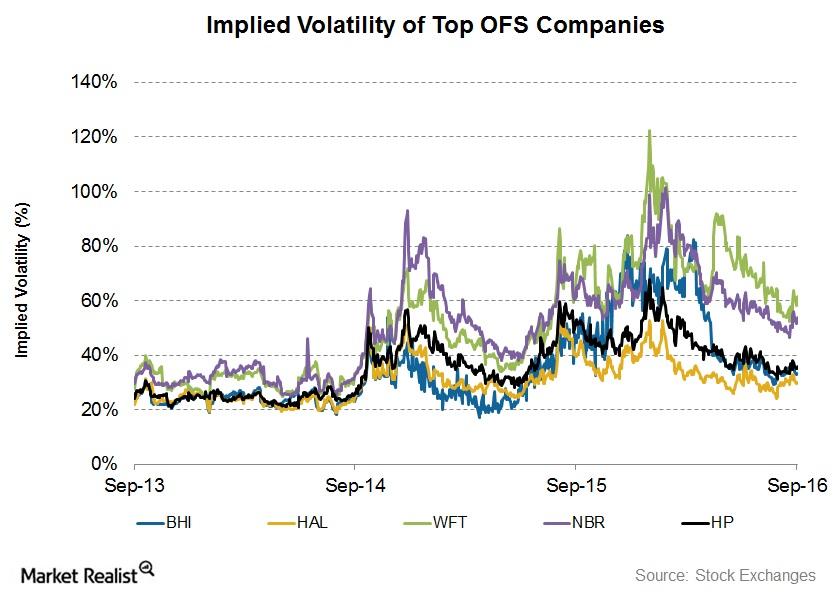
Implied Volatility: Analyzing the Top Oilfield Service Companies
On September 22, Halliburton’s implied volatility was ~28.5%. Since July 20, 2016, its implied volatility rose from ~27% to the current level.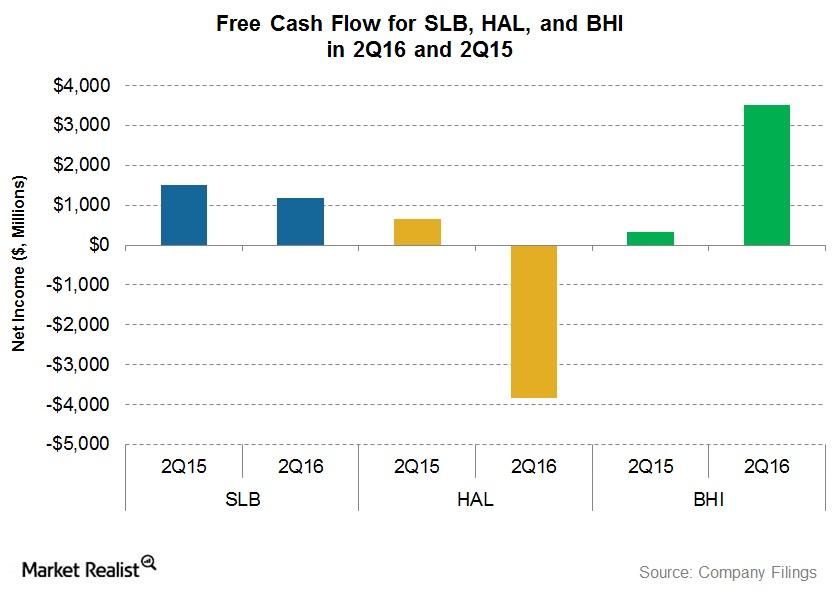
Why Is Schlumberger’s Free Cash Flow So Remarkable?
In this part of the series, we’ll take a look at free cash flow for Schlumberger (SLB), Halliburton (HAL), Baker Hughes (BHI), and FMC Technologies (FTI).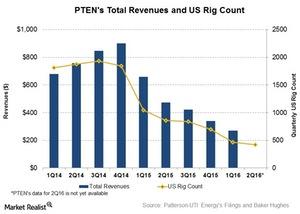
Will Rig Count Affect Patterson-UTI Energy in 2Q16?
In 1Q16, the US rig count declined by 56% over 1Q15. During this period, the international rig count decreased by only 21%.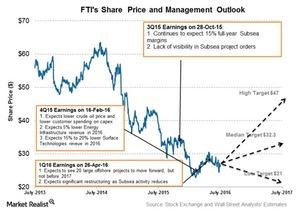
A Look at FMC Technologies’ Outlook and the Technip Merger
FMC Technologies’ management believes that the company’s subsea segment could win a number of projects, which could help steady its revenue and income.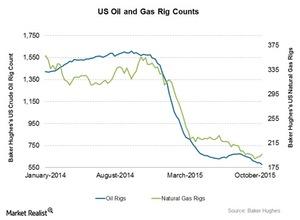
How the Late October Oil Rig Count Dip Hurt the Total US Rig Count
By October 30, 2015, the total US rig count fell by 16 crude oil rigs. The number of crude oil rigs has continued to fall in the past nine weeks.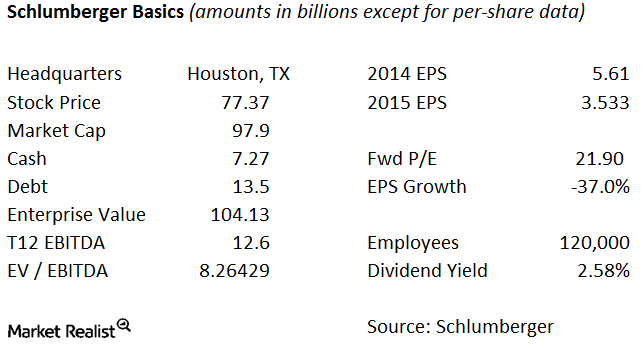
Basics of Schlumberger
Schlumberger (SLB) provides technology, project management, and information technology services to the oil and natural gas exploration and production industry.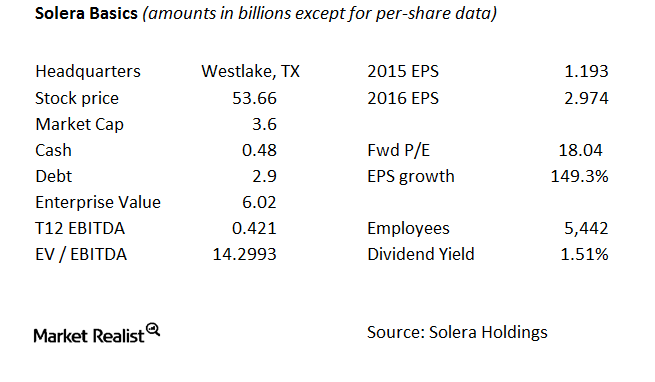
The Basics of Solera
Solera connects insurers and auto service providers. Its software is used by auto insurance companies, auto dealers, collision repair facilities, assessors, auto recyclers, and various other entities.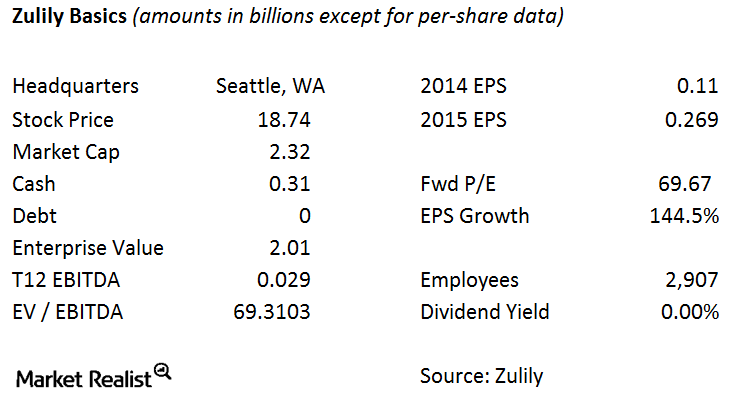
Basics of Zulily
With relationships with emerging and boutique designers, online retailer Zulily uses proprietary technology to match its customers with vendors. This technology is a major reason why Liberty Interactive is buying Zulily.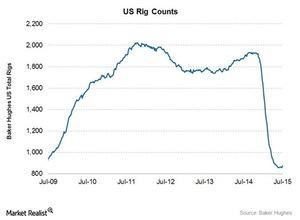
Biggest US Rig Count Rise in a Year: What Does It Change?
Despite recent rises, at 876, the US rig count is still at its lowest level since January 2003. In September 2014, the average rig count came close to the record, reaching 1,931.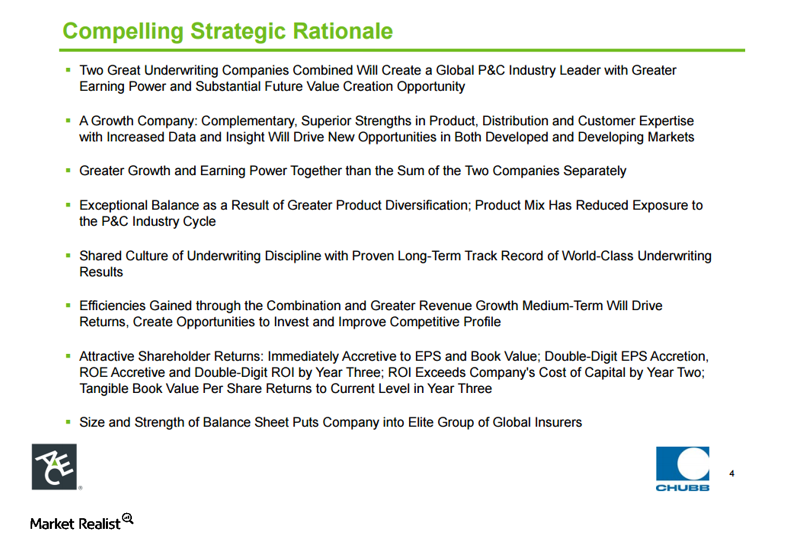
What Is the Rationale for the ACE–Chubb Merger?
The biggest rationale for the ACE–Chubb merger is the potential for cost-cutting. By combining with Chubb, ACE Limited is creating a leading player in property and casualty insurance.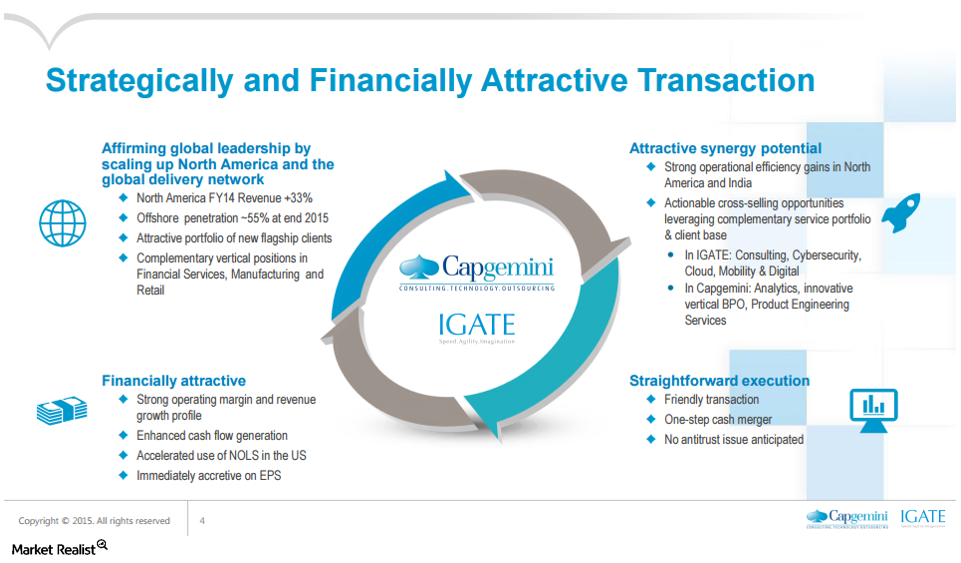
Rationale for Capgemini’s Acquisition of IGATE
The acquisition bolsters Capgemini’s exposure in the financial verticals—where IGATE is particularly strong—as well as manufacturing, retail, and healthcare.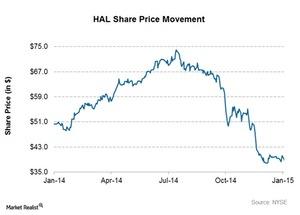
Must-know: An overview of Halliburton
Halliburton (HAL) is a Texas-based energy company. It’s an oil and gas equipment and service provider. In the past year, Halliburton’s stock price went down ~22%.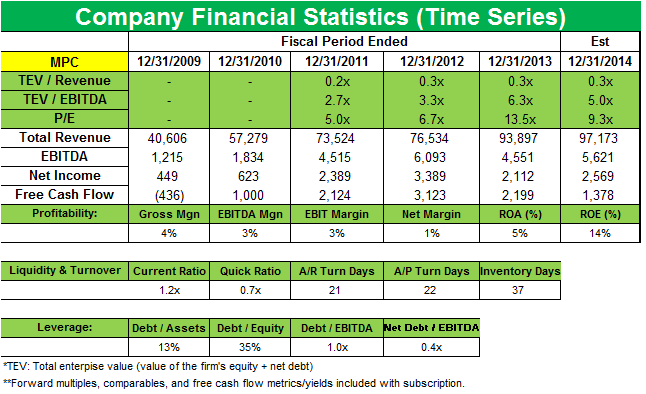
Soros Fund Management opens a new position in Marathon Petroleum
George Soros’ Soros Fund Management added a new position in Marathon Petroleum (MPC) that accounts for 0.45% of the fund’s 1Q 2014 portfolio.