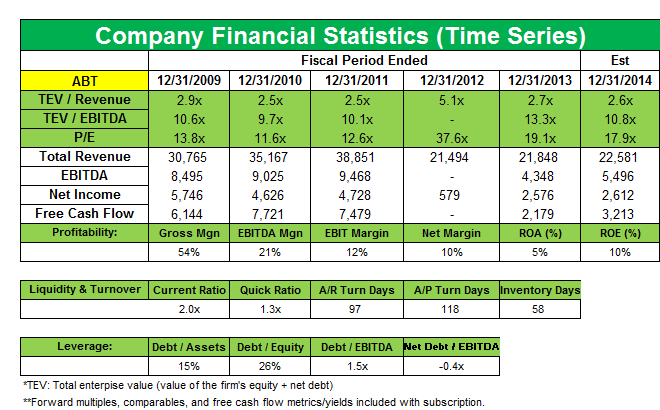
FinancialsJobs Report: Why It’s the Highlight of the WeekThere isn’t much real estate–related economic data this week. There are some important macro reports as well as the jobs report on Friday.
FinancialsCredit Karma’s Free Credit Reports Helped Make It a Startup Worth $7.1 BillionSee how accurate Credit Karma’s credit reports are, how its credit monitoring works, and what reviewers say about its savings accounts.
FinancialsJim Mahoney, the Bank of America Executive Who Thrived in CrisesBank of America executive Jim Mahoney was responsible for rebuilding the company’s corporate image after the 2008 financial crisis.
FinancialsCapital One Fined $80 Million for 2019 Data BreachCapital One was fined $80 million over a 2019 data breach. The hack was carried out by Paige Thompson, a former Amazon employee.
FinancialsIs AXP Stock a ‘Sell’ after Its Q1 Earnings?Today at 7:02 AM ET, AXP stock rose 1.1% to $84.10 in the pre-market session. The company reported its first-quarter earnings results on April 24.
Earnings ReportIs It Pointless to Look at Big Banks’ Q1 Earnings?JPMorgan Chase will announce its first-quarter results before the markets open on April 14. Analysts expect the bank to post revenues of $29.7 billion.
FinancialsThe Difference between Corporate Bonds and TreasuriesBond investors should understand the difference between Corporate Bonds and Treasuries. Below is a list of the key differences between the two.
FinancialsThe 2019 US Stock Market Crash that Never Came!Global stock markets added $17 trillion in value this year. A year back, most economists saw dismal stock market returns in 2019.
Company & Industry OverviewsBill Gross: Top Stock Picks with High Dividend YieldsOn October 18, CNBC reported Bill Gross top picks. His top stock picks were Annaly Capital (NLY), Invesco (IVZ) and Allergan (AGN).
FinancialsAmerican Airlines Cancels Boeing MAX Flights Until AprilAmerican Airlines has pushed back the grounding of Boeing’s 737 MAX planes until April 2020. Read about how this will affect AAL and other airlines.
ConsumerHow to Hedge Against the US-China Trade WarThe US-China trade war escalated very quickly this month. This has caused global equities to plunge and safe havens like gold and treasuries to surge.
Company & Industry OverviewsWalmart Coin: A Bigger Deal than FB’s Libra and Bitcoin?Retail giant Walmart (WMT) had applied for a digital coin patent. The news comes just as Facebook (FB) is pushing for its own cryptocurrency, Libra.
Cryptocurrency & BlockchainHow Long Will the Bitcoin Rout Last?After hanging out near the $10,000 level for a while and testing investors’ patience, Bitcoin (BTC-USD) has made headlines once again—but not in a good way.
Cryptocurrency & BlockchainIs Tim Draper ‘Crypto Crazy’ after Huge Bitcoin Prediction?An early investor in Twitter and Tesla, billionaire venture capitalist Tim Draper expects to see Bitcoin reach $250,000 in 2022 or 2023.
FinancialsDow Jones Faces Several Litmus Tests Next WeekThe Dow Jones Index (DIA) fell 0.6% last week but is still trading near its all-time highs. This week, we have several potentially market-moving events.
Company & Industry OverviewsRay Dalio, the Role of Credit, and the Economic MachineCredit is the most important part of the economy, leading to increased spending, increased income levels, higher GDP, and faster productivity growth.
FinancialsWhat Are Candlestick Patterns in Technical Analysis?In technical analysis, candlestick patterns are a combination of one or more candlesticks. The patterns form over short time periods. The patterns form due to stock prices’ daily supply and demand forces.
Company & Industry OverviewsDisney, Apple Set Sights on Activision BlizzardAn Activision Blizzard–Disney merger is looking very possible. After months of stock price decline, Activision Blizzard (ATVI) has become an acquisition target for several companies.
FinancialsThe main players in asset managementThe efficient market hypothesis maintains that the market prices everything correctly and so it isn’t possible to outperform the market in the long run.
FinancialsHow big is the asset management industry?Audited and verified annual figures at the end of 2013 indicate that total assets under management of US registered investment companies equalled nearly $17.1 trillion.
FinancialsThe salient features of mutual fundsThere are investors who are willing to take on higher risk to generate above-average market returns. For these investors, active funds offer the optimal investment avenue.
FinancialsUnderstanding The Doji Candlestick Pattern In Technical AnalysisThe Doji candlestick pattern has a single candle. In this pattern, the stock opening and closing prices are equal. The pattern forms due to indecision between the buyers and sellers in the stock market.
FinancialsThe Hammer And Hanging Man Candlestick PatternThe Hanging Man pattern is the same as the Hammer pattern. When a Hammer pattern forms in an uptrend, it’s the Hanging Man pattern. The pattern has one candle.
FinancialsUnderstanding The Spinning Top And Marubozu Candlestick PatternThe Marubozu candlestick pattern has a single candle. It forms anywhere in the trend. It can be a long and bearish candle. It can also be a long and bullish candle.
FinancialsThe Inverted Hammer And Shooting Star Candlestick PatternA Shooting Star candlestick pattern has one candle. It looks like a shooting star. The open, close, and low are near the low of the candlestick.
FinancialsAnalyzing The Morning Star And Evening Star Candlestick PatternThe Evening Star candlestick pattern is also a reversal pattern. The pattern has three candles. It forms at the top of an uptrend. The first candle is any long and bullish candle.
FinancialsThree Black Crows And Three White Soldiers Candlestick PatternThe Three White Soldiers candlestick pattern is also a reversal pattern. It forms at the bottom of a downtrend. The pattern has three candles. All three of the candles are long and bullish.
FinancialsThe Bearish Engulfing and Bullish Engulfing Candlestick PatternThe Bullish Engulfing candlestick pattern is a reversal pattern. The pattern has two candles. The first candle is small and bearish. The second candle is long and bullish.
FinancialsDark Cloud Covering And Piercing Candlestick PatternThe Piercing candlestick pattern is a reversal pattern. The pattern has two candles. The first candle is bearish. The second candle is bullish.
FinancialsCitigroup globally established in emerging marketsCitigroup’s exposure in emerging markets is mainly to investment-grade global multinationals through its institutional businesses.
FinancialsWhat’s the Dow Theory?The Dow Theory was developed by Charles Dow. It identifies and signals the change in the stock market trends. It’s useful for trading and investing. The Dow Theory has six components.
FinancialsWhy it’s important to understand the Dow TheoryThe Dow Theory assumes that when a stock market is entering an uptrend or downtrend, the financial markets should agree with each other.
FinancialsWhy is the Elliott Wave Theory important in technical analysis?In the last part of this series, we provided an overview of the Elliott Wave Theory. In this part of the series, we’ll discuss the psychology behind the Elliott Wave Theory’s two phases.
FinancialsTechnical indicators and the Relative Strength IndexThe Real Strength Index (or RSI) is a measure of a stock’s overbought and oversold position. The commonly used RSI is a 14-day RSI. It refers to the 14-day stock price that’s used to calculate the RSI.
FinancialsInterpreting volume in technical analysisIn technical analysis, volume measures the number of a stock’s shares that are traded on a stock exchange in a day or a period of time. Volume is important because it confirms trend directions.
FinancialsConnection Between Equities And High Yield BondsEquities and high yield bonds perform well when the economy is improving, and both underperform when the economy is slumping.
ConsumerValueAct gets seat on Armstrong World Industries’ boardWhile Armstrong’s 3Q14 results beat estimates, its consolidated net sales fell slightly compared to 3Q13, due to lower volumes in Europe and lower sales of resilient and wood flooring in the Americas.
FinancialsA key overview of Adage Capital’s holdings in 3Q14Adage Capital’s US long portfolio grew from $38.69 billion in 2Q14 to $40.2 billion in 3Q14. The portfolio comprised around 699 stocks.
ConsumerMaverick Capital lowers position in Baidu, Inc.Maverick Capital lowered its position in Baidu, Inc. in 3Q14. The position accounts for 0.36% of the fund’s total portfolio in the third quarter.
ConsumerFarallon Capital initiates position in Tim HortonsFarallon Capital Management started a new position in Tim Hortons Inc. (THI) during the third quarter of 2014. The position accounted for 2.62% of the fund’s 3Q14 portfolio.
FinancialsZoetis: An attractive business modelZoetis said in a recent statement that “its unique characteristics have established the company as the world leader in animal health, growing revenue faster than the market for the last three years.”
ConsumerMust-know trends that drive Zoetis’ growthDemand for Zoetis’ products is driven by a growing population coupled with a rising middle class in emerging markets and increased relocation from rural to urban areas.
FinancialsTechnical analysis – technical indicators, Dow Theory, and Elliott Wave TheoryWe’ll discuss the importance and use of these technical indicators. These indicators are useful in determining trends and making informed decisions.
FinancialsGG’s merger and acquisition strategy is different than its peersAlthough every gold miner talks about only doing merger and acquisition (or M&A) strategies that are in shareholders’ best interests, GG sticks to its strategy—unlike most of its peers.
FinancialsTechnical analysis—the rectangle, flag, and pennant patternsIn the rectangle pattern, it’s advisable to buy stock at support and sell at resistance. This pattern is formed in the uptrend and downtrend.
FinancialsWhy the inverted head and shoulder pattern is formedThe inverted head and shoulder pattern is the reverse of the head and shoulder pattern. It’s formed at the bottom of the downtrend.
FinancialsDouble top and double bottom patterns in technical analysisThe double top pattern forms in the uptrend. In this pattern, two consecutive peaks are formed. The peaks both have roughly the same price level.
FinancialsWhy investors should buy stocks during an uptrendStocks are in an uptrend when they’re making higher highs and higher lows. An uptrend forms when psychological or fundamental factors are improving.
FinancialsWhy downtrends and sideways trends impact investorsIt’s advisable to sell stocks on bounces when the stock is in a downtrend. In a sideways trend, it’s advisable to buy stock at support levels and sell at resistance levels.
FinancialsWhy technical analysis uses price patternsPrice patterns are trends that occur in stock charts. The charts are used in technical analysis. The pattern forms recognizable shapes. Price patterns are used to forecast the prices.