
Alex Chamberlin
Disclosure: I am in full compliance with all ethics and other policies for Market Realist research analysts. I am not invested in securities that I cover on Market Realist.
More From Alex Chamberlin
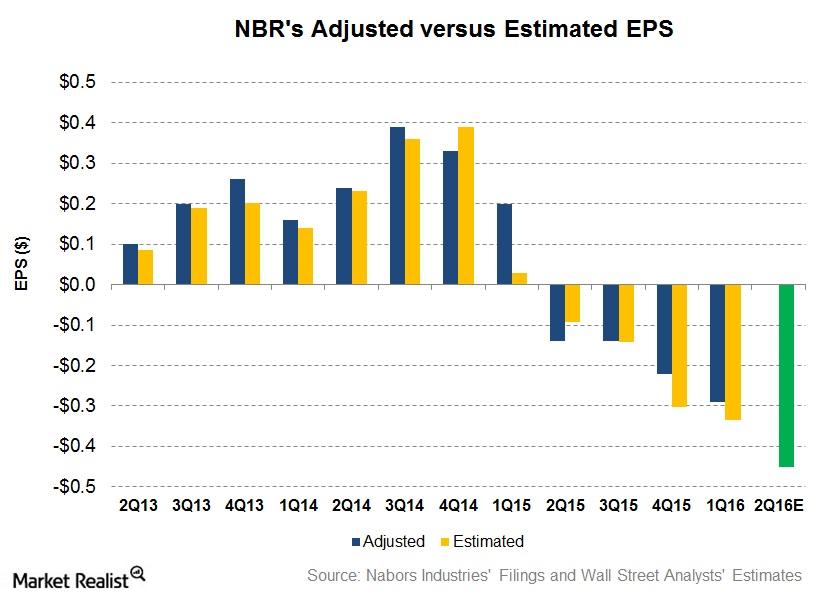
What Do Analysts Expect from Nabors Industries’s 2Q16 Earnings?
In 2Q16, Wall Street analysts expect an adjusted loss per share of $0.45 for Nabors Industries (NBR). NBR will release its 2Q16 financial results on August 2.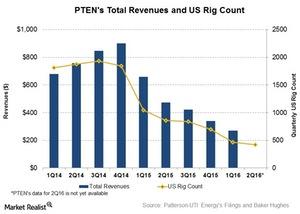
Will Rig Count Affect Patterson-UTI Energy in 2Q16?
In 1Q16, the US rig count declined by 56% over 1Q15. During this period, the international rig count decreased by only 21%.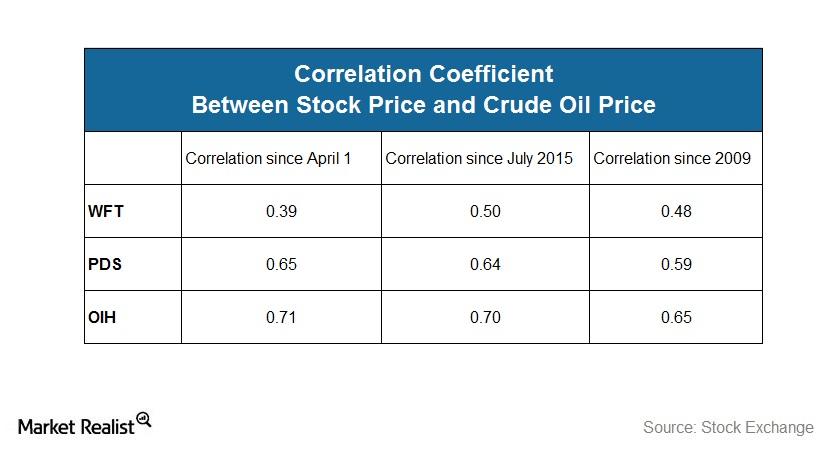
Has WFT’s Correlation with Crude Oil Fallen since 1Q16?
In this article, we’ll analyze the correlation between Weatherford International’s (WFT) stock price and West Texas Intermediate (or WTI) crude oil’s price.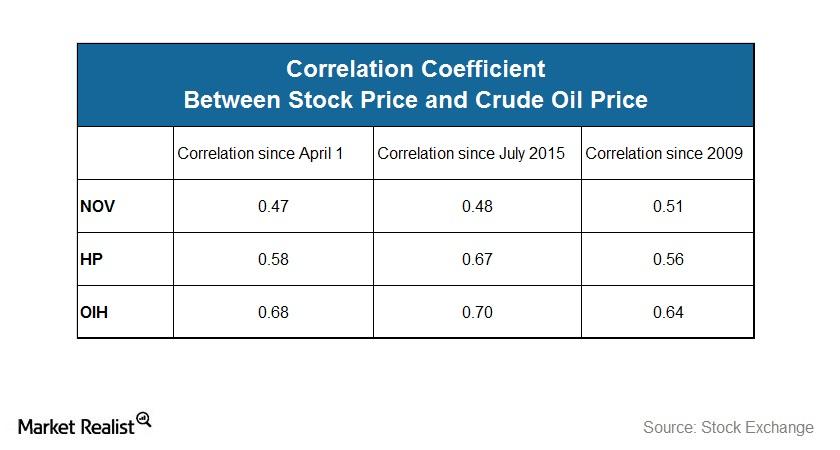
Has NOV’s Correlation with Crude Oil Decreased since 1Q16?
The correlation coefficient between National Oilwell Varco and crude oil’s price measures the statistical relationship between the two variables.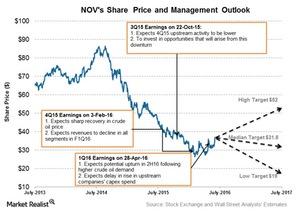
National Oilwell Varco: Management’s Estimates for 2Q16
National Oilwell Varco’s management expressed optimism about a potential crude oil production and demand revival in 2H16.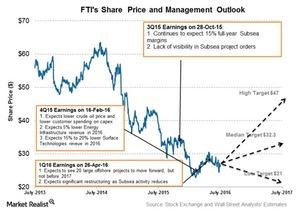
A Look at FMC Technologies’ Outlook and the Technip Merger
FMC Technologies’ management believes that the company’s subsea segment could win a number of projects, which could help steady its revenue and income.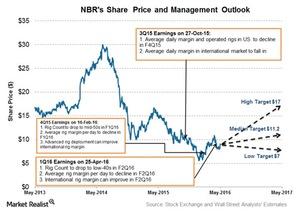
What Are Nabors Industries’ Management Views for 2016?
Nabors Industries’ management expects high performance rigs to perform better when the energy market recovery starts.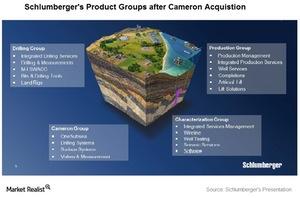
How Business Models Affect SLB’s or WFT’s Performances
In the OFS industry, Schlumberger has clearly been dominant while Weatherford International is now considered one of the weaker names.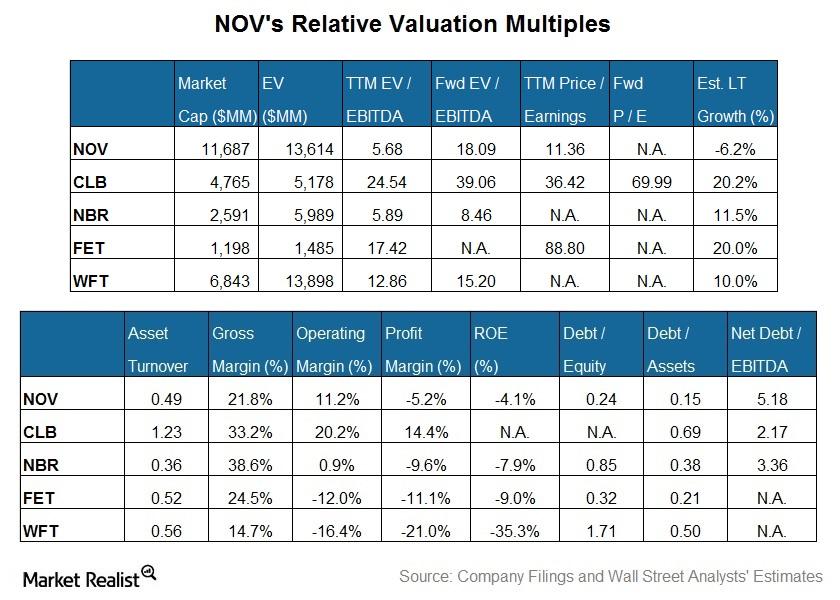
What Is NOV’s Valuation Compared to Its Peers’?
NOV’s enterprise value, when scaled by trailing-12-month adjusted EBITDA, is lower than the peer average.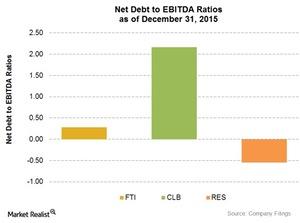
Analyzing the Net-Debt-to-EBITDA Ratios of 4 Major Mid-Cap OFS Companies
In fiscal 2015, RPC’s (RES) net-debt-to-EBITDA ratio stood at -0.54, down from the 0.34 it saw in 2014. The company’s long-term debt stood at zero in 2015.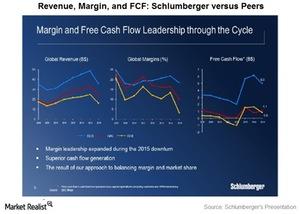
Behind the Scenes with Schlumberger’s Business Model
Despite the weakness in the energy sector, Schlumberger remains a strong OFS company because its business model is diversified.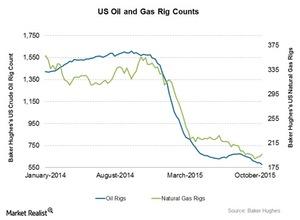
How the Late October Oil Rig Count Dip Hurt the Total US Rig Count
By October 30, 2015, the total US rig count fell by 16 crude oil rigs. The number of crude oil rigs has continued to fall in the past nine weeks.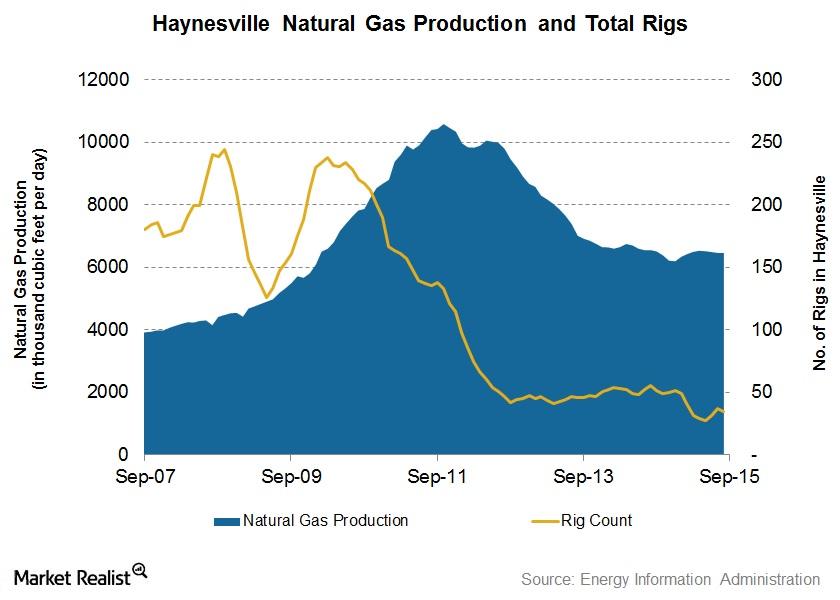
Haynesville Shale Natural Gas Production Fell in September
The Haynesville Shale’s natural gas production in September was 0.1% lower than August. On a YoY basis, it was 1.4% less. The drop marked the fourth straight month-over-month fall in production.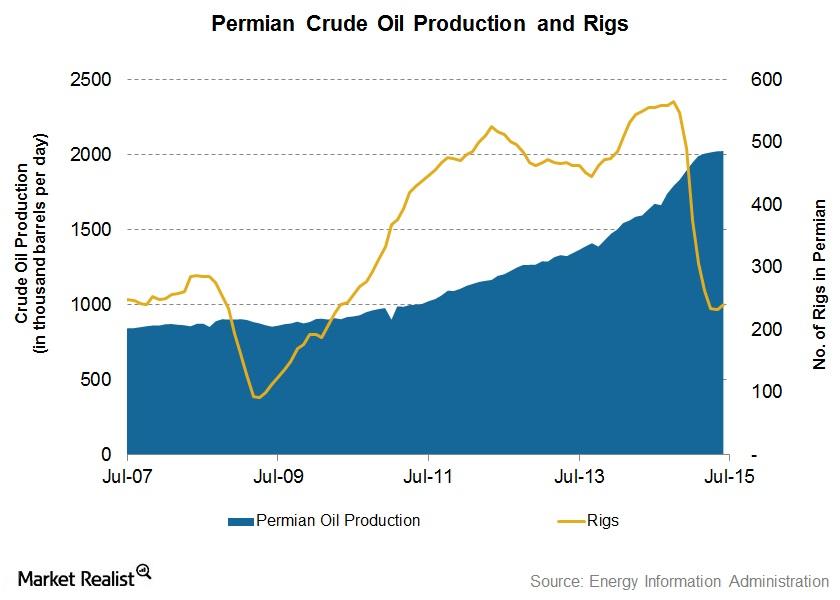
Permian Shale’s July Crude Oil Production Growth Slowest in 2015
The EIA estimates that the Permian Shale’s July crude oil production was ~2.02 MMbpd, only 0.1% higher than June’s production total. However, this is a 24% increase over production in July 2014.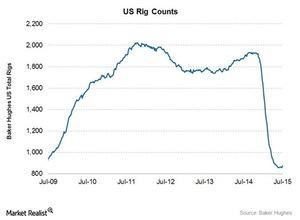
Biggest US Rig Count Rise in a Year: What Does It Change?
Despite recent rises, at 876, the US rig count is still at its lowest level since January 2003. In September 2014, the average rig count came close to the record, reaching 1,931.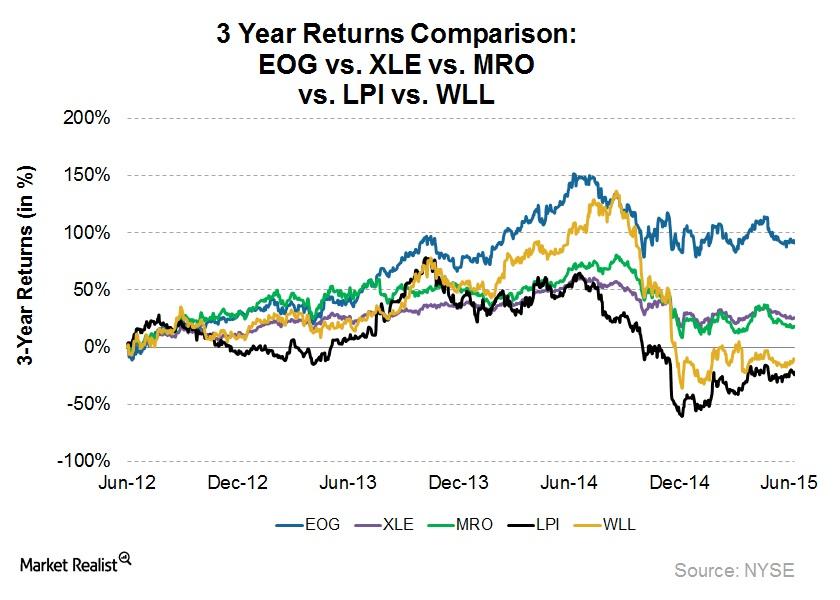
Why EOG Resources Is among the Best Upstream Stocks
EOG Resources (EOG) has generated above-par returns over a three-year period. EOG returned 91.8% in the last three years, mainly due to its strong performance.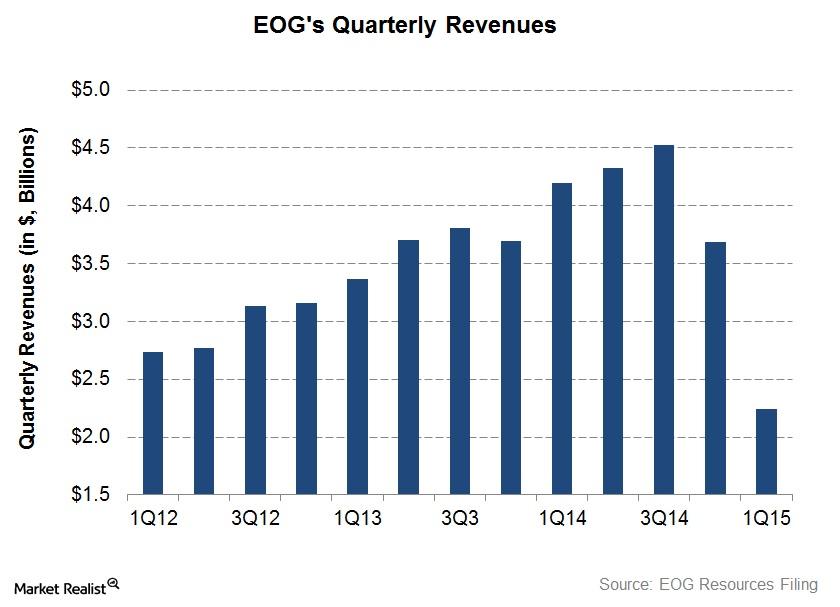
EOG Resources: Growing Revenue Is Battered by the Crude Oil Slump
EOG Resources’ 1Q15 adjusted revenue fell 39% quarter-over-quarter. This was mainly a result of the fall in crude oil and natural gas prices starting in 2H14.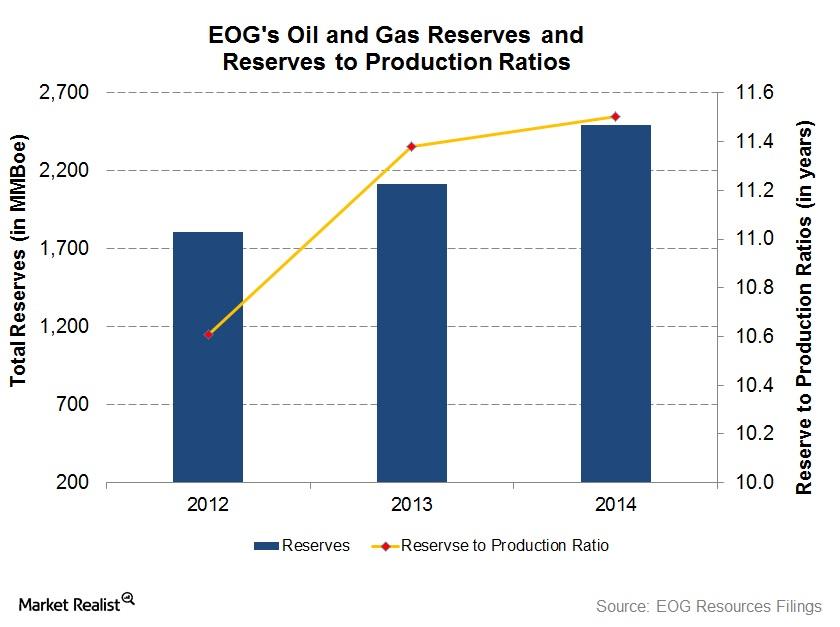
Growth in EOG Reserves Outpaces Production
EOG’s reserves-to-production ratio, or reserve life, increased from 10.6x in 2012 to 11.5x in 2014. It would take EOG 11.5 years to deplete its proved reserves at its 2014 production rate.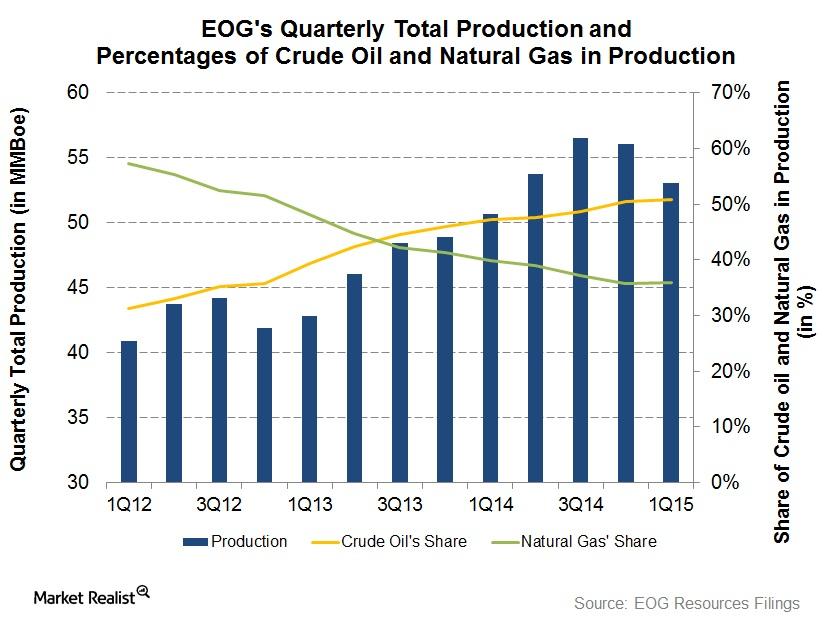
EOG Production Adjusts to Weak Energy Prices
On the heels of weak energy prices, EOG Resources wants to maintain steady production. This may result in flat production growth in 2015.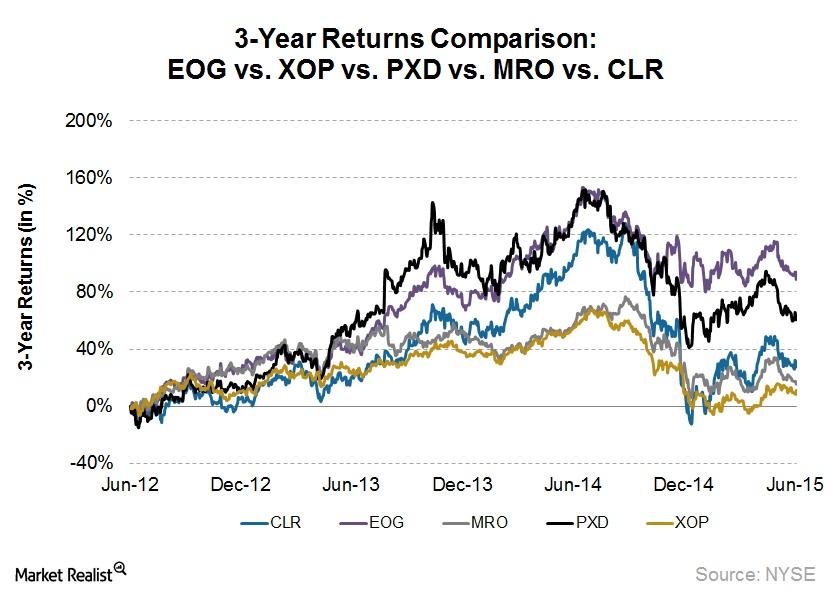
EOG and Pioneer: The Best Upstream Stocks in the Past 3 Years
Of the top American upstream stocks, EOG Resources has been the outperformer since June 2012, returning 93%. During the same period, Pioneer Natural Resources (PXD) returned 61%.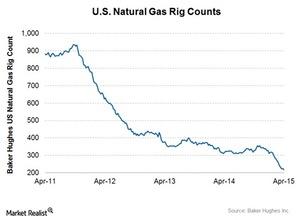
Natural Gas Rig Count Back to Downtrend in Week Ended April 17
There were 217 natural gas rigs operating in the week ended April 17, a loss of eight from the previous week. Natural gas rig count increased by three the previous week.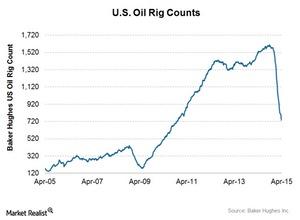
US Crude Oil Rig Count Down for 19 Straight Weeks
US crude oil rig count decreased by 26 for the week ended April 17 down from 760 to 734. The number of oil rigs is now at its lowest level since December 3, 2010.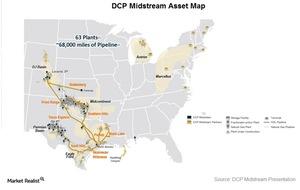
DCP Midstream Partners and Its Three Operating Segments
Unit price for DCP Midstream decreased 24% in the past year. The fall is particularly sharp since the end of October when its unit price crashed 32%.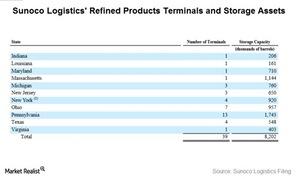
An Overview of Sunoco’s Terminals Facilities
Sunoco’s terminals facilities business operates crude oil, refined products, and natural gas liquids (or NGL) terminals.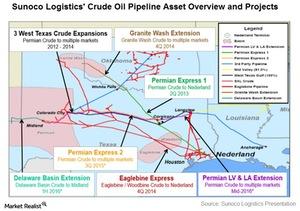
Crude Oil Pipeline Is a Major Segment for Sunoco Logistics
In the crude oil pipeline segment, Sunoco Logistics (SXL) runs 5,800 miles of crude oil pipelines and approximately 500 miles of crude oil gathering lines.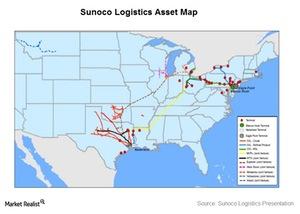
An Overview of Sunoco Logistics Partners
Sunoco Logistics Partners (SXL) is an energy midstream master limited partnership. It operates crude oil, natural gas, refined products, and natural gas liquids pipeline and terminal assets.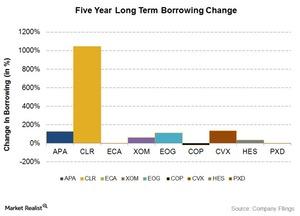
Why are some energy companies more leveraged than others?
In the past five years, many of the upstream and integrated energy companies have increased their debt. Some are more leveraged than others.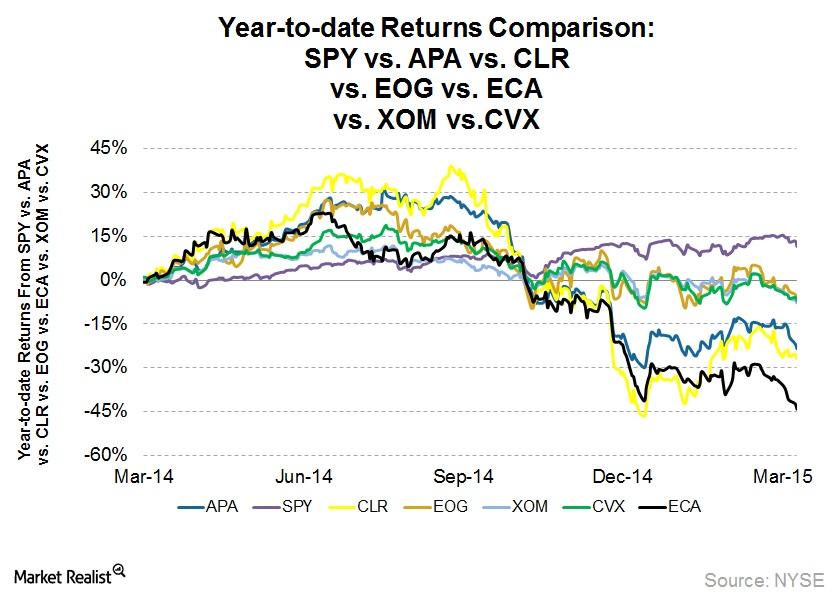
Falling oil prices affect energy upstream and integrated companies
Falling oil prices have started to affect energy upstream companies’ revenues. These companies have resorted to cutting costs and focusing on cash flow.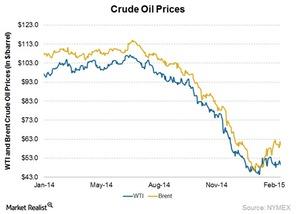
Why have energy companies increased their debt?
In 2010, US upstream energy companies aggregated $128 billion of total debt. As of 4Q14, this increased to $199 billion of combined debt, a jump of 55%.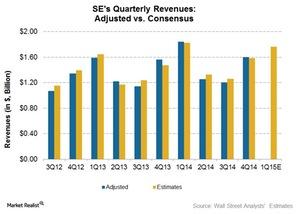
Spectra Energy 4Q14 earnings beat estimates
Spectra Energy 4Q14 adjusted earnings beat estimates by 46%. On average, adjusted EPS has exceeded consensus EPS by ~9% in the past ten quarters.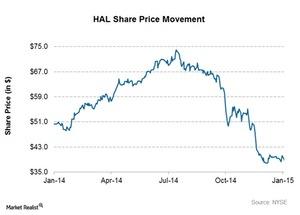
Must-know: An overview of Halliburton
Halliburton (HAL) is a Texas-based energy company. It’s an oil and gas equipment and service provider. In the past year, Halliburton’s stock price went down ~22%.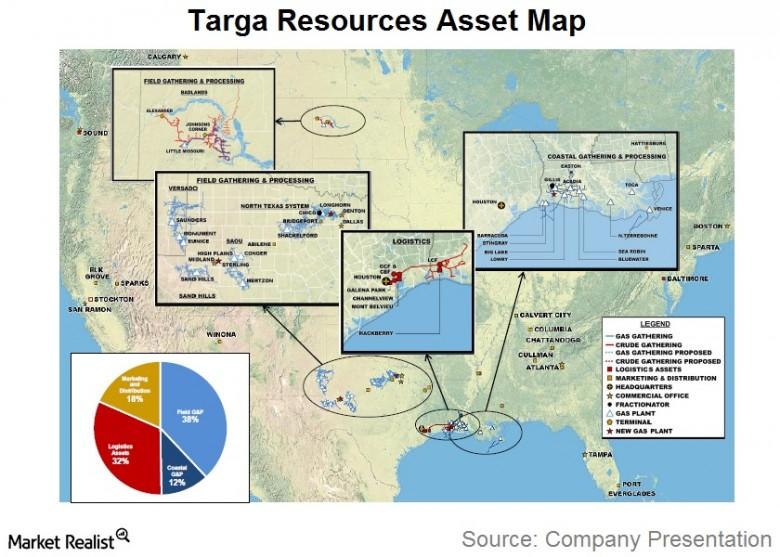
Must-know business overview: Targa Resources Partners
Targa Resources Partners LP (NGLS) is a master limited partnership operating in the midstream energy space. Targa Resources Corp. (TRGP) is the general partner of NGLS.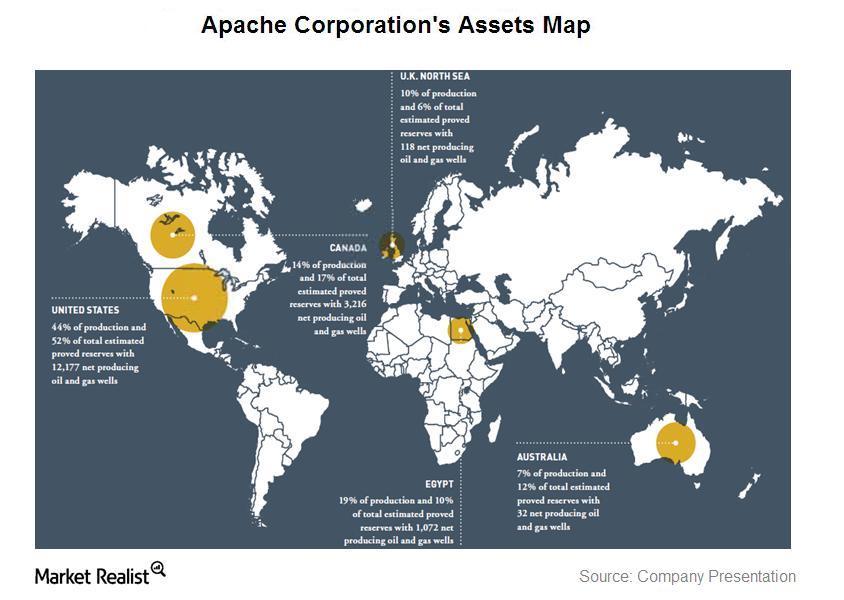
An overview of Apache Corporation’s oil and gas asset sales
Apache Corporation is planning asset sales of certain of its oil and gas operations. The company is focused on building onshore acreage instead.
An overview of ExxonMobil
Exxon Mobil’s (XOM) stock price went up 2.4%, to $96.71, on October 31, 2014. Starting in November 2013, Exxon Mobil’s share price went up by 1.5%.Consumer BP lost 55% shareholder value after the Deepwater Horizon incident
Deepwater Horizon was a deepwater, offshore oil drilling rig owned by Transocean (RIG) and operated by BP Plc. (BP). On April 20, 2010, while drilling at the Macondo Prospect, there was an explosion on the rig caused by a blowout that killed 11 crew members.Energy & Utilities Overview: Clean Energy Fuels Corp’s operations and financials
As of December 31, 2013, CLNE served ~779 fleet customers operating ~35,240 natural gas vehicles—it also owns and operates 471 natural gas fueling stations.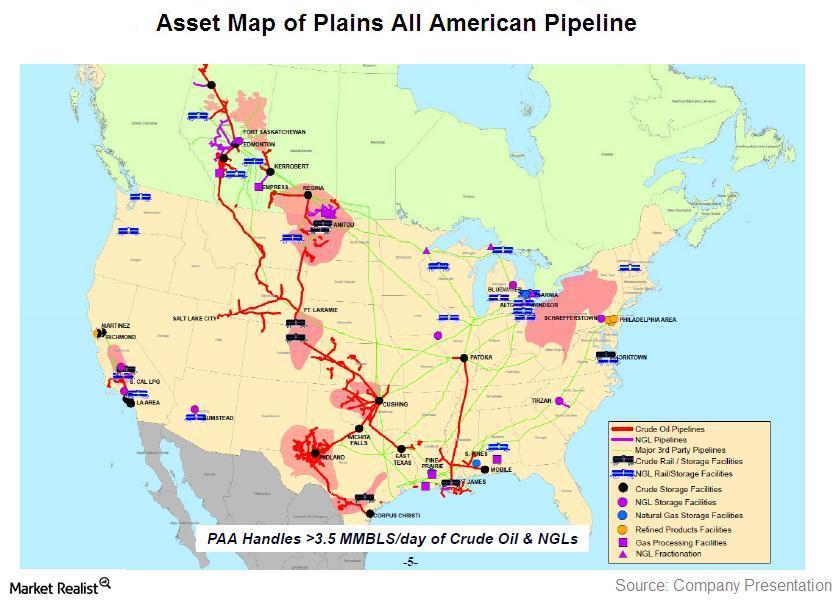
Must-know: An introduction to Plains All American Pipeline
Plains All American Pipeline L.P. (PAA) is a master limited partnership that operates in the midstream energy business.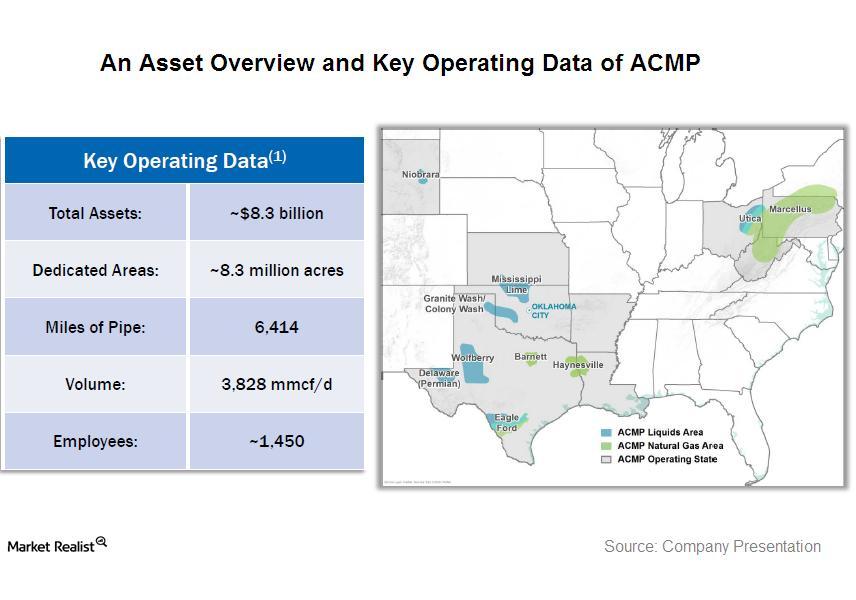
An introduction to Access Midstream Partners’ business and assets
Access Midstream Partners is a master limited partnership, which owns, operates, develops and acquires natural gas, NGLs, and oil gathering systems and other midstream energy assets.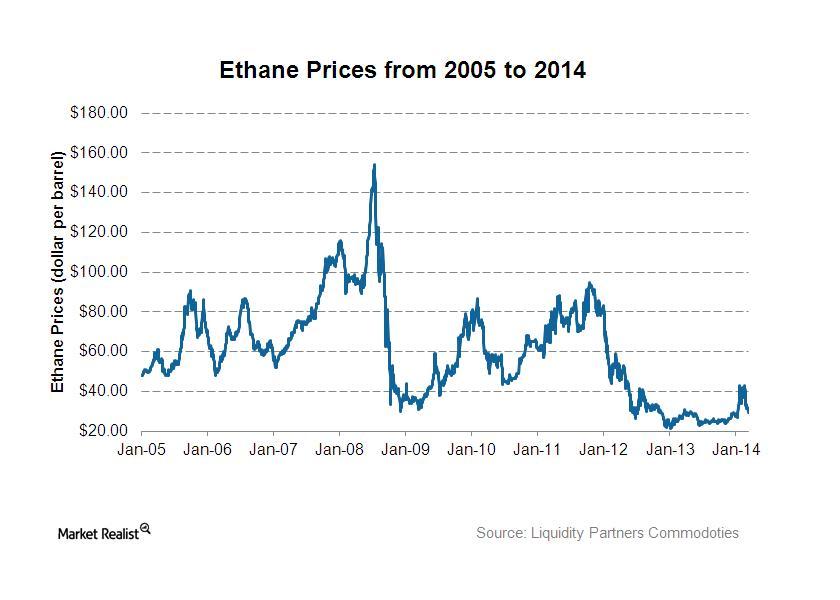
Ethane production and its effects on natural gas processors
With attractive NGL pricing relative to naphtha refinery streams, the feedstock percentage of NGLs has been increasing, with ethane taking a disproportionate share of the total.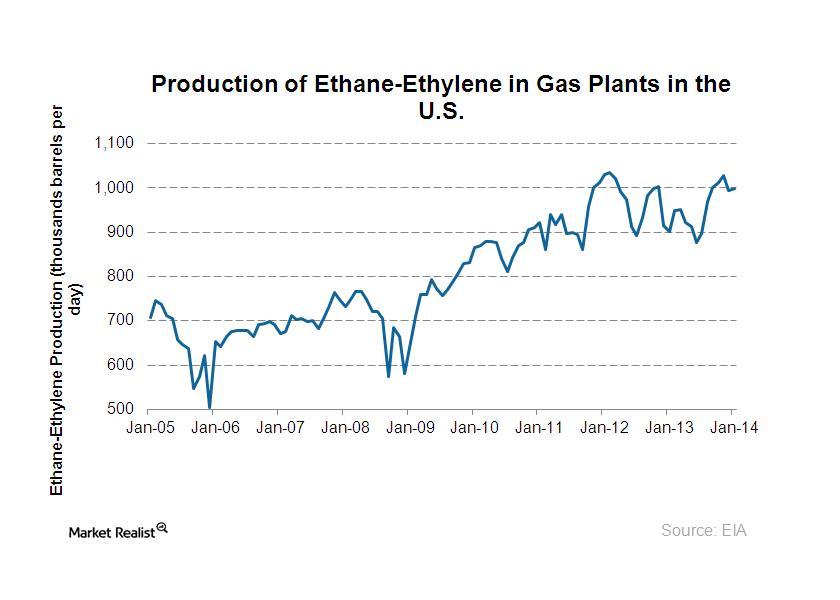
Why ethane production has increased a lot over the past few years
Ethane is the largest component of the natural gas liquids stream, and the increased wet gas production caused a large increase in ethane production.
Comparing ETFs and closed-end MLP funds: An investor’s guide
CEFs are an alternate way to gain MLP exposure besides ETFs. Popular ETFs include Alerian MLP ETF (AMLP), Yorkville High Income MLP ETF (YMLP), and MLP ETF (MLPA).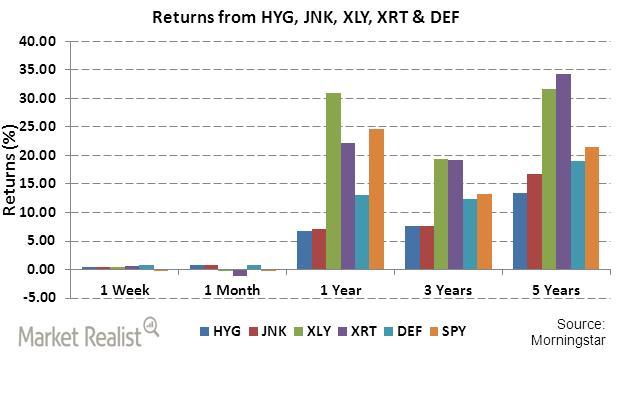
An investor’s guide to cyclical and counter-cyclical industries
XLY and XRT have performed better in terms of absolute returns over longer periods of three and five years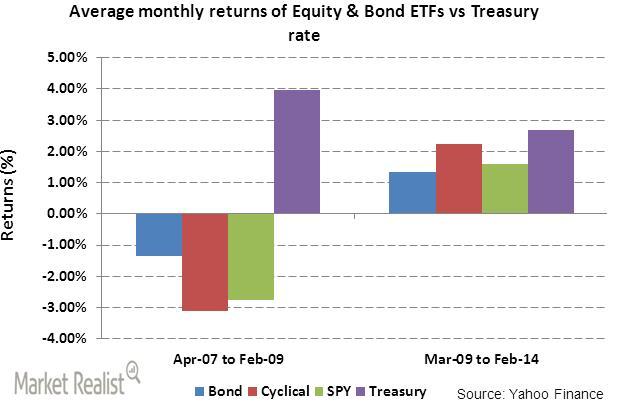
High yield bond ETFs’ performance compared to cyclical industry ETFs
During economic uncertainty, investors want steady, guaranteed returns from the Treasury instead of quick returns from price movements in equity ETFs.