
Alex Chamberlin
Disclosure: I am in full compliance with all ethics and other policies for Market Realist research analysts. I am not invested in securities that I cover on Market Realist.
More From Alex Chamberlin
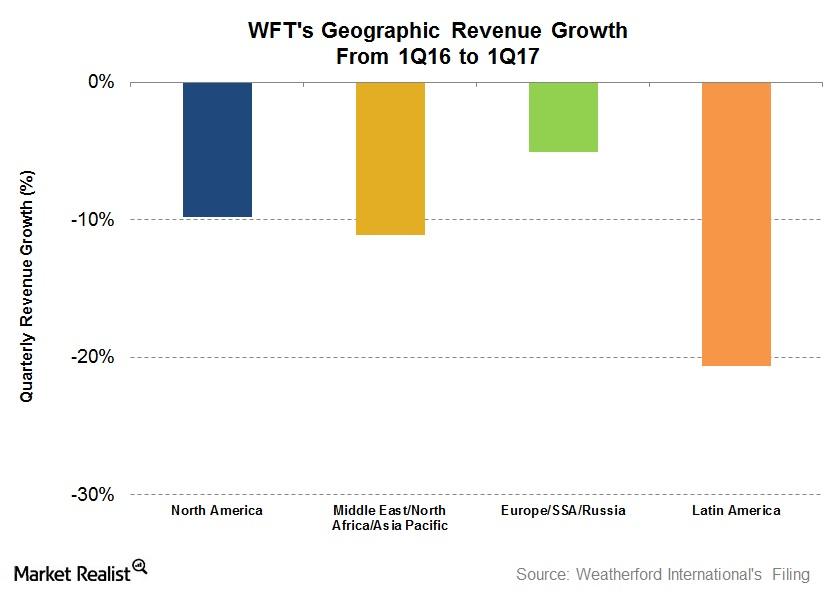
What Impacted Weatherford’s 1Q17 Performance?
Weatherford’s North America region’s 1Q17 operating loss improved to $18 million—compared its operating loss of $128 million last year.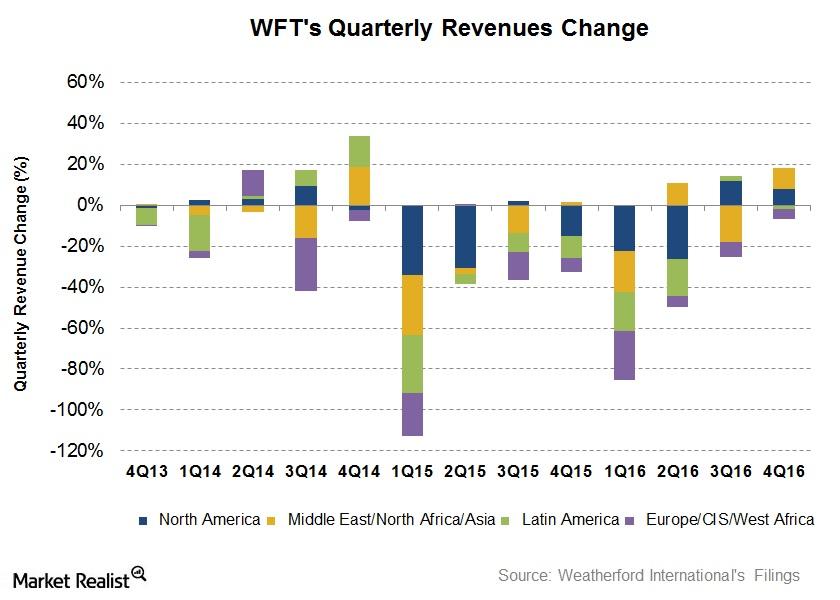
Analyzing Weatherford International’s Growth Drivers in 4Q16
Revenues from Weatherford International’s (WFT) Europe/Sub Saharan Africa/Russia region fell the most with a 36.5% fall from 4Q15 to 4Q16.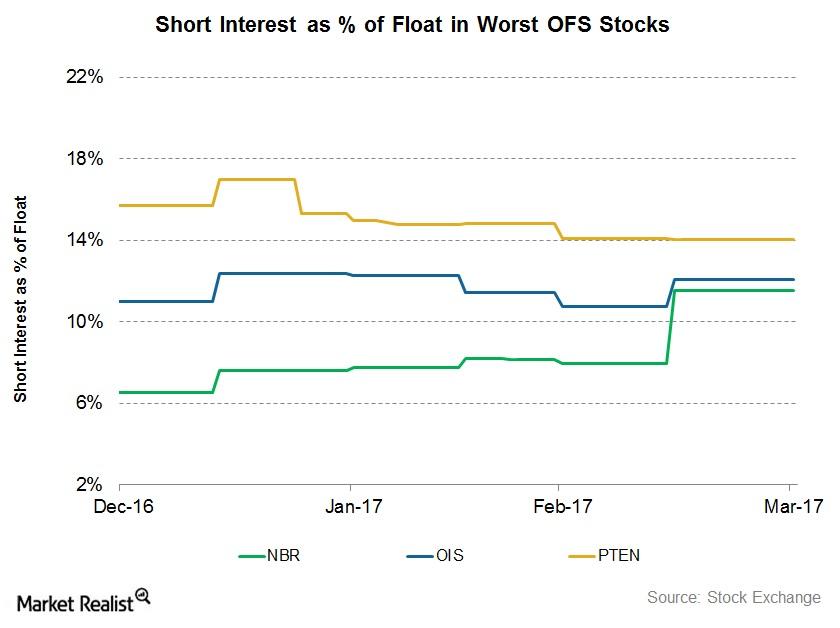
Short Interest: OFS Stocks with the Lowest Returns in 1Q17
Short interest in Nabors Industries (NBR), as a percentage of its float, rose to 11.5% as of March 31, 2017—compared to 6.5% as of December 30, 2016.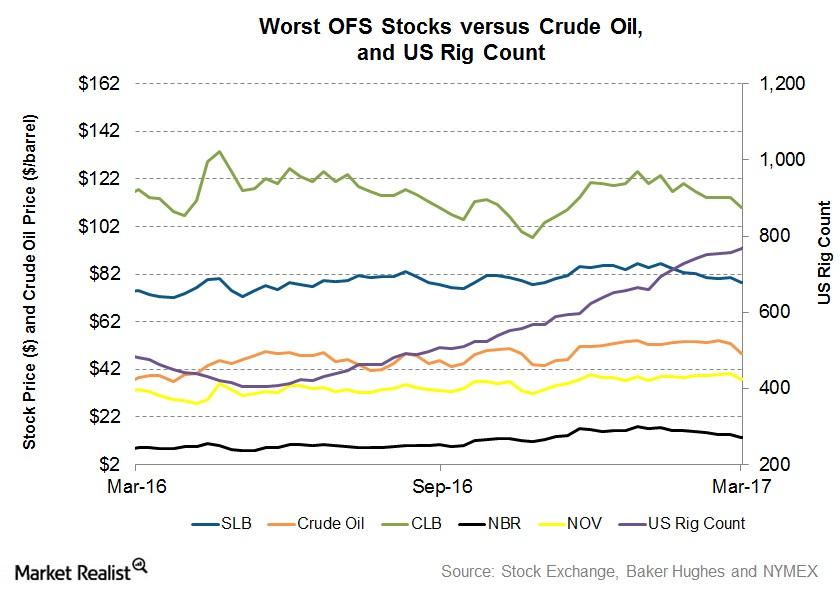
Worst Oilfield Services Stocks in the Industry
In this part of the series, we’ll look at the worst OFS stocks by expected earnings growth in 1Q17.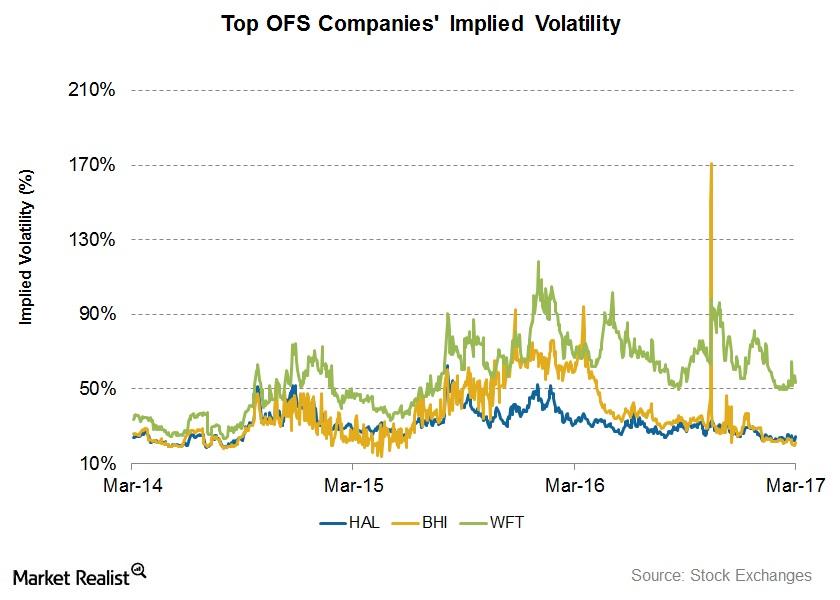
How Volatile Are the Top Oilfield Services Companies?
In this part of the series, we’ll compare the implied volatilities of the top OFS companies as rated by Wall Street analysts for 1Q17.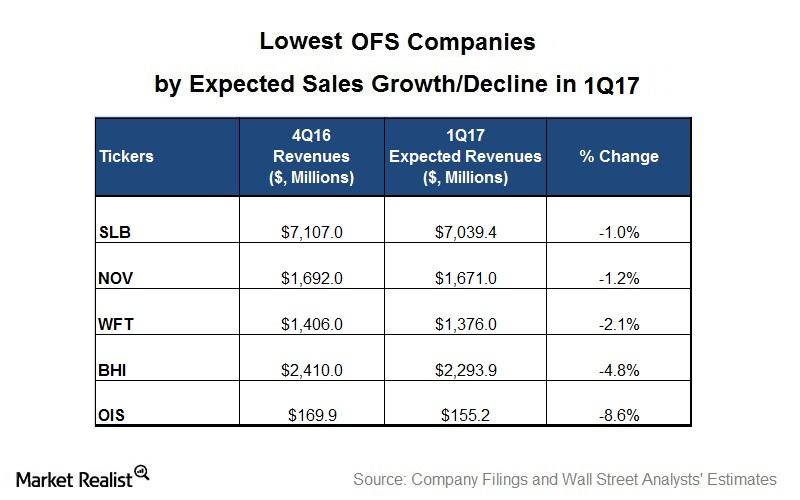
Worst Oilfield Services Stocks for 1Q17 by Revenue Growth
Weatherford International (WFT) is expected to witness a 2.1% fall in revenue in 1Q17 compared to 4Q16.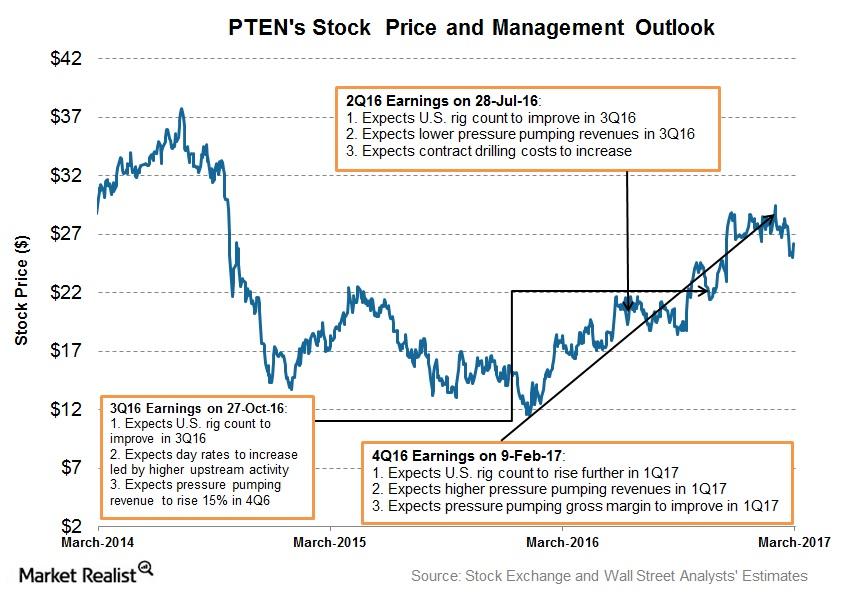
Patterson-UTI Energy’s Forecasts for 2017
Patterson-UTI Energy’s (PTEN) operated average US rig count is expected to rise 21.0% in 1Q17 compared to 4Q16.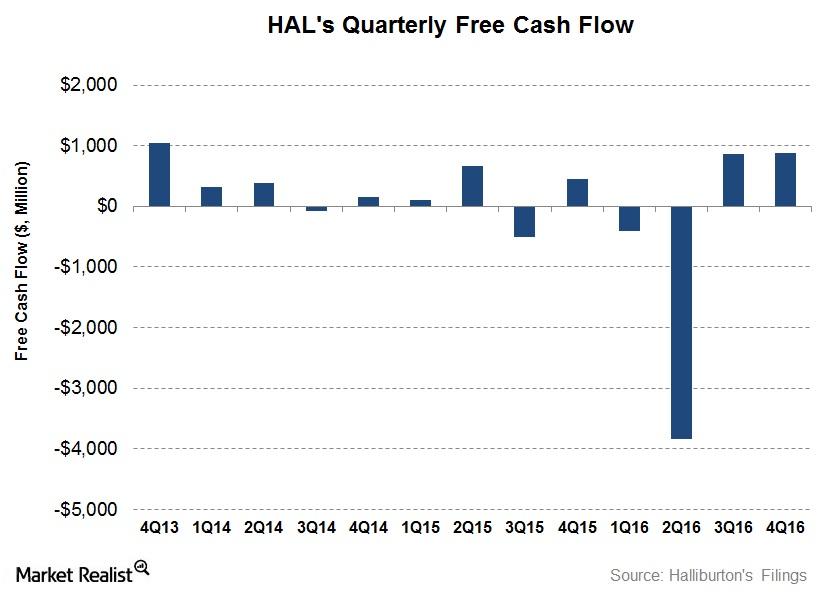
Analyzing Halliburton’s Free Cash Flow and Capex Plan
In this article, we’ll analyze how Halliburton’s (HAL) operating cash flows have trended over the past few quarters. We’ll also discuss its free cash flow (or FCF).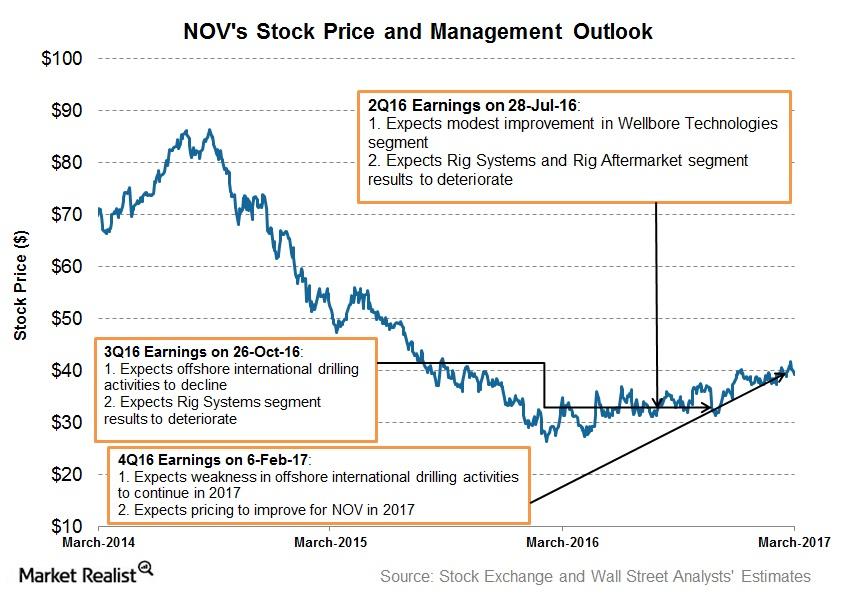
National Oilwell Varco’s Growth Prospects in 2017
National Oilwell Varco’s (NOV) management expects upstream activity in North America’s shale plays to improve in 2017.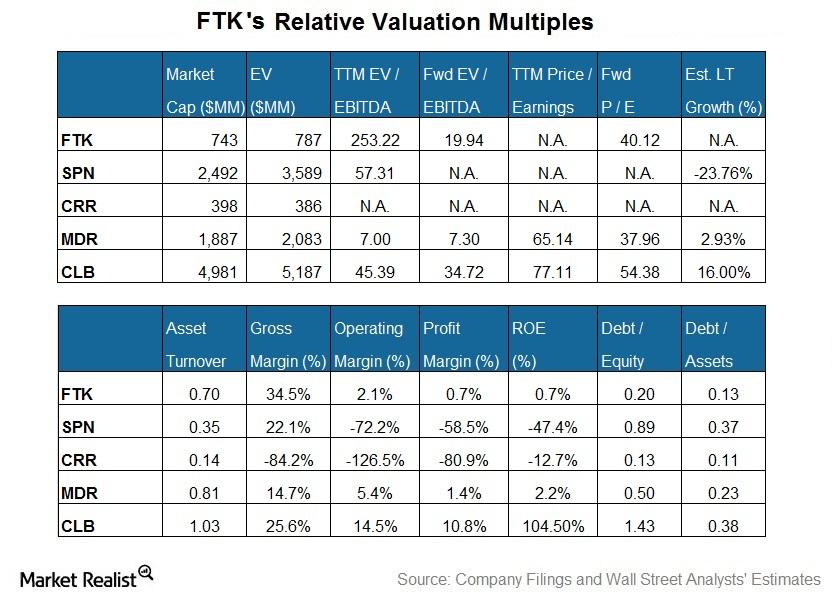
How Flotek Industries Is Valued versus Peer Stocks
Core Laboratories (CLB) is the largest company by market capitalization among our set of select oilfield services and equipment (or OFS) companies…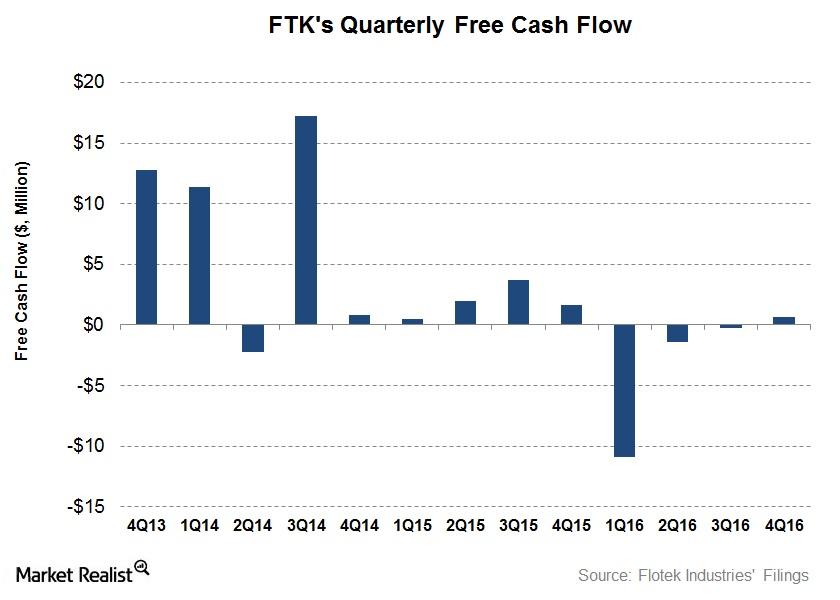
Flotek Industries’ Capex: Impact of a Credit Facility Agreement
In this article, we’ll analyze how Flotek Industries’ (FTK) operating cash flows trended over the past few quarters.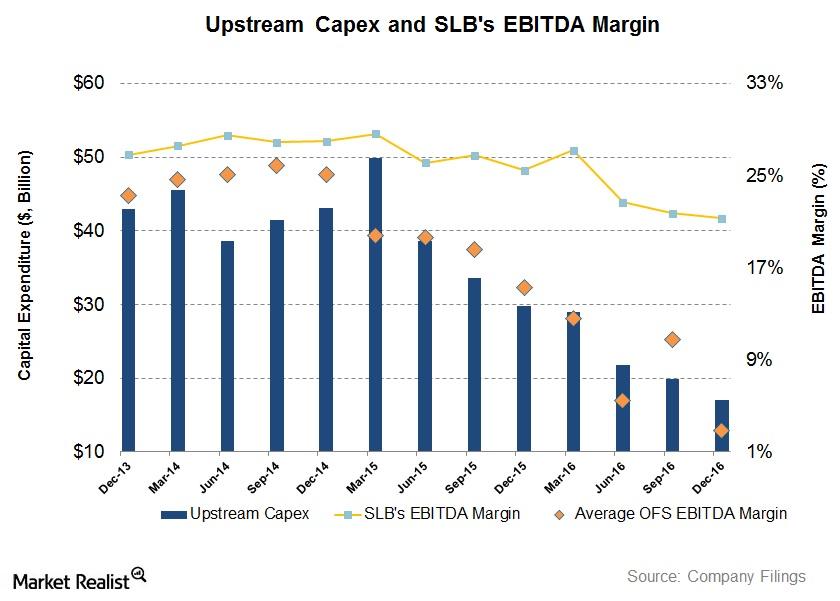
Will Upstream Operators’ Capexes Affect SLB’s 1Q17 Margin?
In the past couple of years, some major US upstream and integrated companies have reduced their capital expenditures (capex) following crude oil’s sharp fall.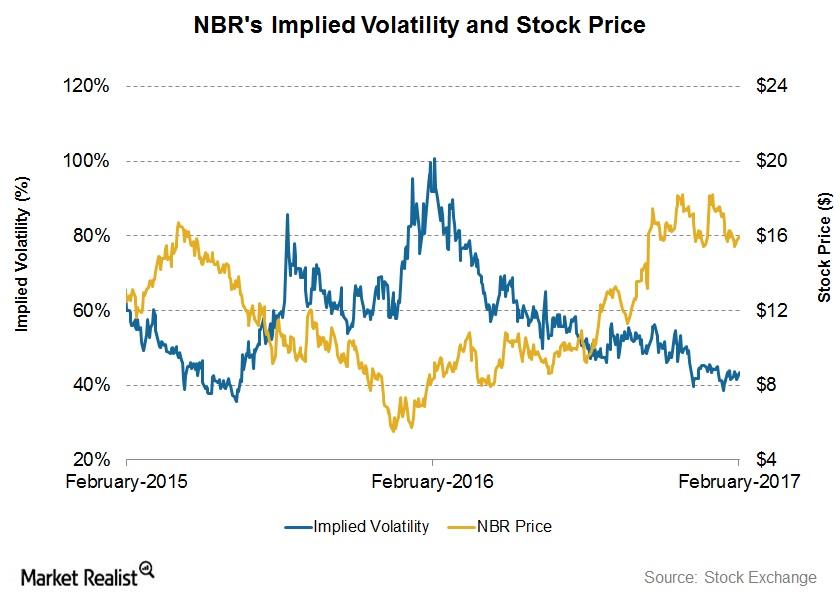
What Nabors Industries’ Implied Volatility Suggests
On February 13, 2017, Nabors Industries (NBR) had an implied volatility of 43%.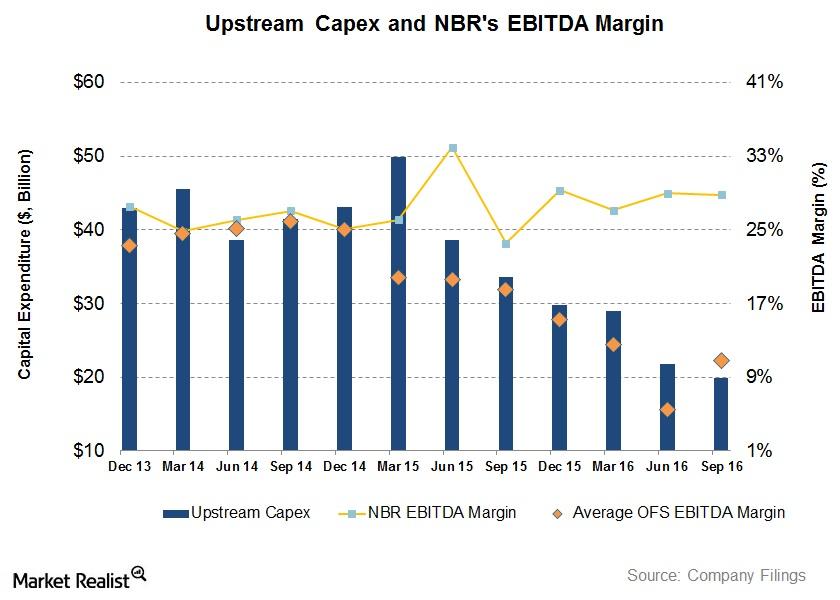
Will Upstream Operators’ Capex Affect Nabors’ 4Q16 Margin?
In the past couple of years, some of the major US upstream and integrated companies have reduced capital expenditure following crude oil prices’ sharp decline.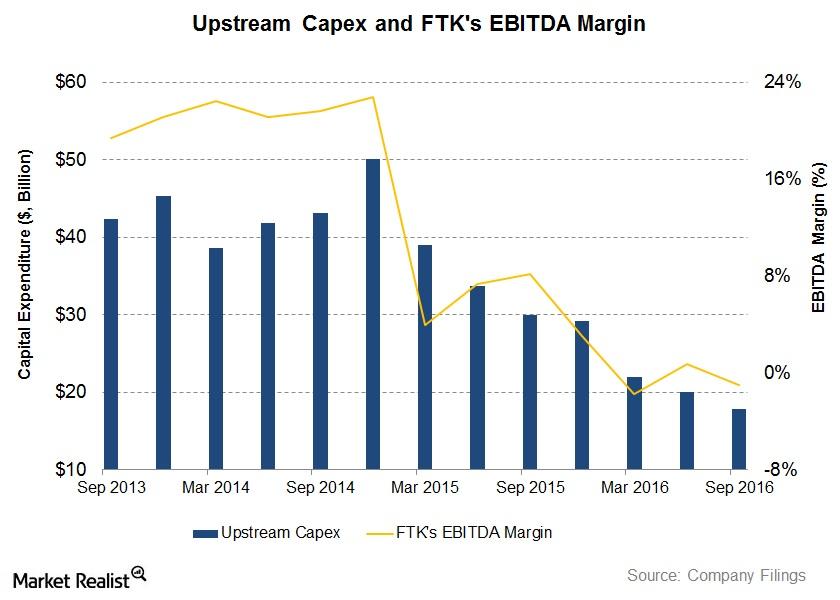
Will Upstream Operators’ Capex Affect Flotek’s 4Q16 Margin?
In the past couple of years, some of the major US upstream and integrated companies have reduced capital expenditure as a result of crude oil’s sharp decline.
How Have Superior Energy’s Recommendations Changed before the 4Q16 Earnings?
On January 6, 2017, ~70% of the analysts tracking SPN recommended a “buy” or some equivalent for the stock, while ~30% of the analysts issued a “hold.”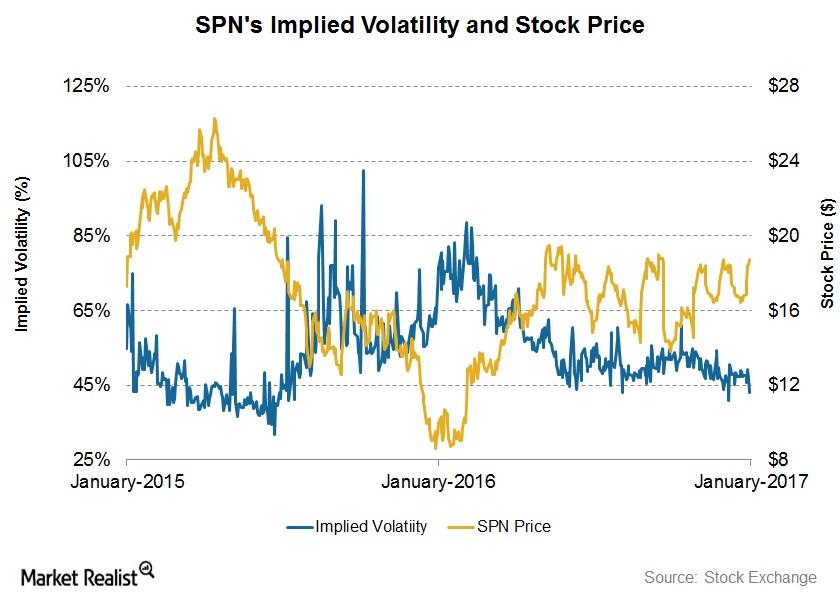
How Volatile Is Superior Energy Services in 1Q17?
On January 6, SPN had an implied volatility of ~43%. Since SPN’s 3Q16 financial results on October 24, 2016, its implied volatility has fallen from 54%.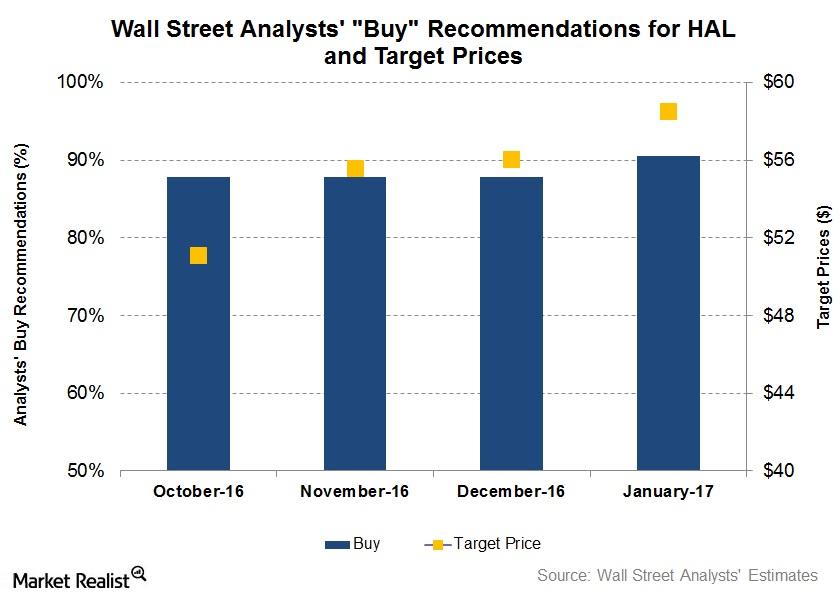
Wall Street’s Forecasts for Halliburton before Its 4Q16 Earnings
On January 3, 2017, 90% of the analysts tracking Halliburton (HAL) rated it a “buy” or some equivalent.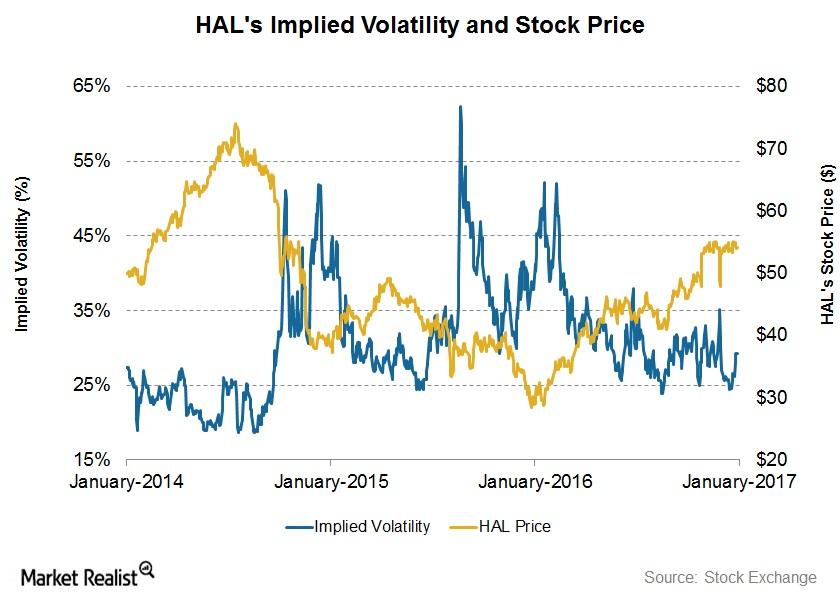
What Does Halliburton’s Implied Volatility Indicate?
On January 3, 2017, Halliburton (HAL) had implied volatility of ~29%. Since HAL’s 3Q16 financial results were announced on October 19, 2016, its implied volatility has remained nearly unchanged.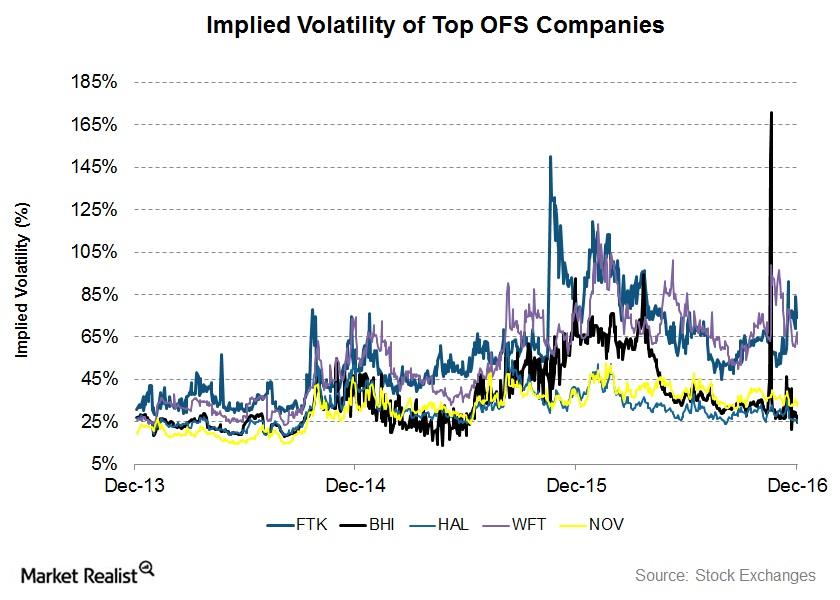
Top Oilfield Service Stocks: Analyzing Implied Volatility
In this article, we’ll compare implied volatility fr the top oilfield services (or OFS) companies, as rated by Wall Street analysts, for 4Q16.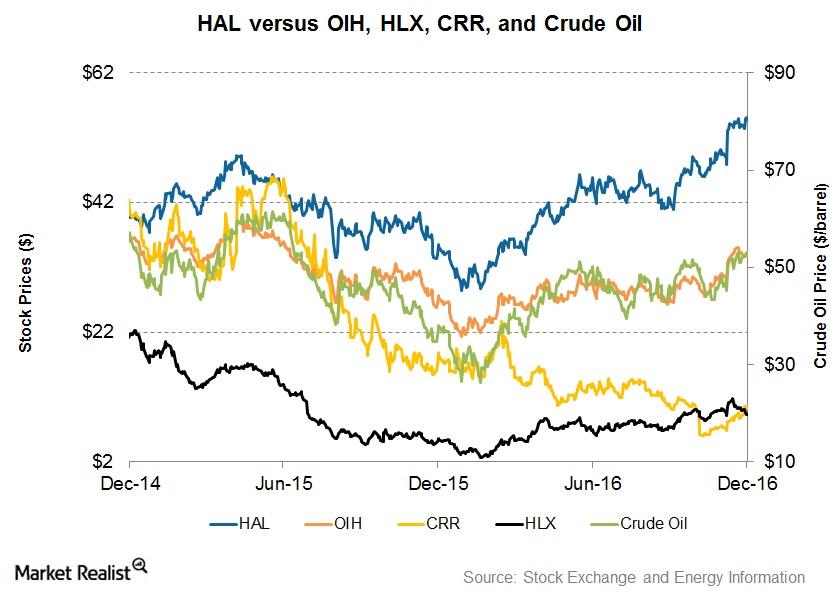
Analyzing Halliburton’s Stock Price Returns
From December 2014 to December 2016, Halliburton’s (HAL) stock price reached the highest level in December 2016. It troughed at ~$28 in January 2016.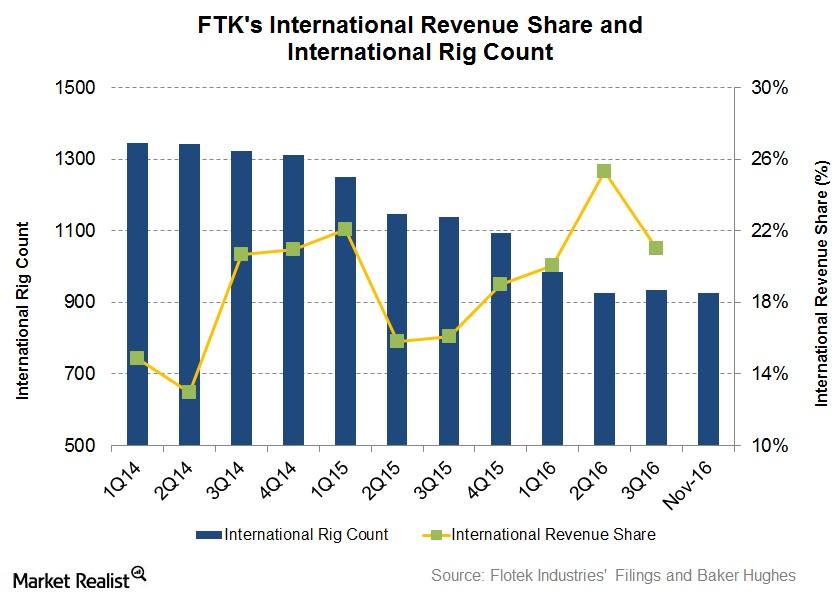
How the Rig Count Affects Flotek’s International Revenue
Flotek Industries’ international revenue In the past year, Flotek Industries’ (FTK) revenue share generated outside the United States has gained. FTK’s international revenue rose to make up 21% of its total revenue in 3Q16, compared with 16% in 3Q15. In comparison, Schlumberger’s (SLB) revenue from international operations, by the end of 3Q16, rose to ~76% […]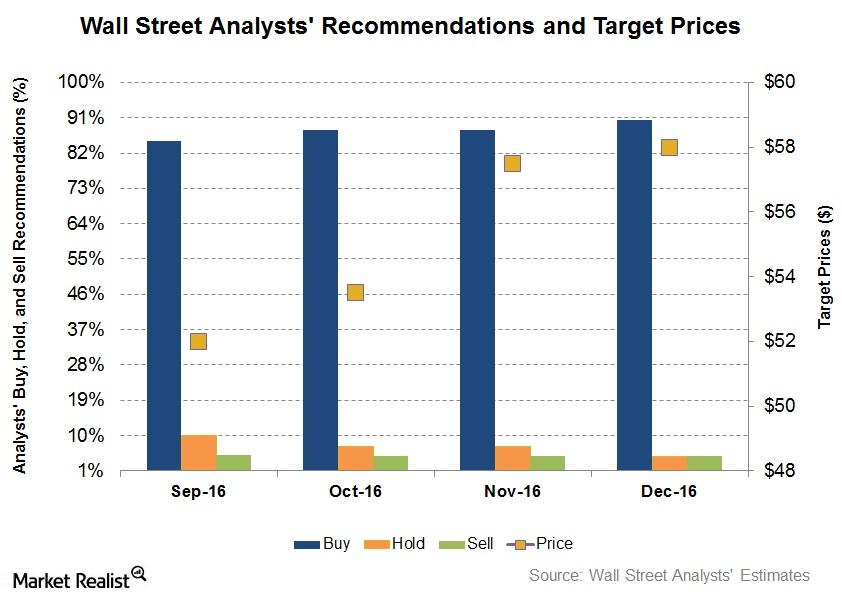
Are Analysts Changing Recommendations for Halliburton?
In December so far, 90% of the analysts tracking Halliburton rated it a “buy” or some equivalent.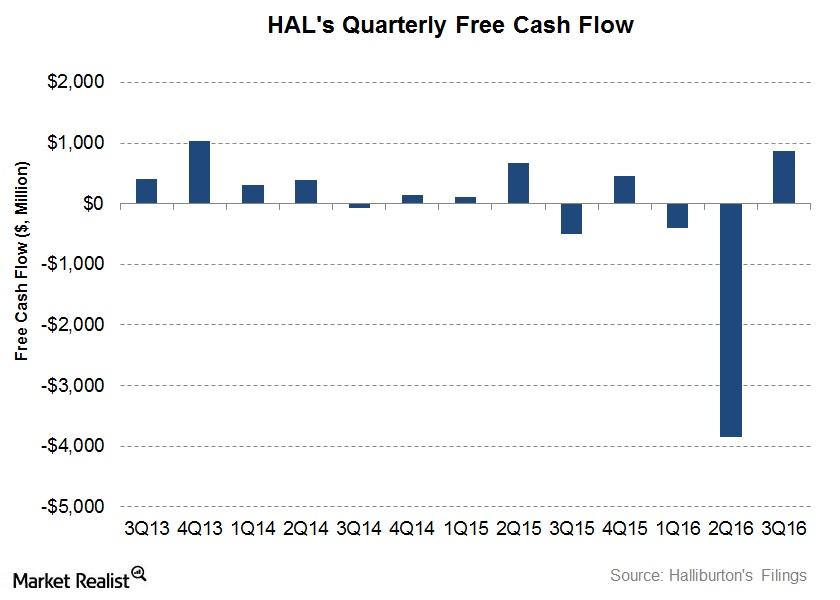
Why Did Halliburton’s Free Cash Flow Improve?
Halliburton’s cash from operating activities (or CFO) turned positive in 3Q16.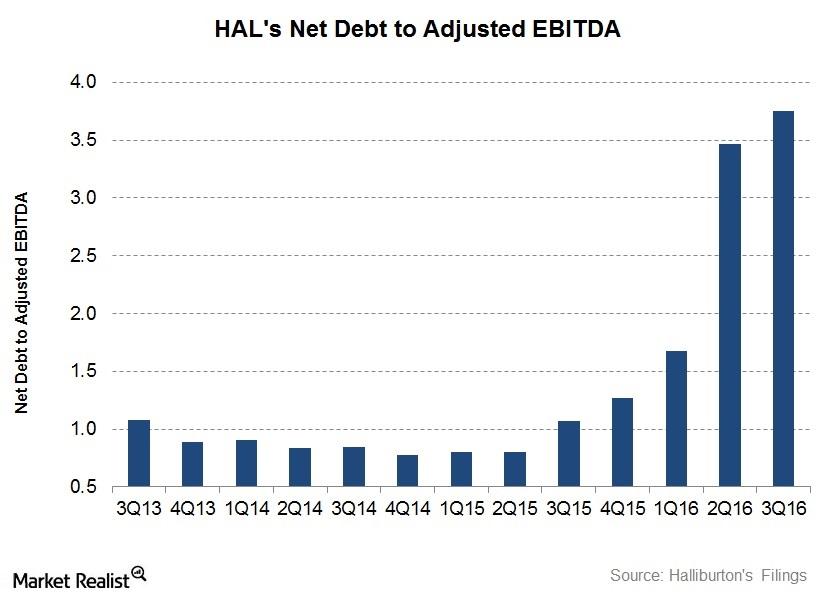
Is Halliburton’s Indebtedness on the Rise?
In 3Q16, Halliburton’s net-debt-to-adjusted-EBITDA multiple was ~3.8x, or 251% higher than it was a year ago.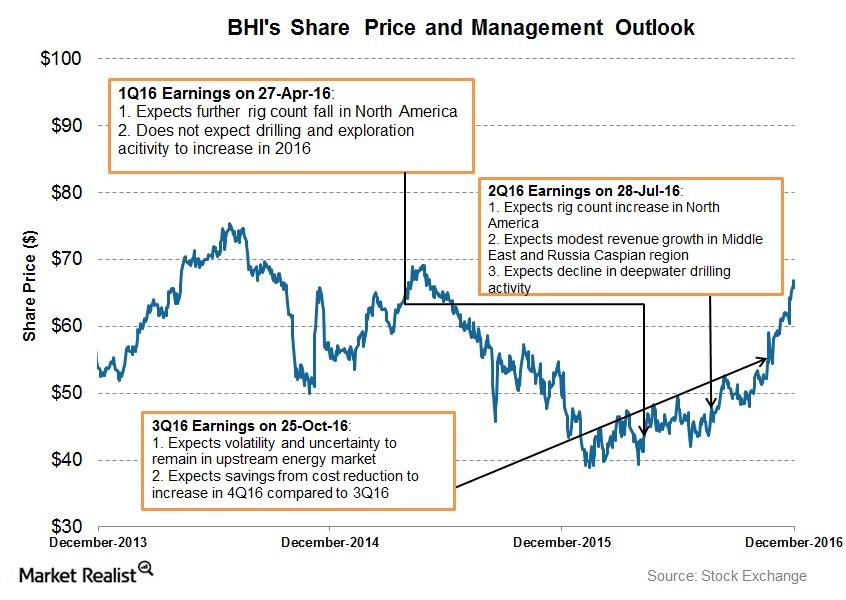
How Does Baker Hughes’s Management View 4Q16?
In 4Q16, Baker Hughes’s (BHI) management expects a trade-off between strong North American upstream activity and a weaker international energy environment.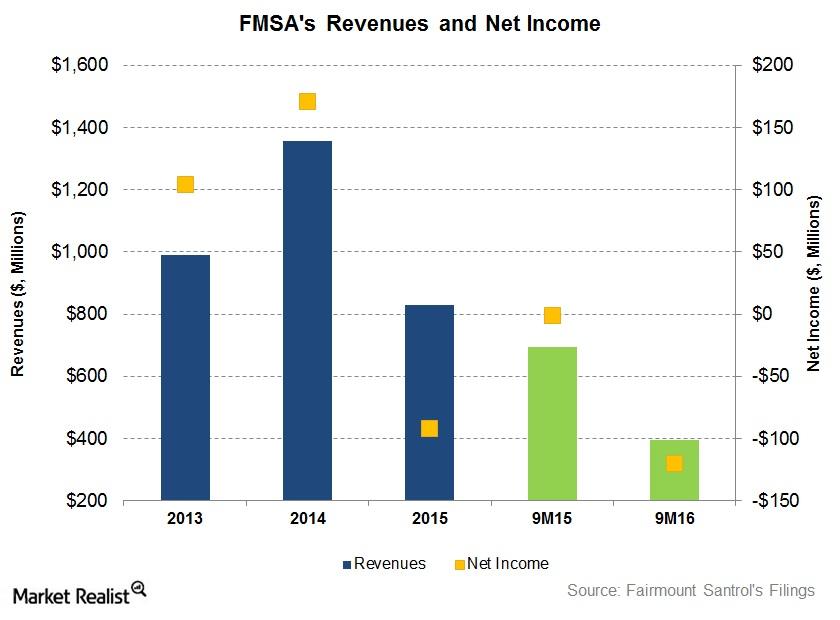
Are Fairmount Santrol’s Fundamentals on a Recovery Path?
During the first nine months of 2016, Fairmount Santrol Holdings’ (FMSA) revenue fell 43% compared to the same period in 2015.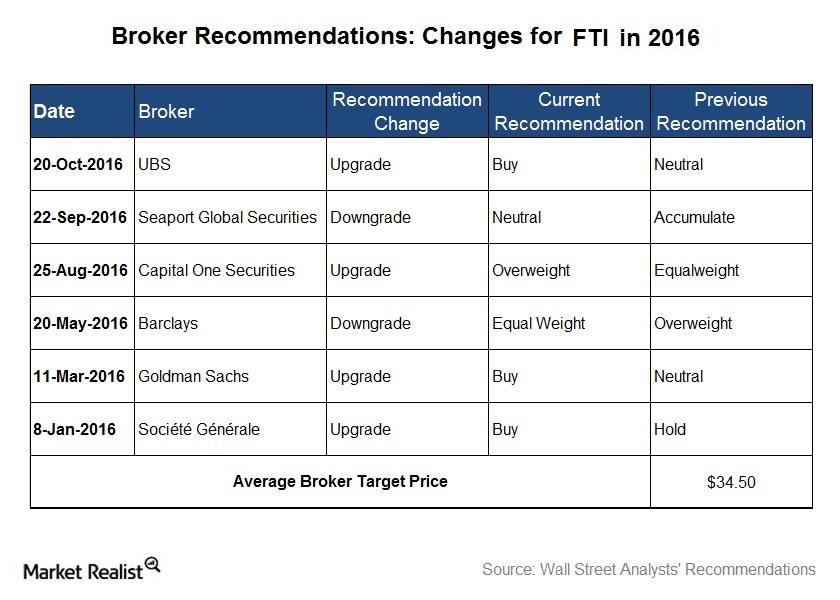
What Do Analysts Recommend for FMC Technologies?
In November, 34% of the analysts tracking FMC Technologies rated it a “buy,” ~55% rated it a “hold,” and only 3% of the analysts rated it a “sell.”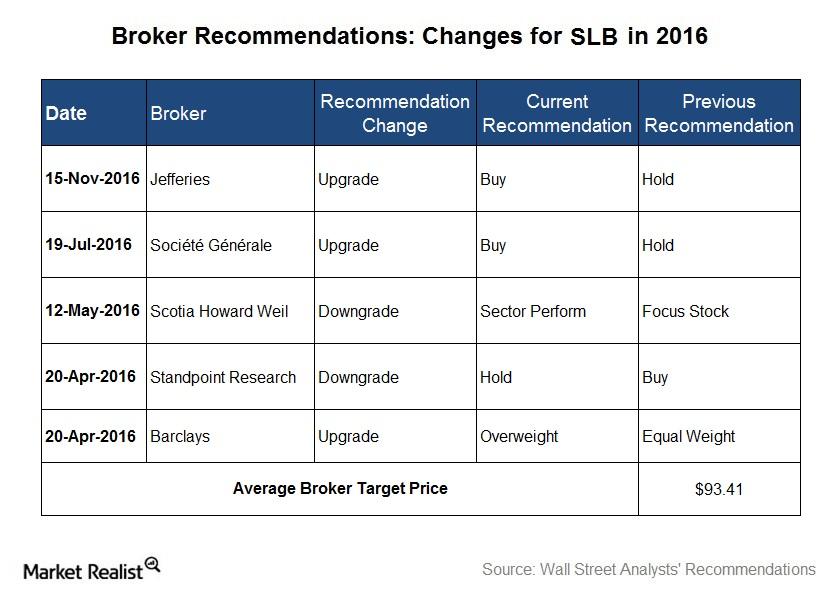
Wall Street Analysts’ Recommendations for Schlumberger
In November, 83% of the analysts tracking Schlumberger rated it a “buy” or some equivalent. The other 18% of the analysts recommended a “hold” or a “sell.”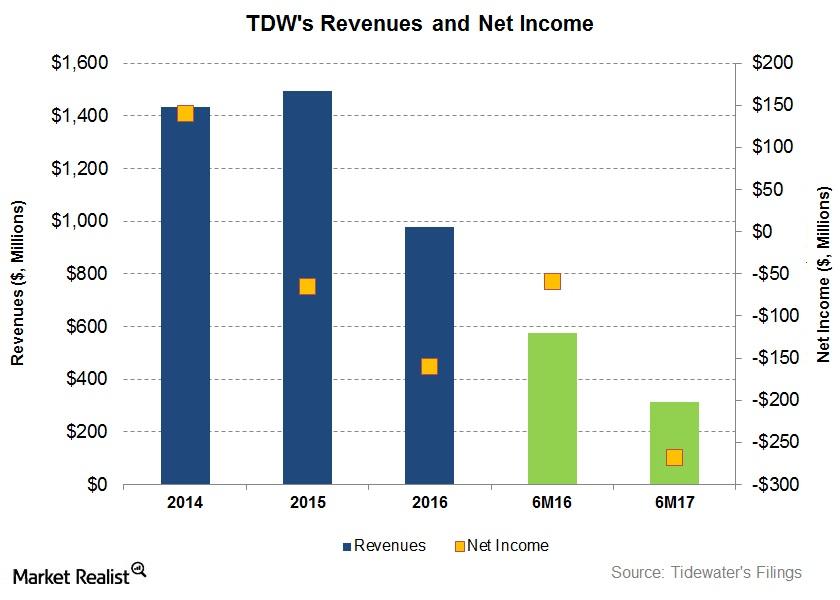
How Have Tidewater’s Fundamentals Fared?
Tidewater’s net loss fell to $267.5 million in the first six months of 2017—compared to an ~$59 million net loss in the first six months of 2016.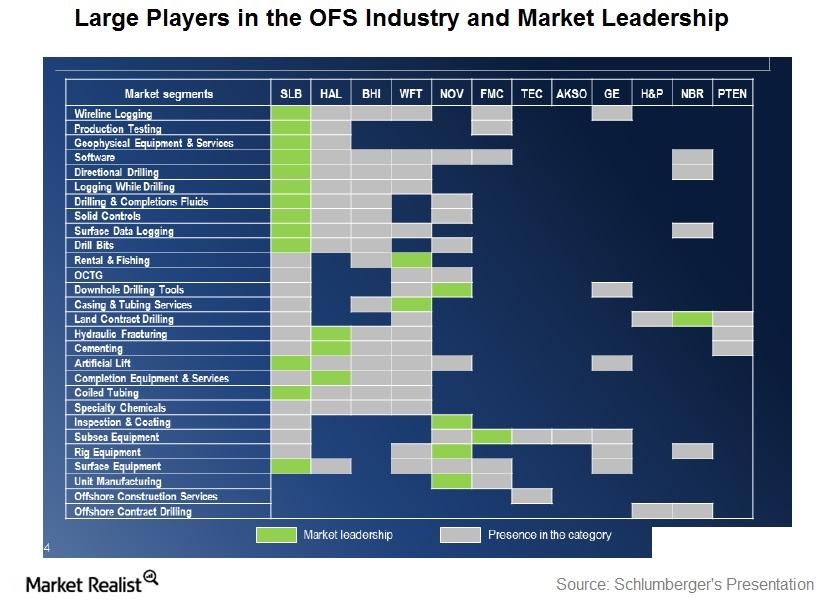
The Oilfield Services Industry: A Brief Introduction
The oilfield equipment and services industry refers to all products and services associated with the oil and gas exploration and production process, or the upstream energy industry.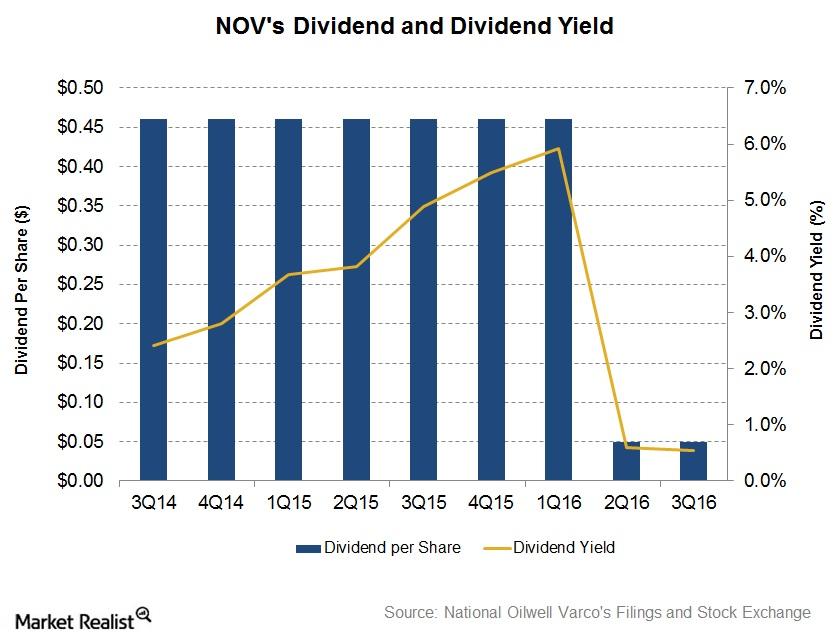
Analyzing National Oilwell Varco’s Dividend
On August 18, National Oilwell Varco (NOV) approved to pay a quarterly dividend of $0.05 per share to shareholders on September 30.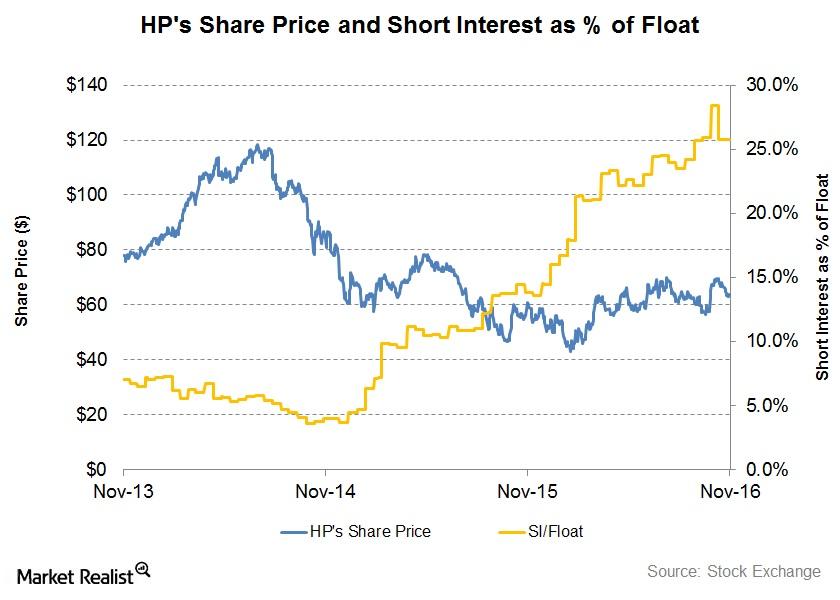
Has Helmerich & Payne’s Short Interest Decreased since Fiscal 3Q16?
Helmerich & Payne’s (HP) short interest as a percentage of its float was 25.7% on November 2, compared to 24.5% on June 30. Since the end of fiscal 3Q16, HP’s short interest has increased 5%.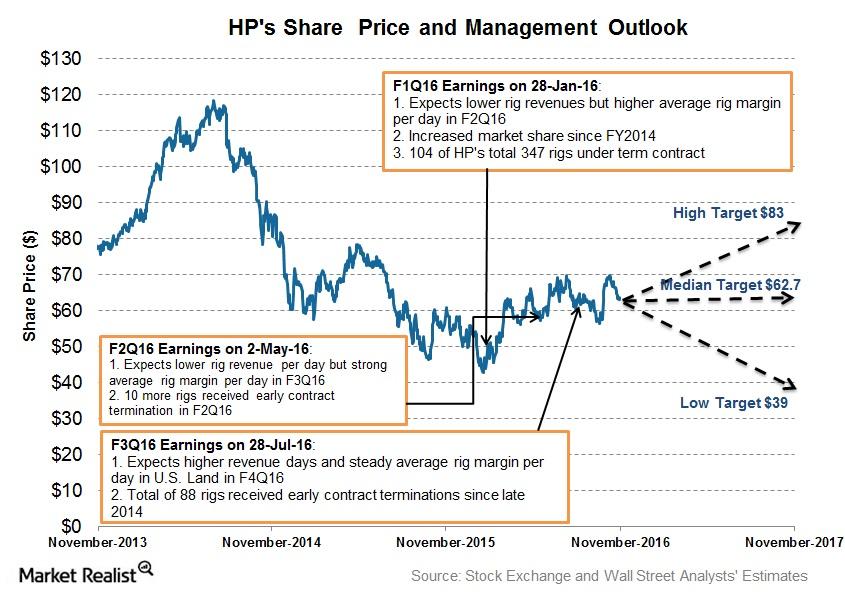
What Are Helmerich & Payne’s Management Estimates for Fiscal 4Q16?
In the US Land segment, Helmerich & Payne (HP) expects revenue days to see a 3% increase to 7% during fiscal 4Q16 compared to fiscal 3Q16.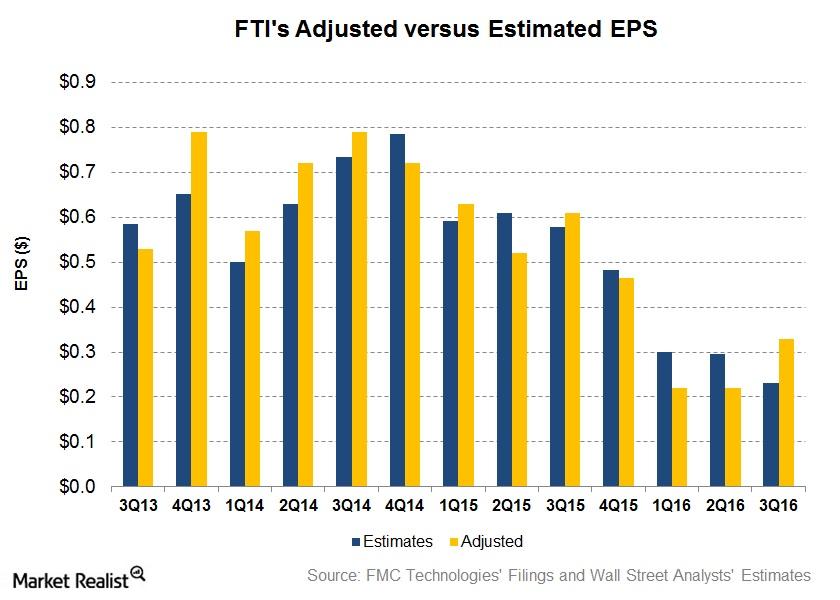
Why Did FMC Technologies’ 3Q16 Earnings Beat Estimates?
The 3Q16 adjusted net EPS (earnings per share) for FMC Technologies is $0.33. This exceeded sell-side analysts’ EPS estimates significantly by 43.0%.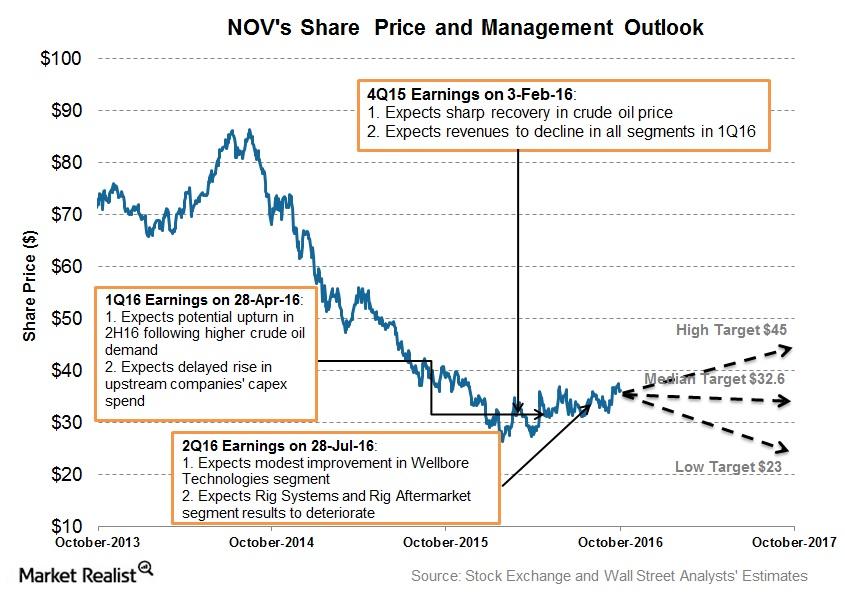
What Are National Oilwell Varco’s Estimates for 3Q16?
National Oilwell Varco’s management outlook National Oilwell Varco’s (NOV) management expressed optimism over a potential rig count recovery in North America. NOV’s revenues and income could be affected positively if the US rig count increases, as it did during 3Q16. In the company’s 2Q16 conference call, NOV chairman and CEO Clay Williams stated that “we believe […]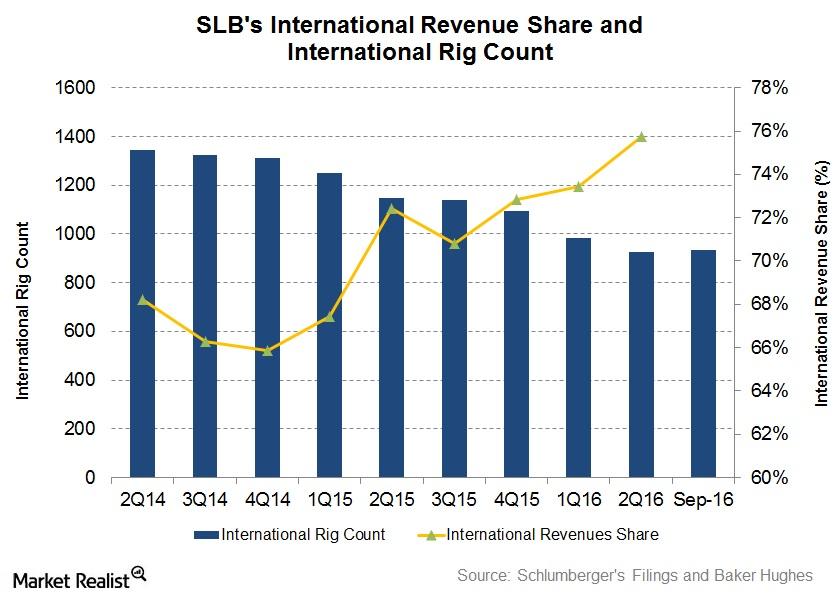
How Important Are International Rig Counts to Schlumberger?
SLB’s international revenues rose to 76% of its total revenues in 2Q16, as compared to 72% in 2Q15.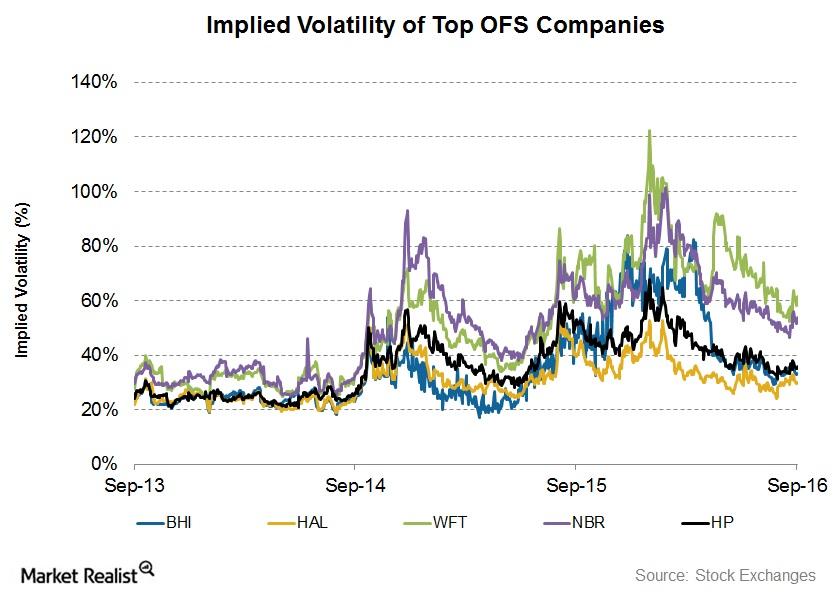
Implied Volatility: Analyzing the Top Oilfield Service Companies
On September 22, Halliburton’s implied volatility was ~28.5%. Since July 20, 2016, its implied volatility rose from ~27% to the current level.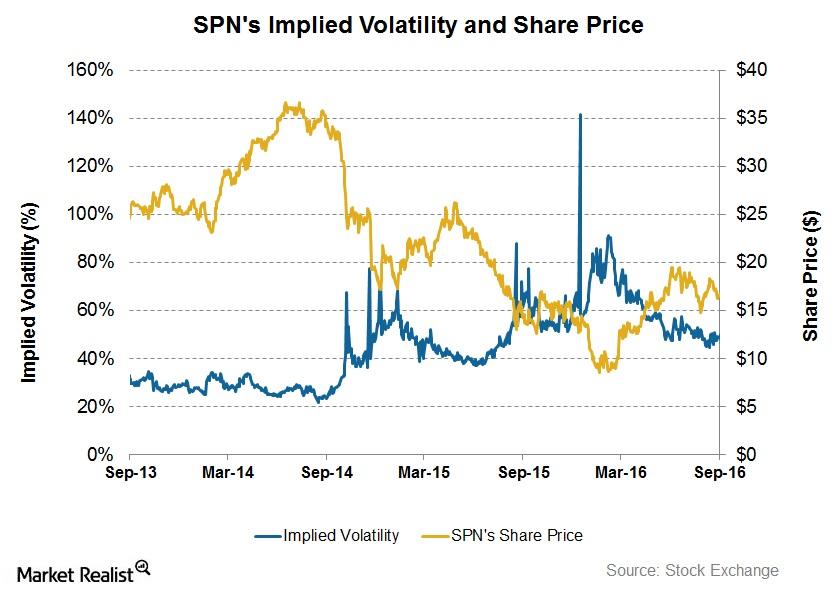
Is It Time for SPN’s Options Traders to Make a Move?
On September 14, 2016, Superior Energy Services (SPN) had an implied volatility of ~51%.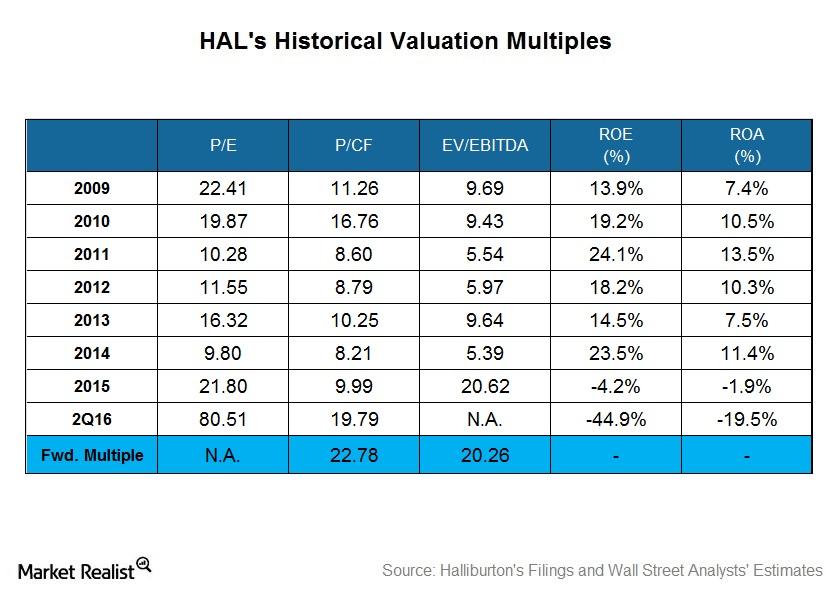
Explaining Halliburton’s Historical Valuation
A steeper earnings decline compared to the decline in its share price caused Halliburton’s (HAL) PE multiple to expand in 2015.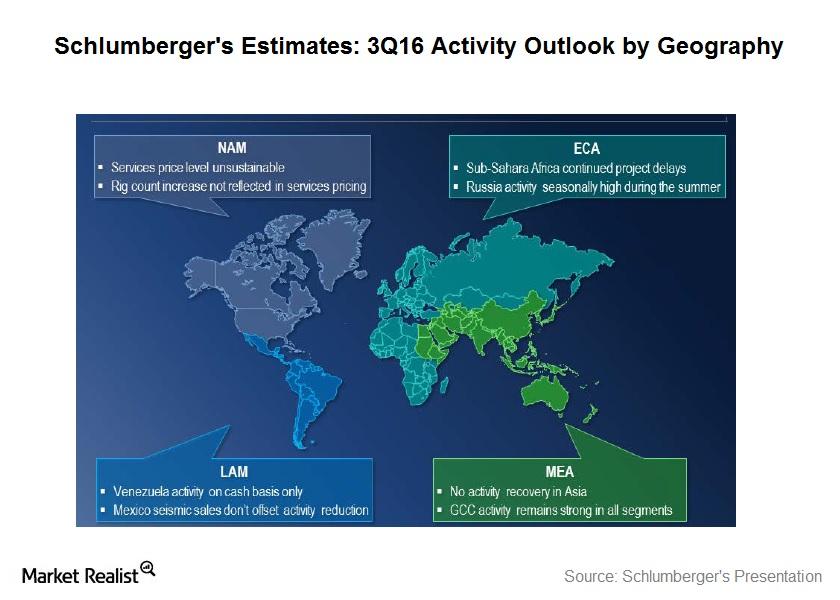
Which Geography Is Working the Best for Schlumberger?
Schlumberger’s business model is diversified and not overly dependent on any particular line of business, catering to upstream companies’ needs.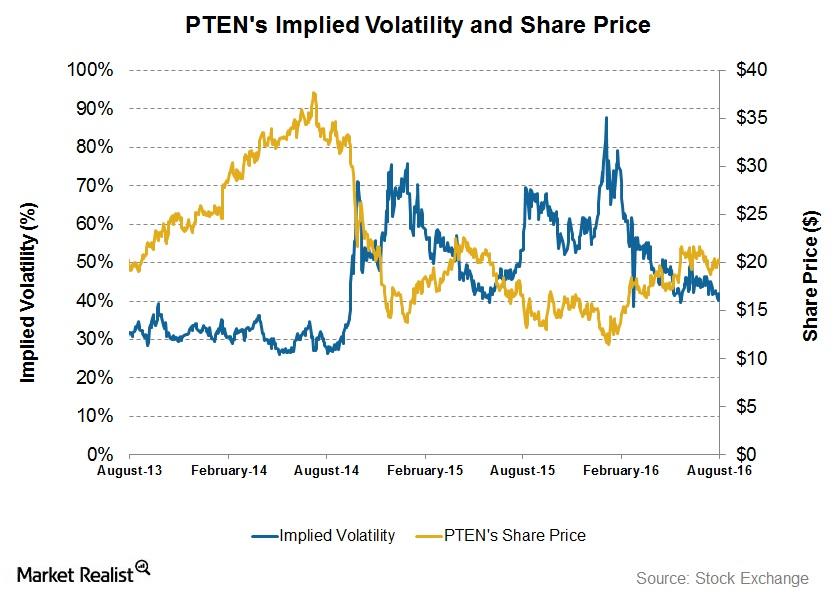
How Volatile Is Patterson-UTI Energy after 2Q16?
On August 19, Patterson-UTI Energy had an implied volatility of ~40%. Since its 2Q16 results were announced, its implied volatility has fallen from ~45%.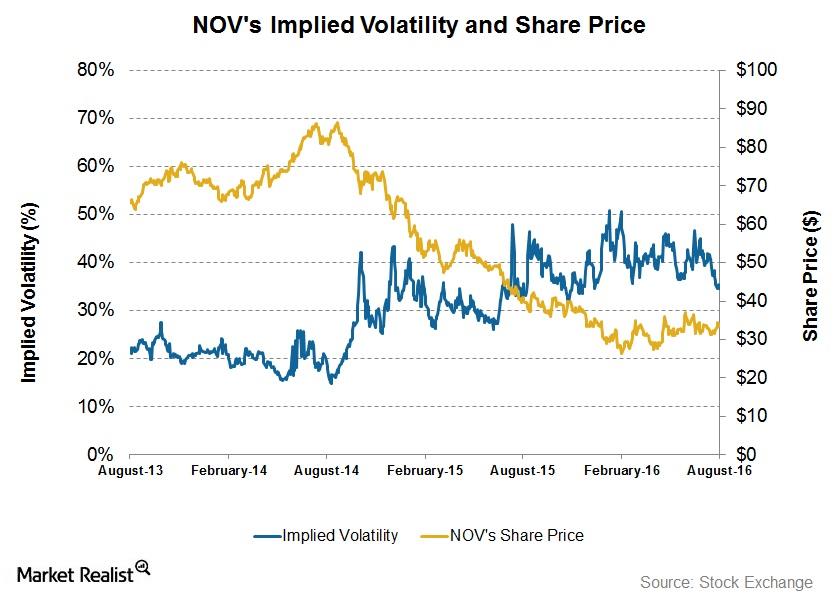
How Volatile Is National Oilwell Varco?
On August 16, 2016, National Oilwell Varco (NOV) had an implied volatility of ~35%.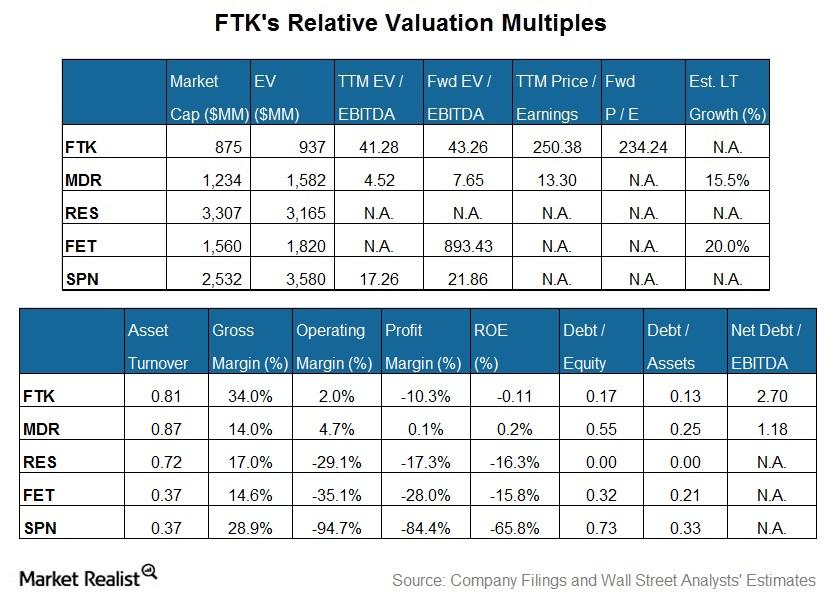
How Is Flotek Industries Currently Valued Compared to Its Peers?
RPC is the largest company by market capitalization among our set of select OFS companies. Flotek Industries is the smallest of the lot.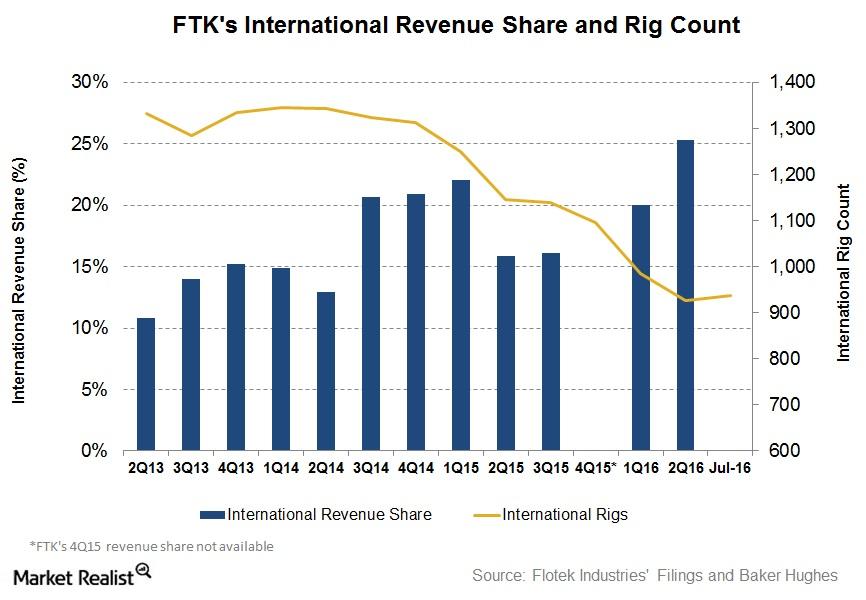
Does the Rig Count Affect Flotek Industries’ International Revenue?
In the past year, Flotek Industries’ (FTK) revenue share generated outside the United States has risen by nearly 10%.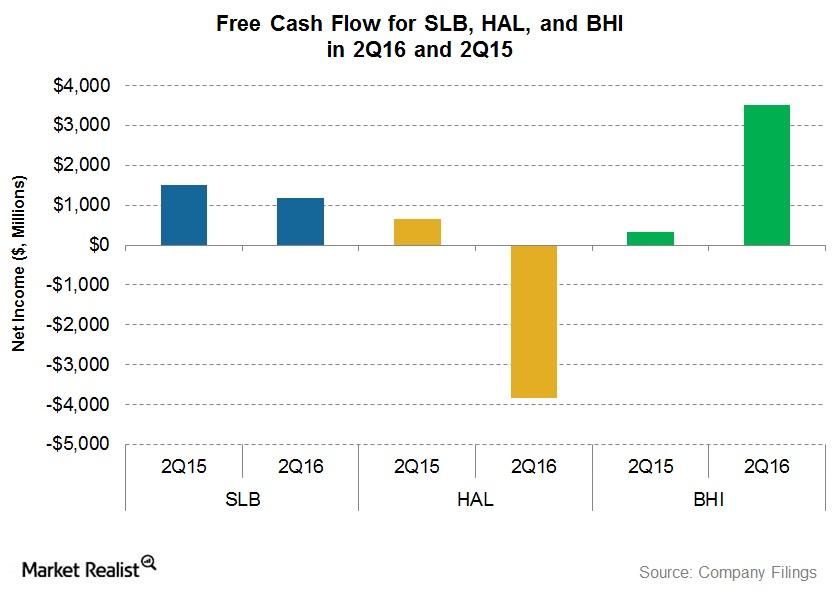
Why Is Schlumberger’s Free Cash Flow So Remarkable?
In this part of the series, we’ll take a look at free cash flow for Schlumberger (SLB), Halliburton (HAL), Baker Hughes (BHI), and FMC Technologies (FTI).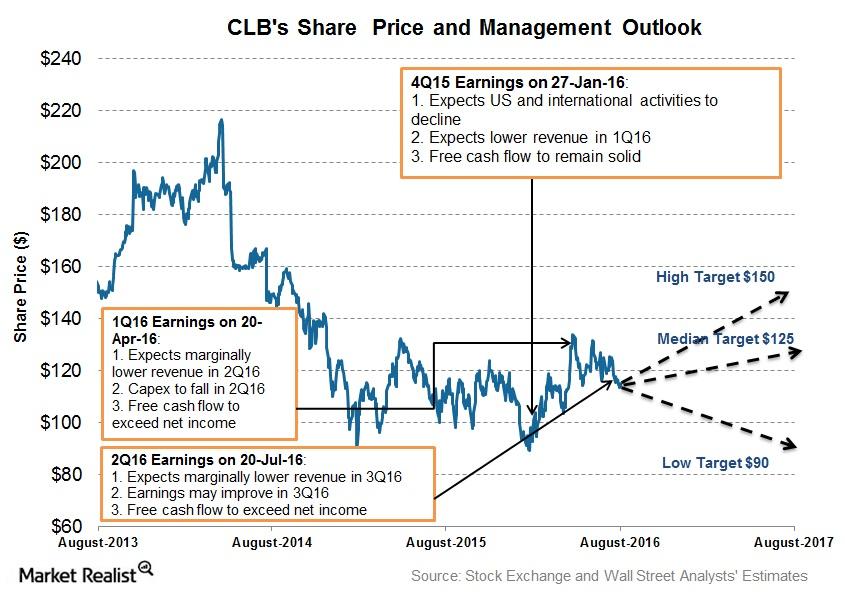
Inside Core Laboratories’ Management Projections for 3Q16
Core Laboratories expects onshore energy production to fall by the end of 2016 and net production of legacy deepwater projects to offset onshore declines.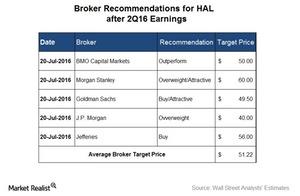
Wall Street’s Forecasts for Halliburton after 2Q16 Earnings
Approximately 82% of analysts tracking Halliburton rate it a “buy” or some equivalent. About 16% rate it a “hold” or equivalent, and 2% recommend a “sell.”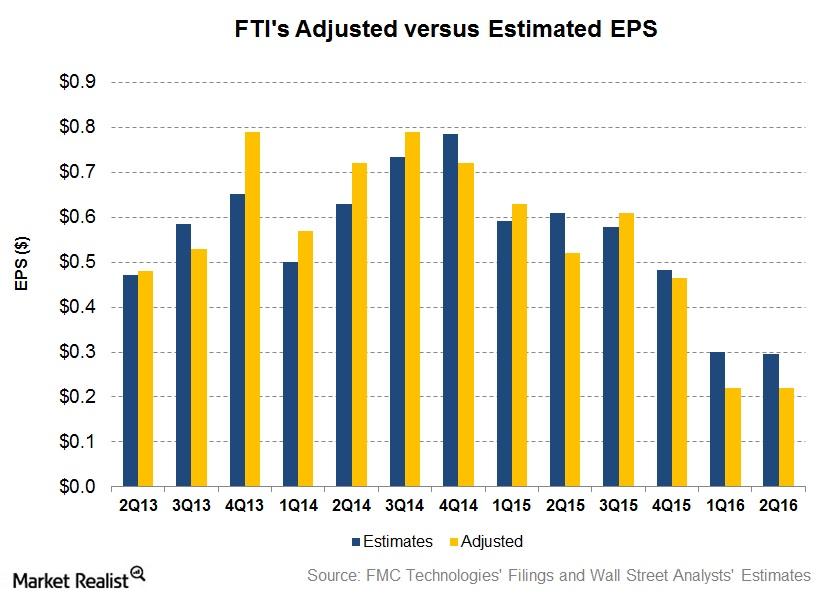
Why Did FMC Technologies’s 2Q16 Earnings Miss Estimates?
FMC Technologies (FTI) released its 2Q16 financial results on July 20. The company recorded total revenues of ~$1.2 billion in 2Q16, down by ~32% from ~$1.7 billion recorded in 2Q15.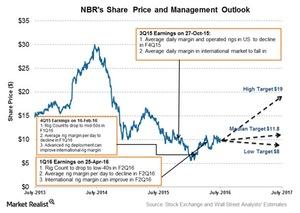
What Is Nabors Industries’s Management Outlook for 2Q16?
Nabors Industries’s (NBR) management expects the crude oil market to start recovering in 2017. The recovery is expected to benefit the high-performance rigs first.