What Does Halliburton’s Implied Volatility Indicate?
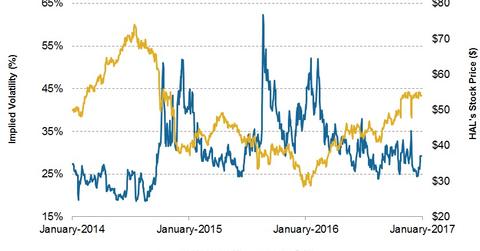
On January 3, 2017, Halliburton (HAL) had implied volatility of ~29%. Since HAL’s 3Q16 financial results were announced on October 19, 2016, its implied volatility has remained nearly unchanged.
Jan. 9 2017, Updated 9:06 a.m. ET

Halliburton’s implied volatility
On January 3, 2017, Halliburton (HAL) had implied volatility of ~29%. Since HAL’s 3Q16 financial results were announced on October 19, 2016, its implied volatility has remained nearly unchanged.
What does implied volatility mean?
Implied volatility (or IV) reflects investors’ views of a stock’s potential movement. However, IV does not forecast direction. Implied volatility is derived from an option pricing model. Investors should note that the correctness of an implied volatility level suggests that prices can be uncertain.
CARBO Ceramic’s (CRR) implied volatility on January 3 was ~71%, while Helix Energy Solutions Group’s (HLX) implied volatility was ~62% on that day. Helmerich & Payne’s (HP) implied volatility on January 3 was ~33%.
Energy stocks are typically correlated with crude oil prices. Has HAL’s correlation with crude oil prices increased? Let’s find out in the next part of this series.
