Analyzing the Net-Debt-to-EBITDA Ratios of 4 Major Mid-Cap OFS Companies
In fiscal 2015, RPC’s (RES) net-debt-to-EBITDA ratio stood at -0.54, down from the 0.34 it saw in 2014. The company’s long-term debt stood at zero in 2015.
March 22 2016, Published 1:43 p.m. ET

Comparing debt profiles
Net debt is total debt minus cash, cash equivalents, and short-term marketable securities. The net-debt-to-EBITDA (earnings before interest, tax, depreciation, and amortization) ratio shows how many years it would take to repay its debt if net debt and EBITDA were to remain unchanged. Here we’ll analyze indebtedness for our group of OFS (oilfield equipment and services) companies in fiscal 2015.
RES has the least net debt-to-EBITDA in the group
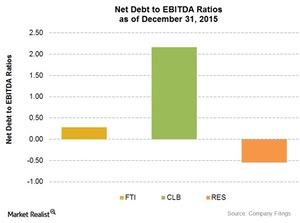
In fiscal 2015, RPC’s (RES) net-debt-to-EBITDA ratio stood at -0.54, down significantly from the 0.34 it saw one year previously. In fiscal 2015, the company’s long-term debt was at zero, while its cash and marketable securities increased 5.6x over fiscal 2014, leading to negative net debt. In fiscal 2015, RES’s TTM (trailing-twelve-month) EBITDA decreased by 81% compared to fiscal 2014. This negative net debt led to a negative net-debt-to-EBITDA ratio in fiscal 2015.
FMC Technologies’ indebtedness
In fiscal 2015, FMC Technologies’ (FTI) net-debt-to-EBITDA ratio stood at 0.28, down by 41% from 0.48 in fiscal 2014. FTI’s fiscal 2015 long-term borrowing decreased by 12% compared to fiscal 2014, while cash and marketable securities increased by 43%. In effect, the company’s net debt decreased significantly in fiscal 2015. But although FTI’s TTM EBITDA dipped by 39%, this could not offset the fall in net debt, and so FTI’s net-debt-to-EBITDA ratio decreased.
Core Laboratories is highly leveraged
In fiscal 2015, Core Laboratories’ (CLB) net-debt-to-EBITDA ratio stood at ~2.17. The ratio more than doubled in one year, and CLB’s long-term borrowing shot up by 22% from fiscal 2014 to fiscal 2015, even while cash and marketable securities decreased marginally during the same period. CLB’s TTM EBITDA nearly halved during that period. Core Laboratories makes up 4.4% of the VanEck Vectors Oil Services ETF (OIH).
In fiscal 2015, Weatherford International’s (WFT) net debt decreased marginally over fiscal 2014. However, its TTM EBITDA was negative, and so its net debt-to-EBITDA ratio was not meaningful.
Continue to the next part for a look at the valuations of our group of four mid-cap OFS companies.
