Core Laboratories NV
Latest Core Laboratories NV News and Updates

Returns for OFS Stocks with High and Low Implied Volatility
Schlumberger had the lowest implied volatility figures among all of the OFS companies on May 31, 2016. It has returned 9.4% on a YTD basis.

Returns of Oilfield Services Stocks with High Implied Volatility
Tidewater (TDW) has the highest implied volatility among all of the OFS companies. The stock has fallen 65.1% on a YTD (year-to-date) basis.

What Rate Hike Road Is the Fed Really on in 2016? (It Looks Strangely Like 2015)
Policymakers are now hinting toward a rate hike in June. But markets seem to be feeling otherwise.

Correlation between Crude Oil and Halliburton on September 5
The correlation coefficient between the price of crude oil and Halliburton (HAL) stock from September 5, 2016, to September 5, 2017, is 0.65.

Wall Street’s Targets for SLB, HAL, KEG, NBR, and CLB
In this article, we’ll look at Wall Street’s targets for the OFS stocks that had the highest net debt-to-equity ratios in the first quarter.

What Do Analysts Expect from Baker Hughes’s 4Q16 Earnings?
In 4Q16, analysts expect an $0.11 adjusted loss per share for Baker Hughes. They expect Baker Hughes’s adjusted loss to improve 29% in the coming quarter.

Is Schlumberger’s Stock Price Showing Weakness?
On February 23, 2018, Schlumberger was trading at $66.50, which is ~17% lower than its price a year ago.

What Analysts Expect from Flotek Industries’ 3Q17 Earnings
In 3Q17, analysts expect Flotek Industries (FTK) to report adjusted earnings per share of $0.02. Wall Street expects FTK’s revenues to rise 1% over 2Q17 to $86.2 million.

OPEC’s Crude Oil Production Rose in June
On July 2, a Reuters survey showed that OPEC’s crude oil production increased by 320,000 bpd (barrels per day) to 32,320,000 bpd in June.

Saudi Arabia’s Crude Oil Production Could Hit a New Record
Reuters estimates that Saudi Arabia’s crude oil production increased by 700,000 bpd to 10,700,000 bpd in June—compared to the previous month.

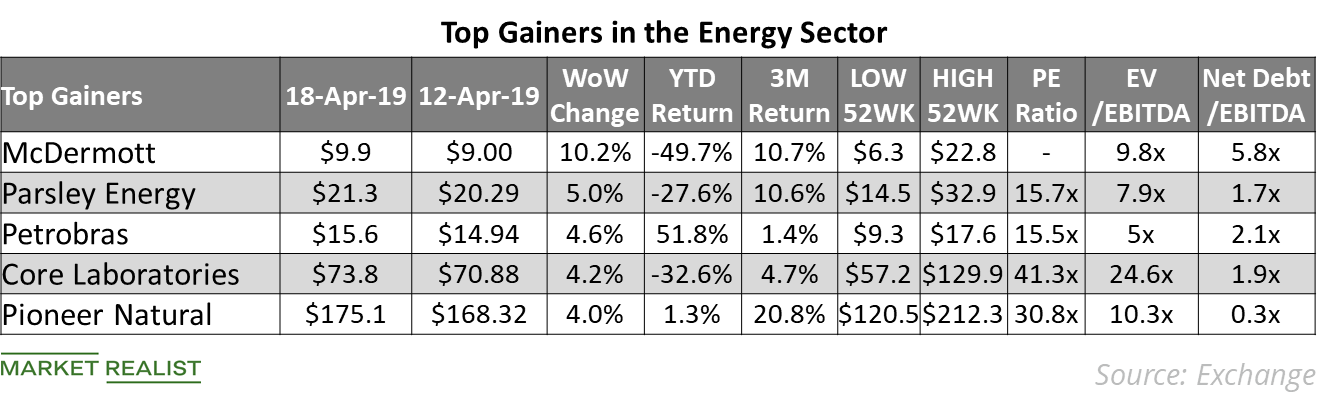
Top Energy Gains Last Week
On April 16, McDermott International announced that it will release its first-quarter earnings results on April 29.

Superior Energy Services Reacts to Crude Oil’s Price
Superior Energy Services’ (SPN) correlation with crude oil’s price on March 28–June 28 was 0.62—a strong positive relationship.

How WFT Stock Has Reacted to Crude Oil Prices
Weatherford International (WFT) stock’s correlation with crude oil was strong between June 29 and July 6, at 0.72.

How Rig Count and Upstream Operator Capex Affected FTK
From 2Q16 to 2Q17, Flotek Industries’ (FTK) EBITDA margin (or EBITDA as a percentage of revenues) improved to 2.3% from 0.7%.

Analyzing OFS Stocks with High and Low Implied Volatility
Tidewater had the highest implied volatility among all of the OFS companies that are part of OIH. The stock has fallen 78.6% on a YTD (year-to-date) basis.

How’s Schlumberger Valued Compared to Its Peers?
Schlumberger (SLB) is the largest company by market capitalization among our set of select OFS (oilfield equipment and services) companies.

TETRA Technologies Reacts to Crude Oil
TETRA Technologies’ (TTI) correlation with crude oil on April 12–July 12 was 0.30. The correlation represents a positive relationship.

How Does Halliburton’s Valuation Compare to Peers?
Halliburton’s (HAL) EV (approximately the summation of its equity value and net debt) when scaled by trailing-12-month (or TTM) adjusted EBITDA is lower than the peers’ average in the group.

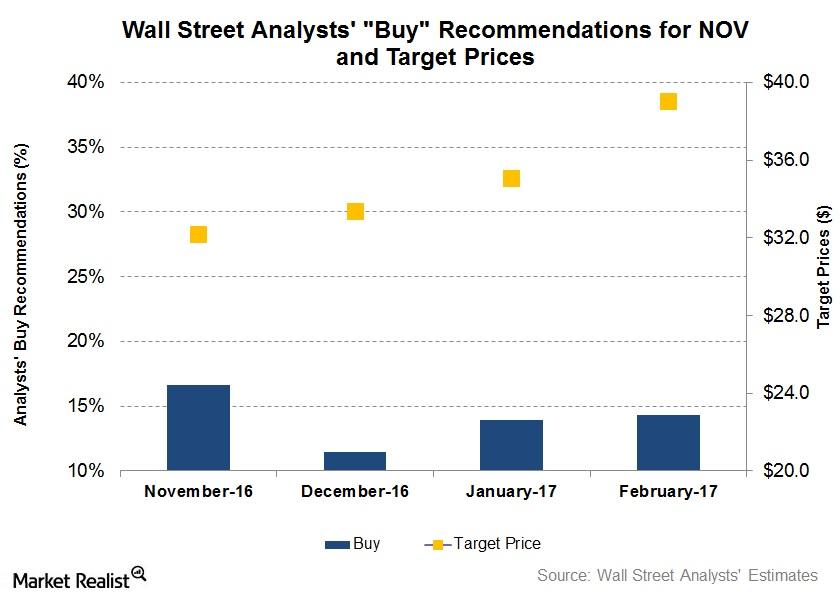
Wall Street Analysts’ Forecasts for National Oilwell Varco
On February 24, ~14% of the analysts tracking National Oilwell Varco rated it as a “buy,” ~74% rated it as a “hold,” and 12% rated it as a “sell.”

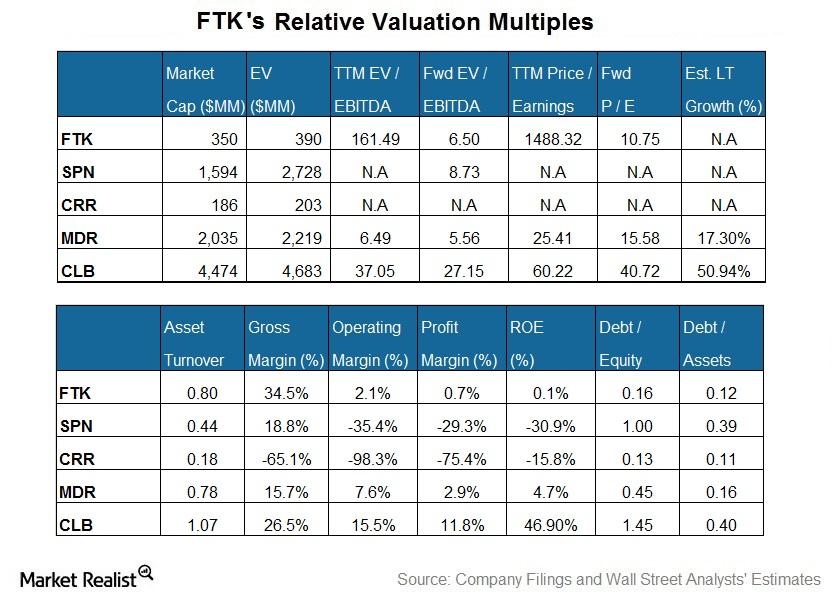
Flotek Industries’ Current Valuation versus Its Peers
Sell-side analysts expect Flotek’s adjusted EBITDA to rise sharper in the next four quarters compared to its peers.

What’s Up with Halliburton’s Net Debt-to-Equity Ratio?
On March 31, 2018, Halliburton’s (HAL) net debt was $8.57 billion, 3% lower than its net debt of $8.88 billion on March 31, 2017.

What Analysts Expect from Nabors Industries’ 2Q17 Earnings
In 2Q17, analysts expect Nabors Industries (NBR) to post adjusted loss of $0.35 per share.

David Einhorn Was Right about Apple
Greenlight Capital (GLRE) exited its position in Apple in the third quarter of 2018.

Upstream Operators’ Capex and Patterson-UTI Energy’s 2017 Margins
In the past couple of years, some major US upstream and integrated companies have reduced their capex following the sharp fall in crude oil prices.

How Did Schlumberger React to Crude Oil Prices Last Week?
Crude oil prices have risen significantly since the end of June 2017. Analysts don’t expect much impending downside in crude oil prices.

Can National Oilwell Varco’s Dividend Fall More?
The latest dividend reduction should improve National Oilwell Varco’s future net cash flow. Its free cash flow increased 58% to $493 million in fiscal 4Q15.

Short Interest in Flotek Falling: What Does It Mean?
Short interest in FTK Flotek Industries’ (FTK) short interest as a percentage of float was 21.3% on December 20, compared with 23.3% on September 30. Since the end of 3Q16, FTK’s short interest has fallen 10%. FTK’s share price and short interest as a percentage of float been mostly inversely related in the past three years. […]

US Offshore Rig Count Rose Again Last Week
In the week ending October 16, 2015, one US offshore rig was added to the previous week’s total, taking the count to 33 rigs.

Weatherford International’s Short Interest on July 17
Short interest in Weatherford International (WFT) as a percentage of its float was 12.6% on July 17.

Why Halliburton’s Q2 2018 Earnings Narrowly Missed Estimates
Halliburton (HAL) released its Q2 2018 financial results today. The company recorded total revenues of ~$6.15 billion in Q2 2018, up 24% from its ~$4.96 billion in Q2 2017.

Short Interest in ION Geophysical
As of January 19, the short interest in ION Geophysical (IO) as a percentage of its float was 8.9%—compared to 6.4% as of January 1.

Schlumberger Reports Q2 2018 Earnings, Beats Estimates
Schlumberger (SLB) released its Q2 2018 results on July 20 with total revenue of $8.3 billion, up 11.3% from $7.46 billion in Q2 2017.

TETRA Technologies: Wall Street Analysts’ Forecast
Approximately 83% of Wall Street analysts tracking TETRA Technologies rated it as a “buy” or some equivalent as of July 12.

What Analysts Project for TechnipFMC in the Second Quarter
In Q2 2018, analysts expect TechnipFMC to post adjusted EPS of $0.38, a 37% increase compared to the Q1 2018 adjusted earnings of $0.28.

How Is Baker Hughes Reacting to Crude Oil Prices?
The correlation coefficient between Baker Hughes’s (BHGE) stock price and crude oil price between April 5, 2017, and July 5, 2018, was 0.15.

The Top Energy Decliners in the Week Ended July 6
During the week ended July 6, US crude oil August futures and natural gas August futures fell 0.5% and 2.3%, respectively.

Why Baker Hughes’s Q2 2018 Earnings Rose
For Q2 2018, analysts expect Baker Hughes to post adjusted earnings per share of $0.14.

Are Hedge Funds Buying TELL, LGCY, AROC, and CLB?
In Q1 2018, ten hedge funds either created new positions or added to their positions in Tellurian (TELL).

Patterson-UTI Energy’s ‘Buy’ Ratings Are Increasing
On March 19–June 19, the percentage of analysts recommending a “buy” or some equivalent for Patterson-UTI Energy has increased from 76% to 78%.

A Look at the Short Interests of SLB, HAL, KEG, NBR, and CLB
Short interest in Schlumberger (SLB) as a percentage of its float was 1.5% on June 1, 2018, compared to 1.8% on June 1, 2017.

Comparing the Returns of 5 OFS Companies by Net Debt-to-Equity
From June 1, 2017, to June 1, 2018, Key Energy Services (KEG) produced an -11% return.

The 5 Oilfield Companies with the Highest Net Debt-to-Equity
In this series, we’ll analyze the five oilfield equipment and services companies with the highest net debt-to-equity ratios in Q1 2018.

Short Interest in the Top 5 OFS Companies by Free Cash Flow
Short interest in Schlumberger (SLB) as a percentage of its float was 1.7% on March 20, 2018, compared to 1.2% on March 20, 2017.

What Wall Street Analysts Recommend for Halliburton
On February 15, 2018, approximately 92% of the Wall Street analysts tracking Halliburton rated it a “buy” or some equivalent.

Wall Street’s Forecast for Schlumberger after 4Q17 Earnings
Approximately 71% of the analysts tracking Schlumberger rated it as a “buy” or some equivalent on January 19, 2018.

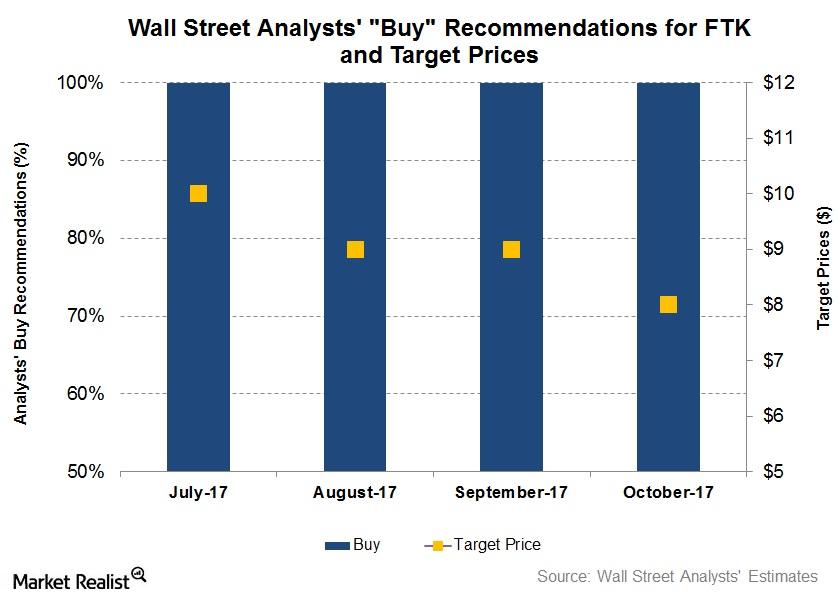
Wall Street’s Forecast for Flotek Industries before Its 3Q17 Earnings
On October 16, 2017, all analysts tracking Flotek Industries rated it as a “buy” or some equivalent.

Analysts’ Forecast for Weatherford before Its 3Q17 Earnings
On October 10, 2017, ~74% of the Wall Street analysts tracking Weatherford International rated it as a “buy” or some equivalent.

Flotek Industries Stock: Biggest Fall in the Industry
Having looked at the percentage gainers this week, we’ll now move on to the percentage losers from the oilfield services (or OFS) sector in the United States from September 25 to 27.

Core Laboratories’ Dividend Yield Curve
Core Laboratories recorded a 7.0% rise in revenue for the first half of 2017. The growth was driven by production enhancement, offset by reservoir description.

Wall Street’s Call on Weatherford International
In this article, we’ll look Wall Street’s call and target price for Weatherford International (WFT) on September 12.

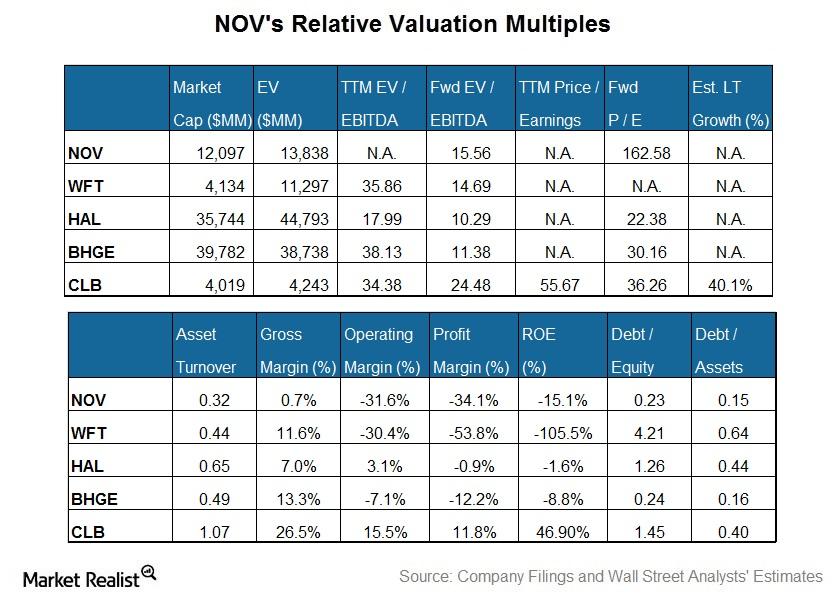
National Oilwell Varco’s Valuation Compared to Its Peers
National Oilwell’s valuation, expressed as the TTM PE (price-to-earnings) multiple, isn’t available due to its negative adjusted earnings.

What’s Affected National Oilwell Varco’s Margin in 2017
Upstream operators’ capex cut Between 2Q16 and 2Q17, 19 of the largest US energy exploration and production companies, in aggregate, slashed their capex by 8%. In general, lower upstream capex results in lower revenue and narrower operating margins for oilfield services and equipment companies. National Oilwell Varco’s earnings margin As shown in the graph above, National Oilwell […]

Wall Street Analysts’ Recommendations for Flotek Industries
On August 10, 2017, all of the sell-side analysts tracking Flotek Industries rated it as a “buy.” None of the analysts rated Flotek as a “hold” or “sell.”

Correlation between Weatherford and Crude Oil on August 4
Weatherford International (WFT) stock and crude oil prices have had a steady positive correlation in the past year.

Flotek on the Street: The Latest Analyst Recommendations
According to Reuters, on June 30, 2017, all of the sell-side analysts tracking Flotek Industries (FTK) have rated the stock a “buy” or some equivalent.

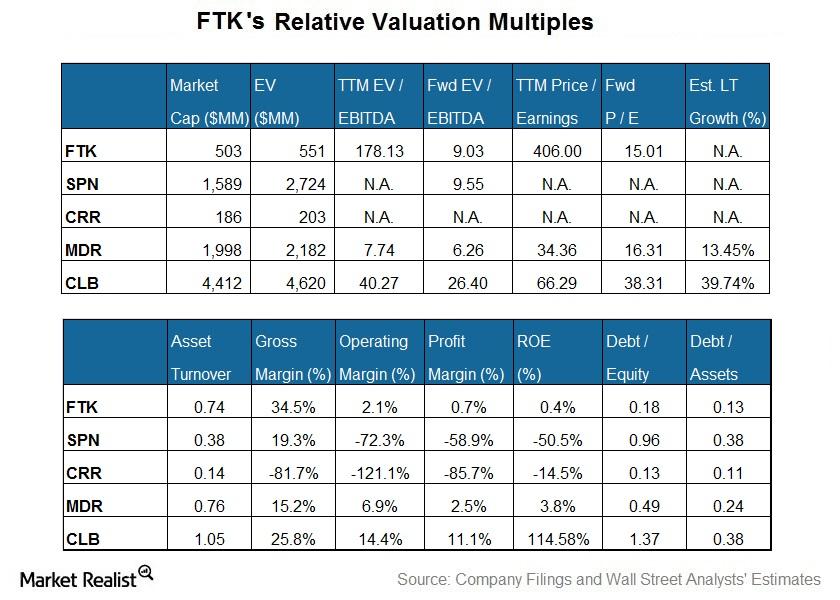
Weighing Flotek’s Current Valuation against Peers
Sell-side analysts expect FTK’s adjusted EBITDA to rise more sharply over the next four quarters than those of its peers.

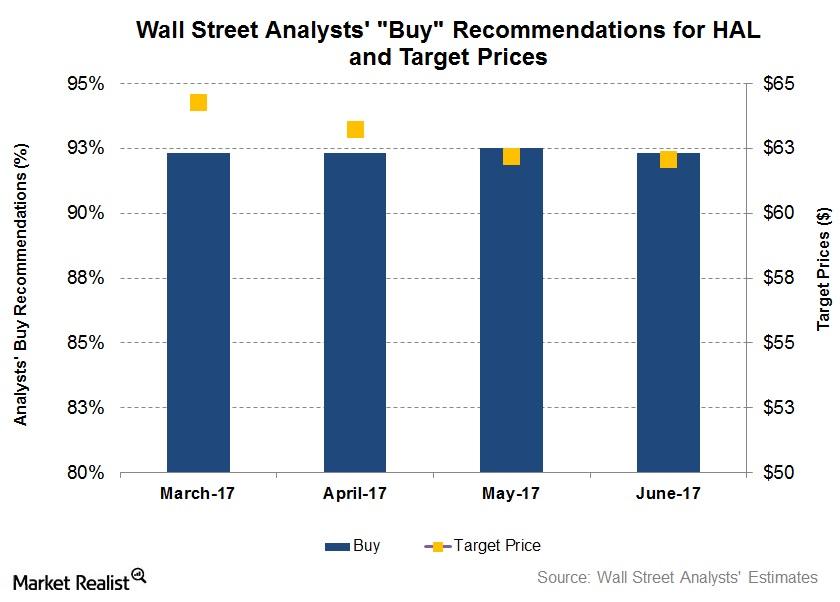
Analysts’ Recommendations for Halliburton
On June 12, 92% of the analysts tracking Halliburton rated it as a “buy,” ~3% of the analysts rated it as a “sell,” and the other 5% rated it as a “hold.”

Can Upstream Operators’ Capex Affect PTEN’s Margin in 2017?
Some of the major US upstream and integrated companies have gradually reduced their capex following crude oil’s sharp price fall since mid-2014.

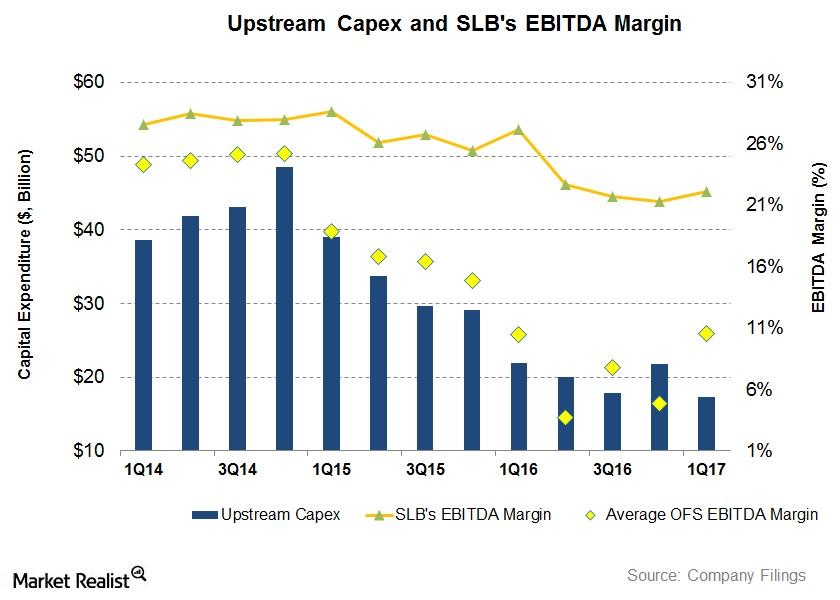
Upstream Operators’ Capex Could Impact Schlumberger’s Margin
Schlumberger’s EBITDA margin was impacted negatively as upstream companies slashed their budgets. From 1Q16 to 1Q17, Schlumberger’s EBITDA margin fell.

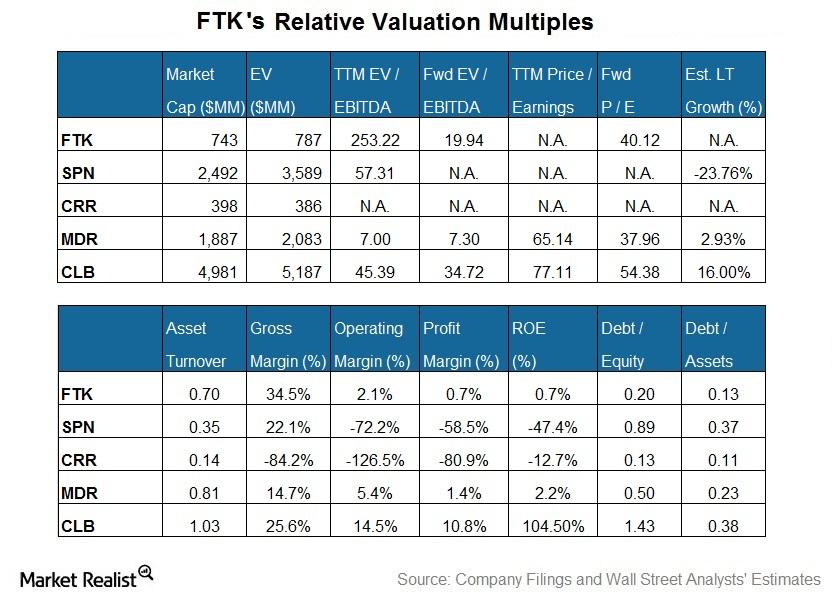
How Flotek Industries Is Valued versus Peer Stocks
Core Laboratories (CLB) is the largest company by market capitalization among our set of select oilfield services and equipment (or OFS) companies…

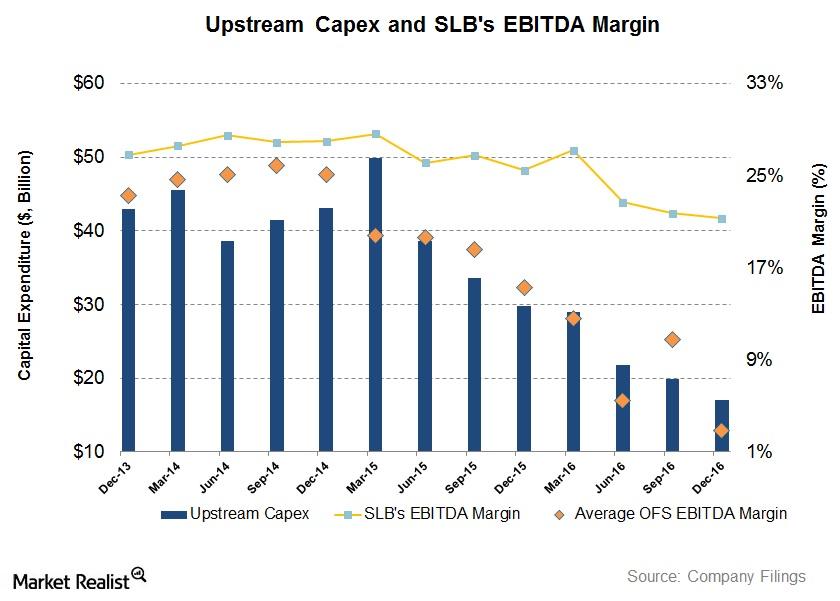
Will Upstream Operators’ Capexes Affect SLB’s 1Q17 Margin?
In the past couple of years, some major US upstream and integrated companies have reduced their capital expenditures (capex) following crude oil’s sharp fall.

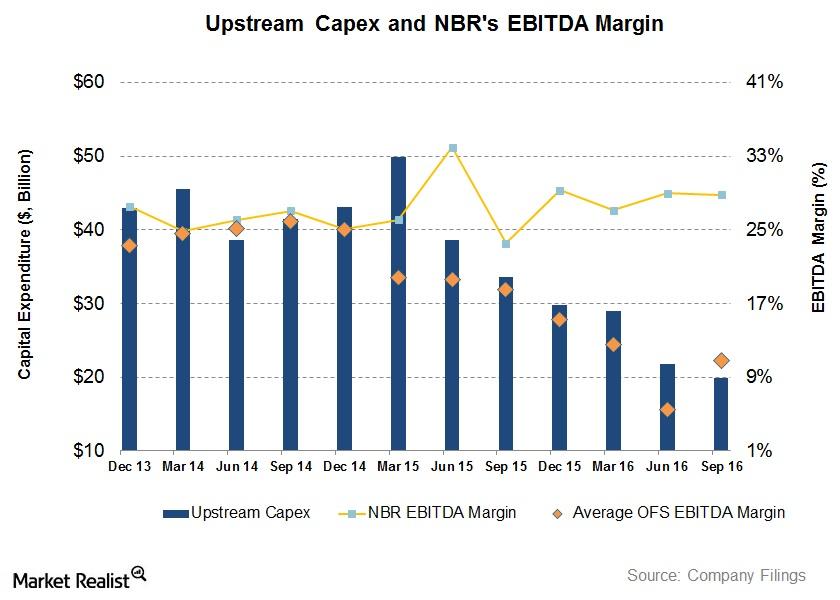
Will Upstream Operators’ Capex Affect Nabors’ 4Q16 Margin?
In the past couple of years, some of the major US upstream and integrated companies have reduced capital expenditure following crude oil prices’ sharp decline.

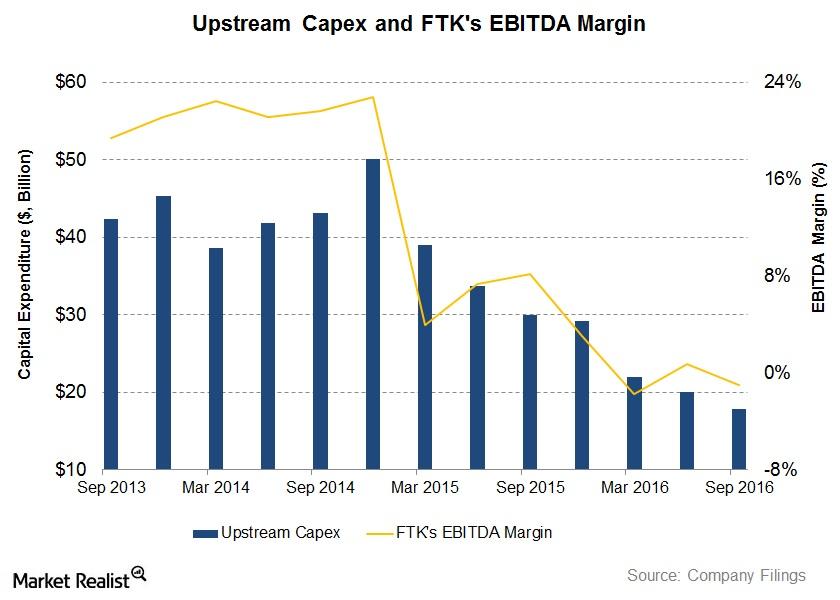
Will Upstream Operators’ Capex Affect Flotek’s 4Q16 Margin?
In the past couple of years, some of the major US upstream and integrated companies have reduced capital expenditure as a result of crude oil’s sharp decline.

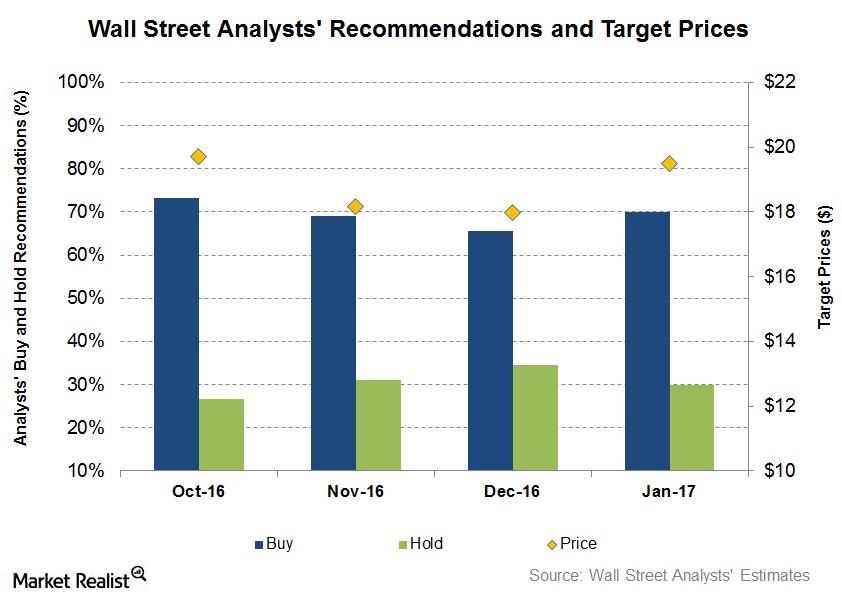
How Have Superior Energy’s Recommendations Changed before the 4Q16 Earnings?
On January 6, 2017, ~70% of the analysts tracking SPN recommended a “buy” or some equivalent for the stock, while ~30% of the analysts issued a “hold.”

Why Did Baker Hughes’s Short Interest Increase?
The short interest in Baker Hughes (BHI) stock as a percentage of its float was 2.3% as of January 10—compared to 1.8% as of September 30.

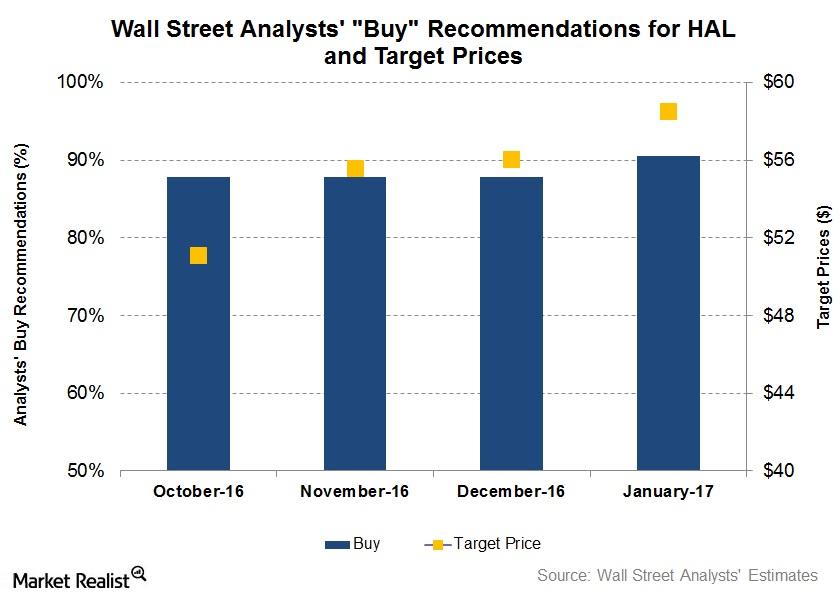
Wall Street’s Forecasts for Halliburton before Its 4Q16 Earnings
On January 3, 2017, 90% of the analysts tracking Halliburton (HAL) rated it a “buy” or some equivalent.

Worst Oilfield Service Stocks: Analyzing Implied Volatility
In this article, we’ll compare implied volatility for the worst oilfield service (or OFS) companies by expected earnings growth for 3Q16.

Has CLB’s Correlation to Crude Oil Increased since 2Q16?
Correlation coefficient In this part, we’ll analyze the correlation between Core Laboratories’s (CLB) stock price and West Texas Intermediate (or WTI) crude oil’s price. The correlation coefficient between CLB’s and crude oil’s prices measures the statistical relationship between the two variables. A correlation coefficient value of 0 to 1 shows a positive correlation, 0 states […]

How the US Rig Count May Have Affected Core Laboratories in 3Q16
In the past year, Core Laboratories’s (CLB) revenue has fallen. In 2Q16, CLB’s revenue fell 3.6% over 1Q16.

Will Core Laboratories’ Strategies Improve Returns?
OFS companies like Core Laboratories (CLB) are affected by rig counts and energy prices, and crude oil prices have declined by ~7% in the past year.

How Volatile Is Core Laboratories Now?
On August 8, 2016, Core Laboratories had an implied volatility of ~44.5%. After its 2Q16 results on July 20, its implied volatility increased from ~35.6%.

Core Laboratories’ Short Interest Is Increasing, but What Will That Mean?
Core Laboratories’ (CLB) short interest as a percentage of its float is 14.9% as of August 8, as compared to 13.4% as of June 30.

Is Core Laboratories Overvalued at Current Levels?
Core Laboratories’ PE multiple increased sharply in 2Q16 as compared to fiscal 2015. CLB’s adjusted earnings decreased by ~46% as compared to 4Q15.

What Will Core Laboratories’ Drivers Be in 2016 and Beyond?
From 2Q15 to 2Q16, all of Core Laboratories’ segments saw lower revenues. Its Reservoir Management segment suffered the highest revenue decline (59%).

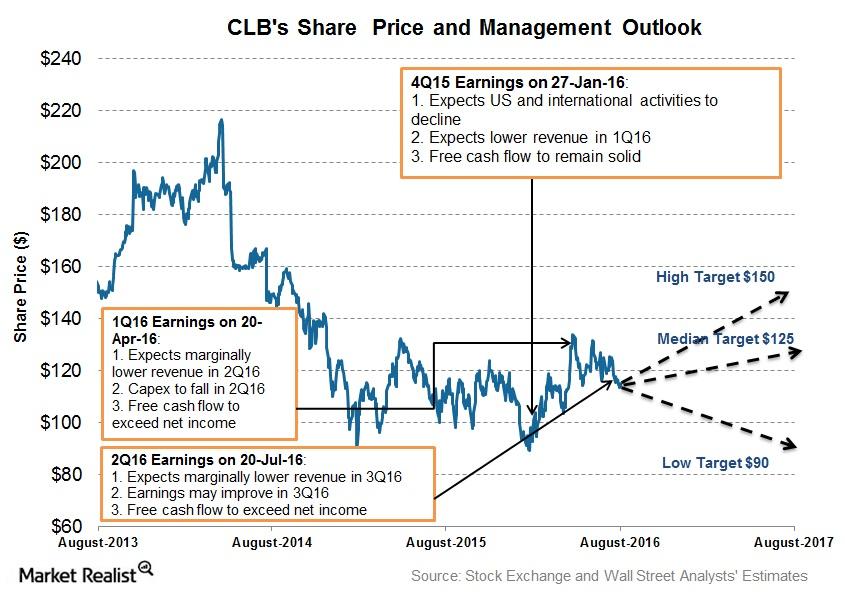
Inside Core Laboratories’ Management Projections for 3Q16
Core Laboratories expects onshore energy production to fall by the end of 2016 and net production of legacy deepwater projects to offset onshore declines.

Did Permian Shale Crude Oil Production Drop in June?
The EIA estimates that the Permian Basin’s crude oil production was 2.0 MMbpd in June 2016. That was marginally down from production in May 2016 but 5% higher than production in June 2015.

Understanding Mid-Cap OFS Companies’ Correlations with Crude Oil
The correlation coefficient between Weatherford International’s stock price and crude from June 2015 to now is the lowest among our four OFS companies.

A Comparative Valuation of Four Representative OFS Mid-Caps in 2Q16
Dril-Quip’s EV, when scaled by TTM adjusted EBITDA is the lowest in our group of four OFS companies after 1Q16.

Inside the Correlation between Core Laboratories’ Stock and Crude Oil
The correlation coefficient between Core Laboratories’ stock price and crude oil from June 2015 to the present is 0.56—a strong positive relationship.

What Does It Mean that Core Laboratories’ Short Interest Is Declining?
In 1Q16, 173 funds bought Core Laboratories’ stock, and 171 funds sold CLB’s shares. So CLB’s total buying funds outnumbered its total selling funds by two.

What Are Halliburton’s Management’s Views for 2Q16?
Halliburton Company’s (HAL) management expects energy production falls and more challenges for upstream energy producers in 2016.

What Does Wall Street Forecast for FMC Technologies?
In this article, we’ll look at Wall Street analysts’ forecasts for FMC Technologies’ (FTI) shares following the announcement of its merger with Technip.

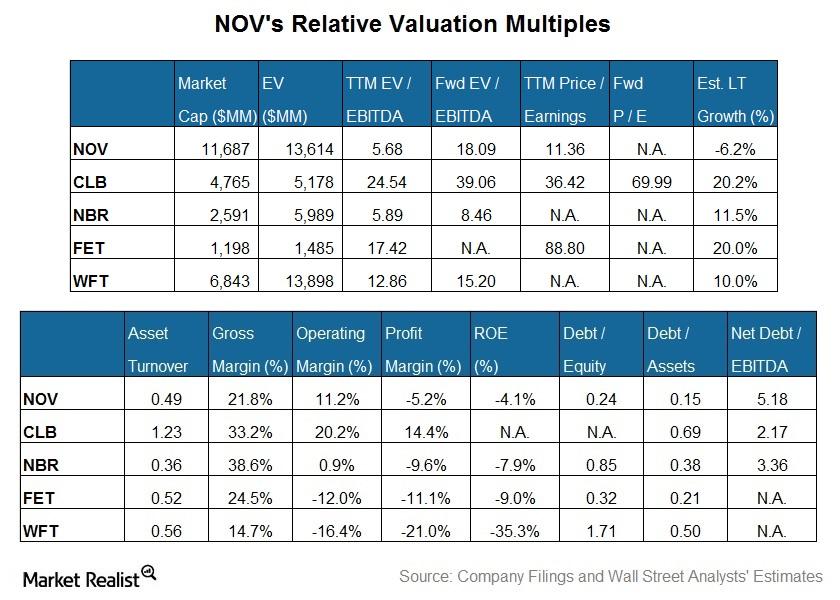
What Is NOV’s Valuation Compared to Its Peers’?
NOV’s enterprise value, when scaled by trailing-12-month adjusted EBITDA, is lower than the peer average.

Analyzing National Oilwell Varco’s Dividend and Dividend Yield
National Oilwell Varco increased its dividend from 2009 to 2015. In 2015, its dividend per share (or DPS) rose 12% to $1.84 compared to $1.64 in 2014.

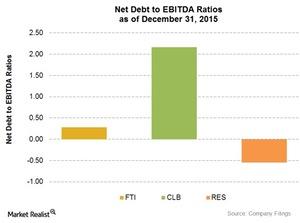
Analyzing the Net-Debt-to-EBITDA Ratios of 4 Major Mid-Cap OFS Companies
In fiscal 2015, RPC’s (RES) net-debt-to-EBITDA ratio stood at -0.54, down from the 0.34 it saw in 2014. The company’s long-term debt stood at zero in 2015.

Which OFS Companies Are Correlated to Crude Oil Prices?
OFS companies are impacted by rig counts and energy prices. In the past year, WTI crude oil prices fell ~12%. Crude oil prices have fallen since June 2014.

Why Niobrara January Crude Oil Production Fell 8% in a Year
The EIA estimates that the Niobrara Shale produced 417,730 bpd (barrels per day) of crude oil in January 2016. This was 2.7% less than production in December 2015 and 8% less than production in January 2015.

PTEN is Confident despite Energy Market Uncertainty
Patterson-UTI Energy’s segment wise performance From 4Q14 to 4Q15, all of Patterson-UTI Energy’s (PTEN) segments saw lower revenues. The Pressure Pumping segment suffered the highest revenue decline of 67% while the Contract Drilling segment was relatively resilient with a 59% fall. These two segments accounted for 99% of PTEN’s 4Q15 revenues. With respect to operating […]

Analyzing Noble Corporation’s Free Cash Flow
Noble’s cash from operating activities (or CFO) increased 36% in fiscal 3Q15 over fiscal 3Q14. NE generated $484 million in CFO in fiscal 3Q15.

Niobrara December Crude Oil Production Fell the Most in 2015
The EIA estimates that the Niobrara Shale produced 414,500 barrels of crude oil per day in December 2015.

What Do Analysts Expect of Halliburton’s Fiscal 4Q15 Earnings?
In fiscal 4Q15, analysts expect adjusted EPS (earnings per share) of $0.24 for Halliburton (HAL).

Nabors Industries’ Debt Level Is a Concern
In fiscal 3Q15, Nabors Industries’ net debt-to-EBITDA multiple was ~10.1x. It has increased more than four-fold in the past year.

Explaining Ensco’s Valuation Compared to Its Peers
Ensco’s forward EV-to-EBITDA multiple is expected to expand versus its TTM EV/EBITDA. However, the expected expansion of the multiple is lower than the peers’ average.

FMC Technologies’ Valuation Compared to Its Peers
FMC Technologies’ valuation, expressed as TTM PE multiple, of 16.6x is lower than its peer average in the group.

Do Cameron International’s Returns Shadow Crude Oil Prices?
Cameron International’s YTD returns have been higher than those of the industry ETF OIH.

Haynesville Shale Natural Gas Production Was Up Again in November
The number of active rigs at the Haynesville Shale was 33 in November 2015, up from 29 in October. A year ago, there were 49 drilling rigs in the region.

Does Baker Hughes’s Return Shadow Crude Oil Prices?
Since the beginning of 2015, the return on Baker Hughes stock has been -11% until December 8. BHI’s peer Core Laboratories (CLB) has performed in line with BHI, producing a return of -5%.

Niobrara’s November Crude Oil Production Fall Is 2015’s Highest
Niobrara Shale oil production rose from 130,000 barrels per day in November 2007 to 390,000 bpd in November 2015. This is a rise of 199% in eight years.

Transocean’s Free Cash Flow Growth Remarkable among Peers
Transocean recorded 292% FCF growth in 2Q15 compared to 2Q14. Transocean’s free cash flow was $1.11 billion in 2Q15 versus $285 million a year earlier.

Weatherford’s 2Q15 EBITDA Drop among the Highest in Industry
Weatherford (WFT) 2Q15 EBITDA turned negative compared to 2Q14. Weatherford’s 2Q15 EBITDA loss was $153 million, a sharp reduction from its $380 million EBITDA a year earlier.