Long Run Exploration Ltd
Latest Long Run Exploration Ltd News and Updates
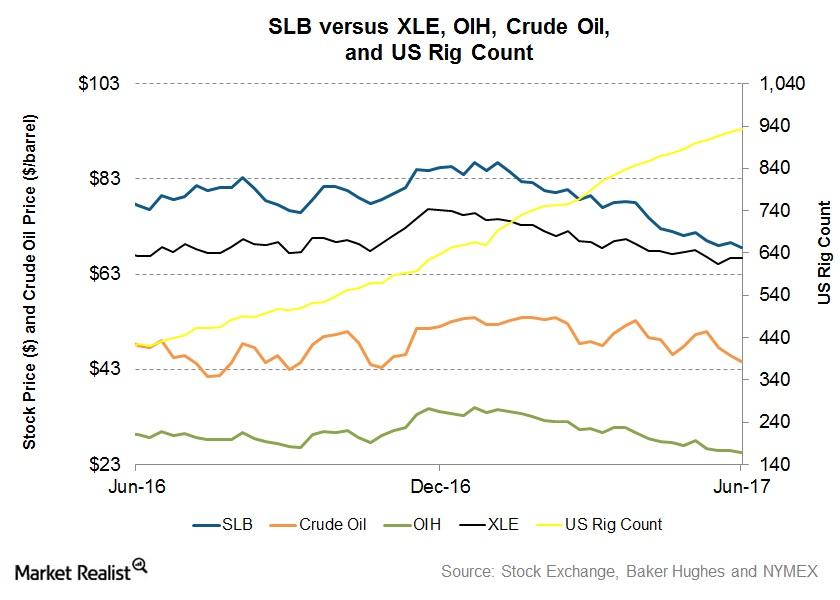
Inside Schlumberger’s 1-Year Returns as of June 16
Schlumberger’s trailing-one-year stock price has fallen 12% as of June 16, 2017, while XLE, the broader energy industry ETF, has fallen 3%.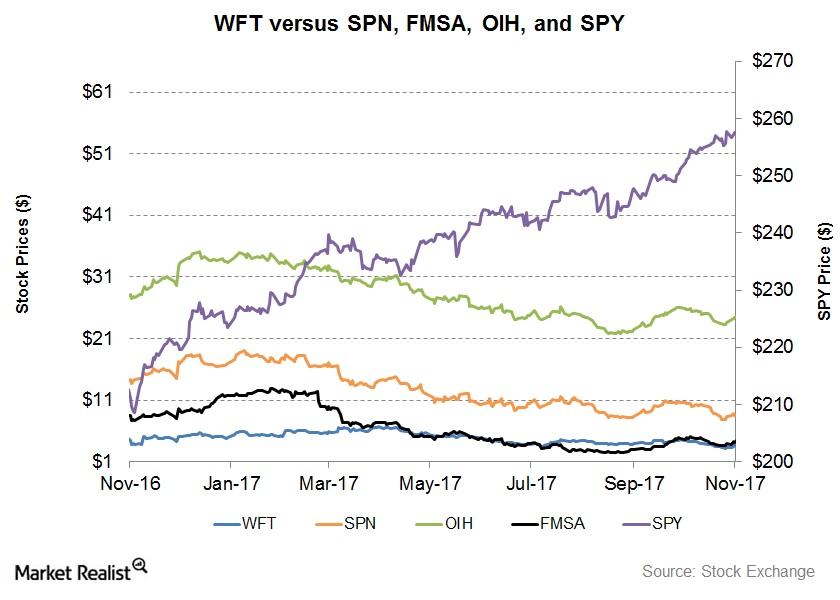
WFT, FMSA, and SPN: Returns and Outlook after 3Q17
WFT, SPN, and FMSA have significantly underperformed the SPDR S&P 500 ETF (SPY), which has produced 23.0% returns since November 3, 2016.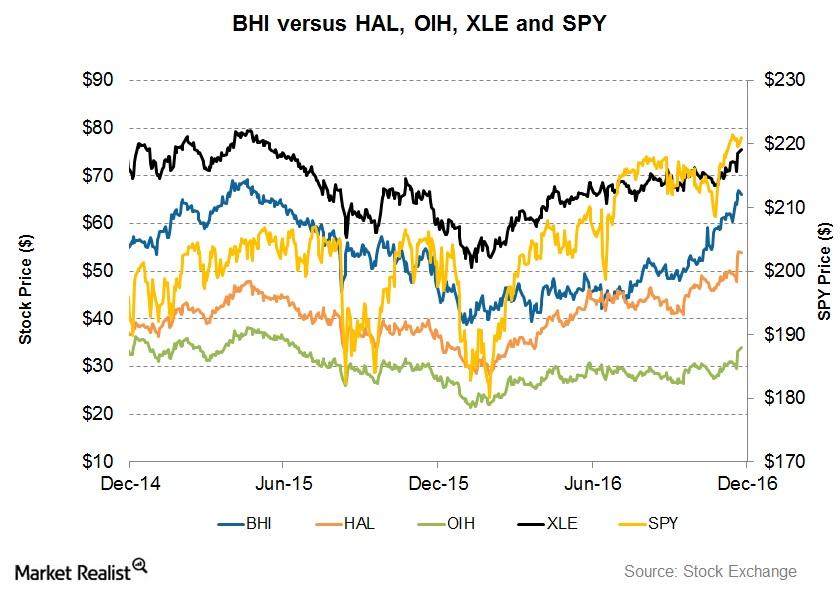
Will a Partnership with GE Improve BHI’s Returns?
Between December 2014 and December 2016, Baker Hughes (BHI) stock hit its peak in April 2015. It troughed at ~$39 in January 2016.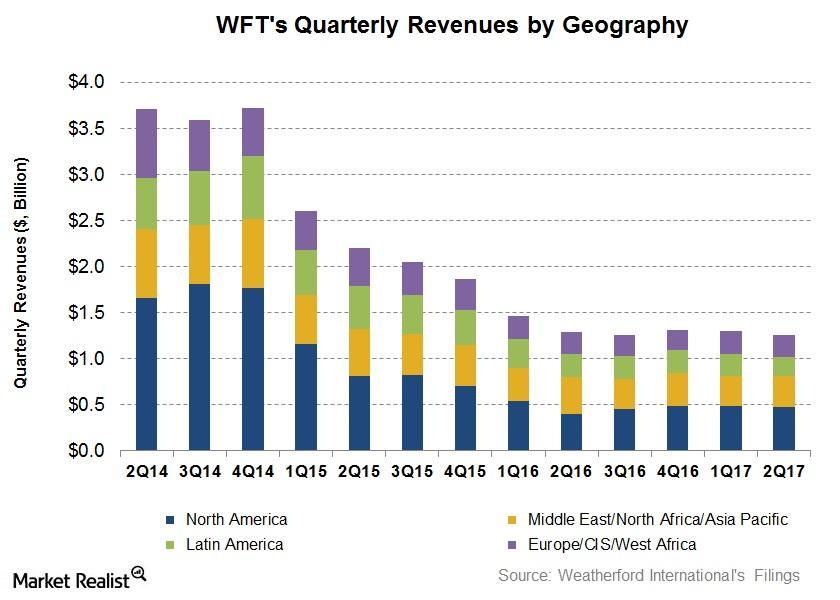
Weatherford International’s Value Drivers in 2Q17
Revenues from Weatherford International’s (WFT) Latin American region fell the most by 18.5% from 2Q16 to 2Q17.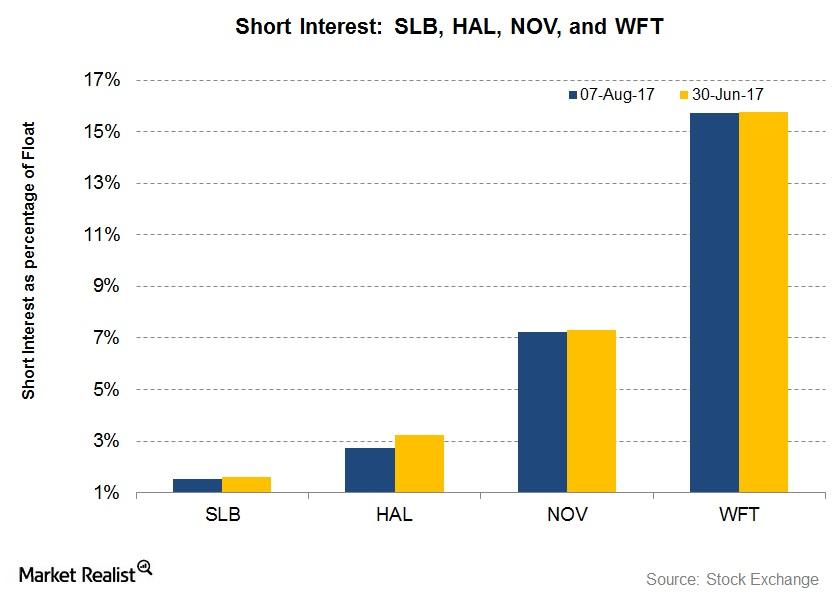
Short Interest in SLB, HAL, WFT, and NOV after 2Q17
The short interest in Schlumberger (SLB), as a percentage of its float, is 1.5% as of August 7, 2017—compared to 1.6% as of June 30, 2017.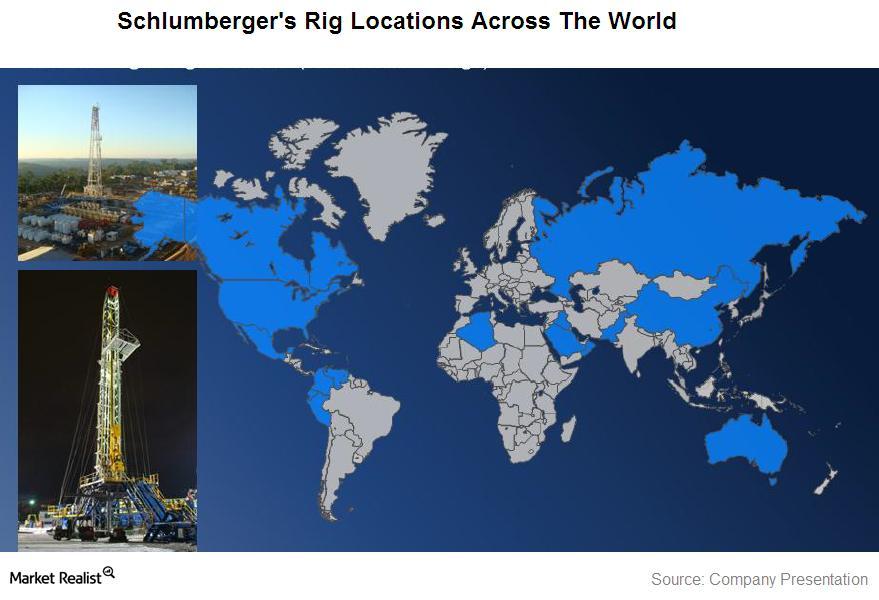
A quick overview of oil and gas field services biz Schlumberger
Schlumberger Limited is a Houston-based energy company. It provides technology, integrated project management, and information solutions to oil and gas exploration and production (or E&P) companies around the world.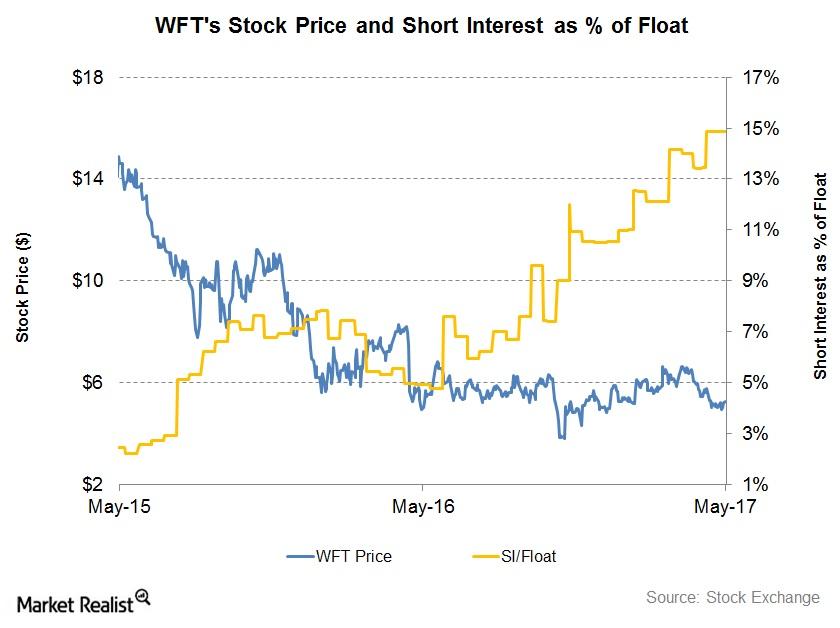
What Short Interest in Weatherford Indicates
Weatherford International’s (WFT) short interest as a percentage of its float was 14.9% as of May 22, 2017, compared to ~14% as of March 31, 2017.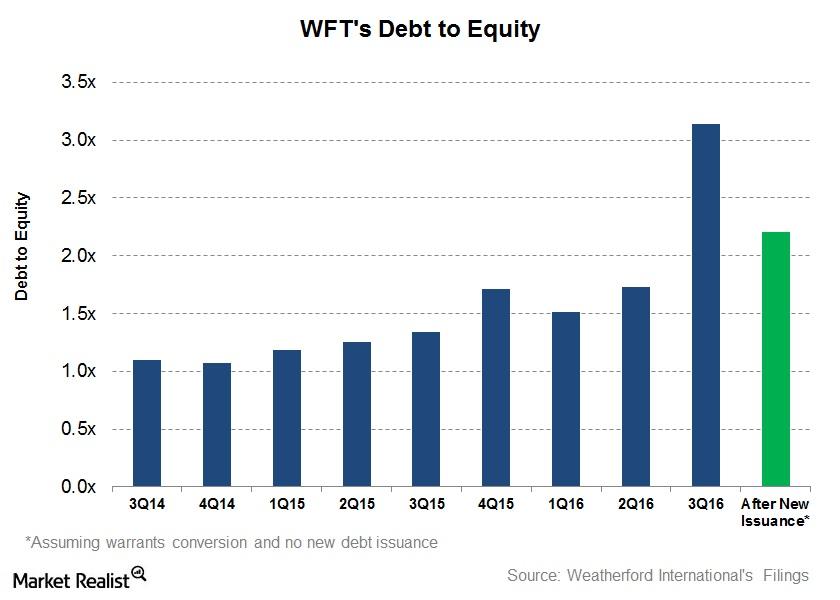
Weatherford International Issues Stocks Again
On November 16, Weatherford International (WFT), an oilfield equipment and services company, disclosed that it issued 84.5 million ordinary stocks.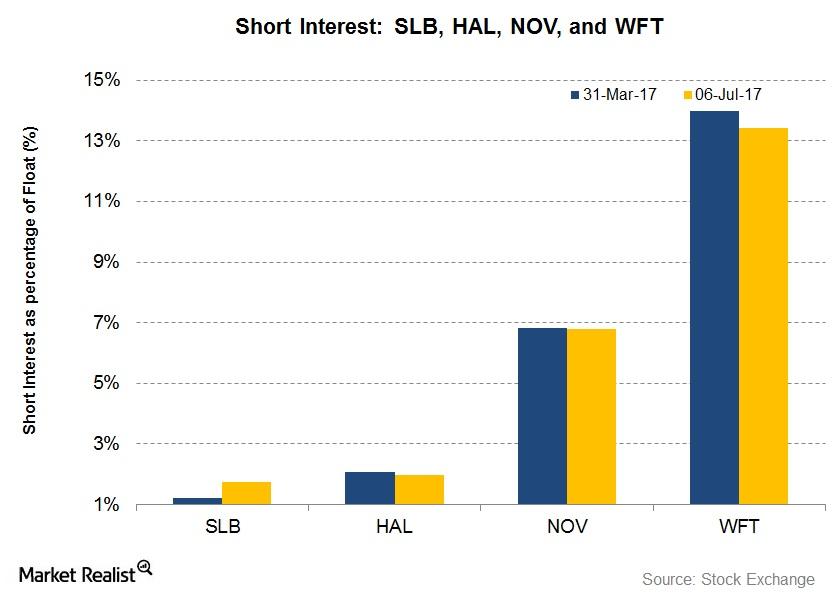
What’s the Short Interest in Large OFS Companies on July 6?
Short interest in Schlumberger (SLB) as a percentage of its float is 1.2% as of July 6, 2017, compared to 1.2% as of March 31, 2017.
What Could Drive Schlumberger’s Performance in 1Q17 and Beyond?
Schlumberger’s (SLB) Drilling segment witnessed the highest revenue fall of 32% in 4Q16 compared to 3Q16.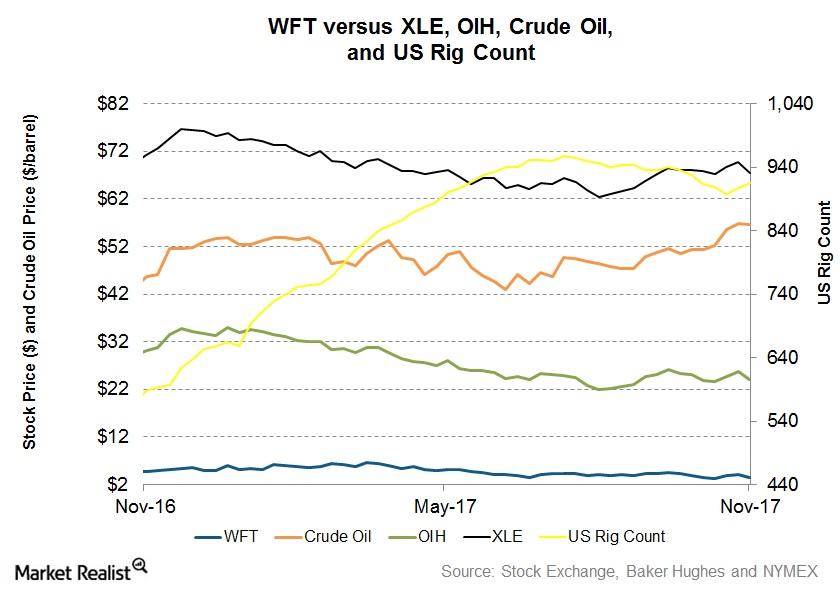
How Weatherford Stock Moved in the Week Ended November 17
Weatherford International (WFT) stock fell 16.0% in the week ended November 17, 2017. The VanEck Vectors Oil Services ETF (OIH) generated a return of -6.0% during this period.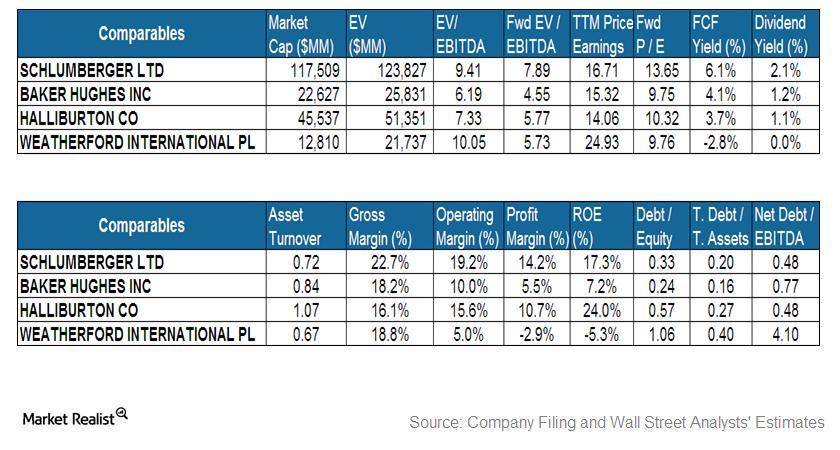
Must-read comparison: Schlumberger and its peers
Schlumberger’s yearly price-to-earnings ratio is in line with the group. Haliburton has the lowest price-to-earnings ratio.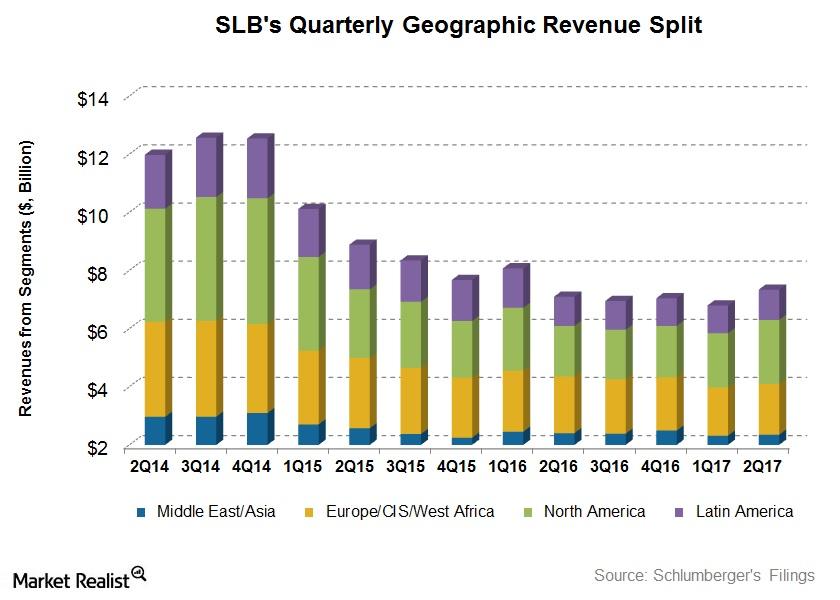
What Were Schlumberger’s Drivers in 2Q17?
In 2Q17, Schlumberger reported a net loss of ~$74 million—a sharp improvement compared to 2Q16 when it reported a net loss of $2.16 billion.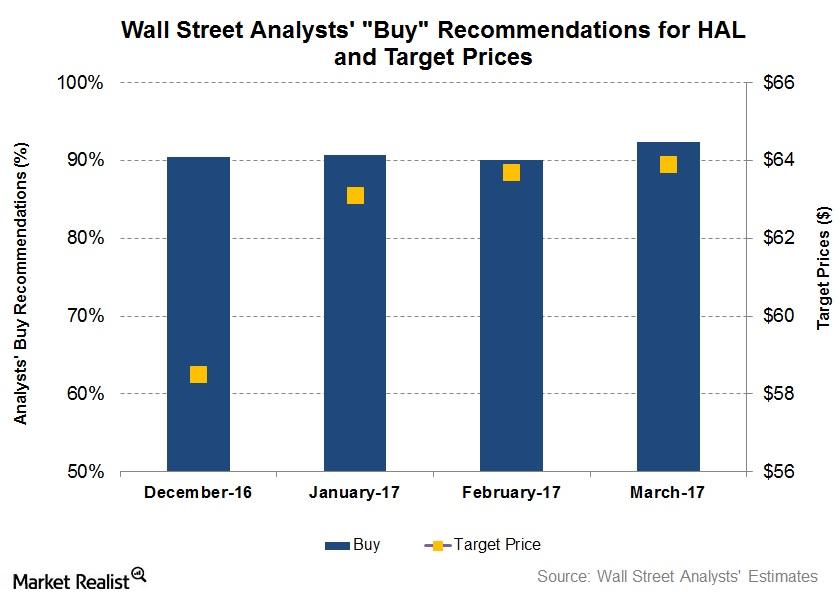
What Do Analysts Recommend for Halliburton?
On March 24, 92% of the analysts tracking Halliburton rated it as a “buy,” ~5% rated it as a “hold,” and 3% rated it as a “sell.”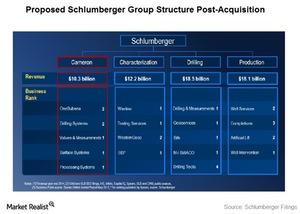
Schlumberger and Cameron International: a Complementary Team
Schlumberger and Cameron are contemplating a merger because their drilling and production systems would be integrated from “pore to pipeline.”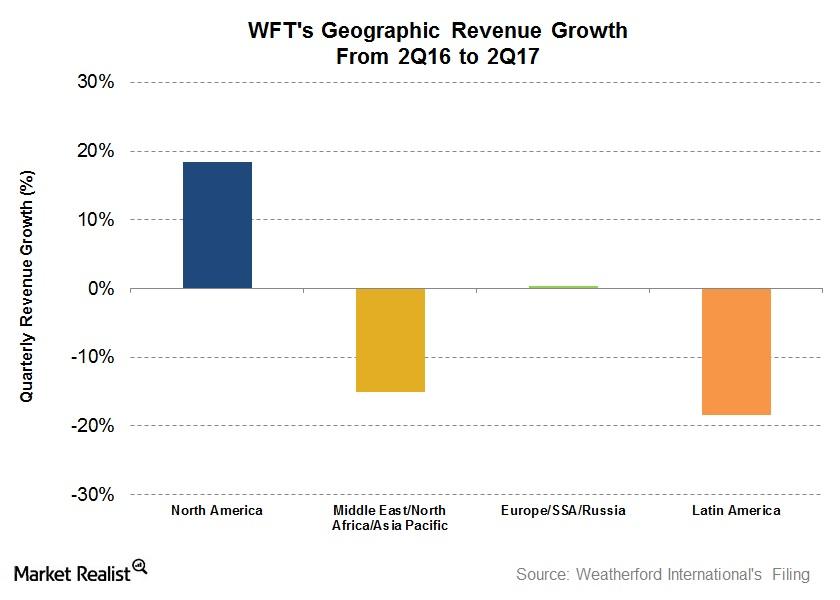
Analyzing Weatherford International’s 2Q17 Performance
In 1H17, Weatherford’s revenues fell 8%—compared to 1H16. It managed to lower its net losses significantly during this period.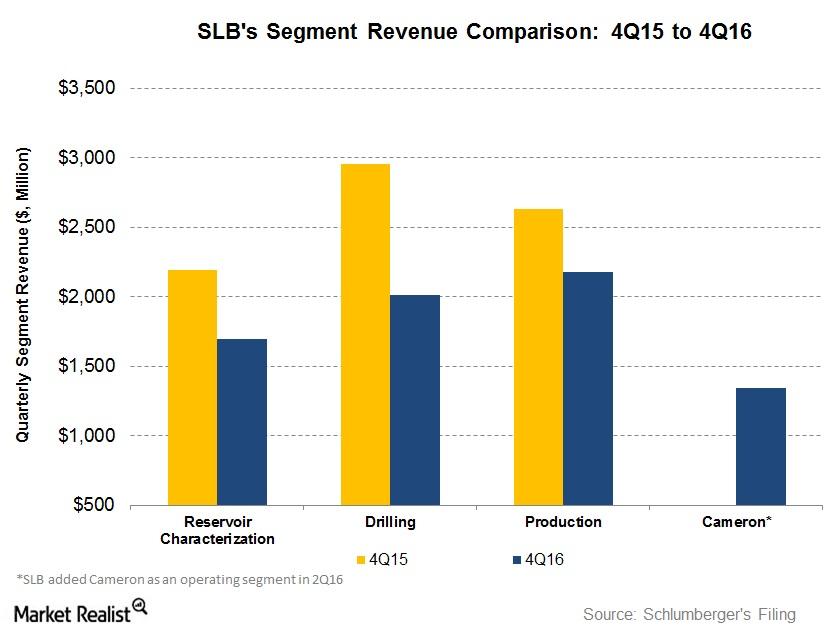
Analyzing the Factors Affecting Schlumberger’s Revenue
Schlumberger’s Drilling segment witnessed the highest revenue fall at 32% in 4Q16 compared to 4Q15. The segment was followed by the Reservoir Characterization and Production segments.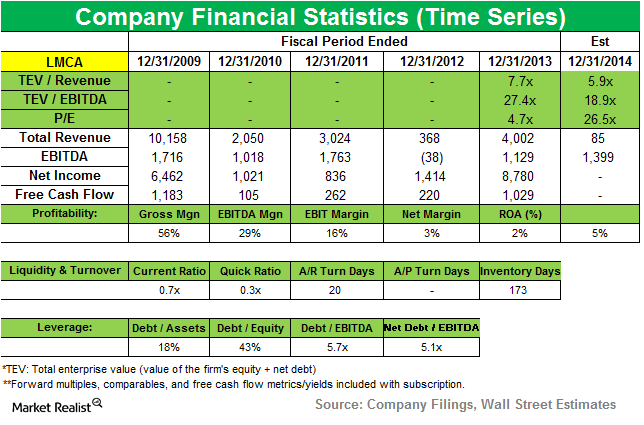
CalPERS adds new position in Liberty Media
Liberty Media Corporation owns interests in a range of communications and entertainment businesses. Recently, the company completed the previously announced spin-off of its cable business, Liberty Broadband.
Why Weatherford’s 1Q18 Earnings Beat Estimates
Weatherford International released its 1Q18 earnings results today.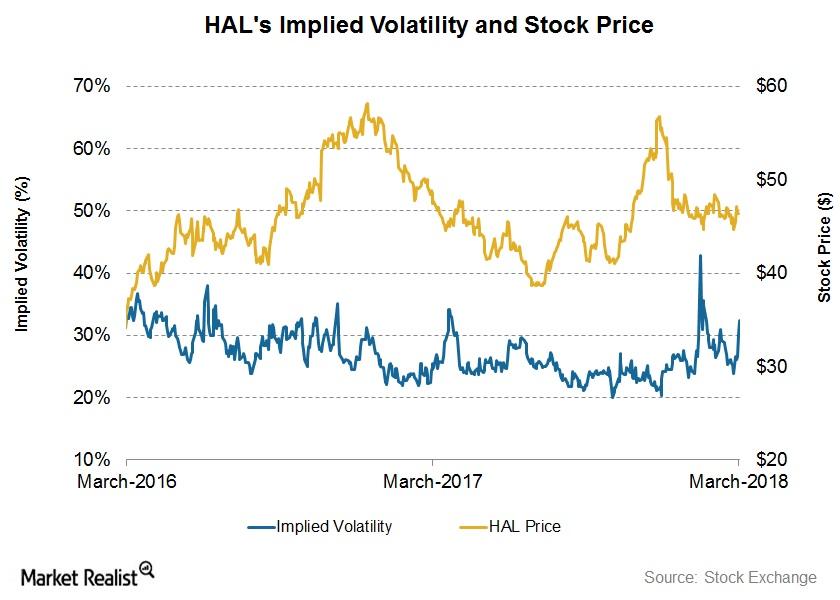
Halliburton’s Next 7-Day Stock Price Forecast
Halliburton stock will likely close between $48.52 and $44.36 in the next seven days—based on its implied volatility.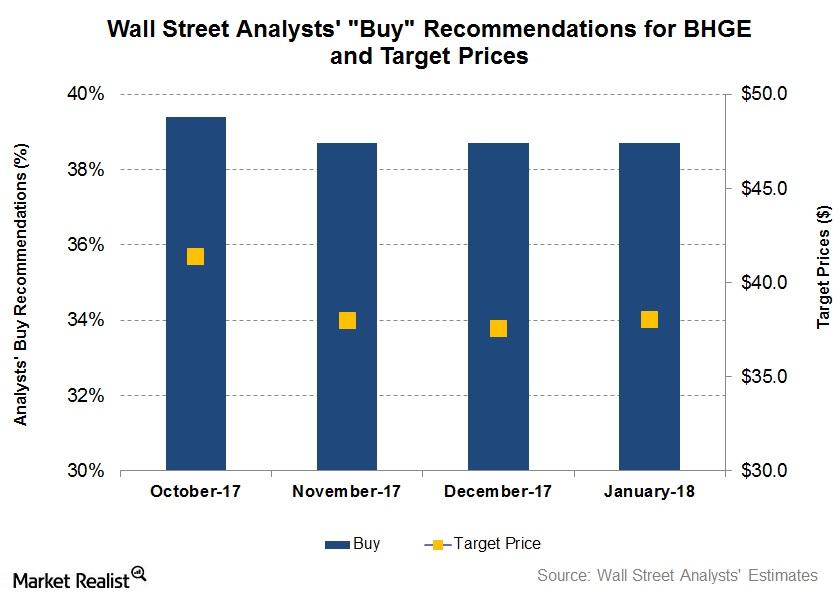
Wall Street’s Forecasts for Baker Hughes after Its 4Q17 Earnings
In this article, we’ll look at Wall Street analysts’ forecasts for shares of Baker Hughes, a GE company (BHGE) following its 4Q17 earnings release.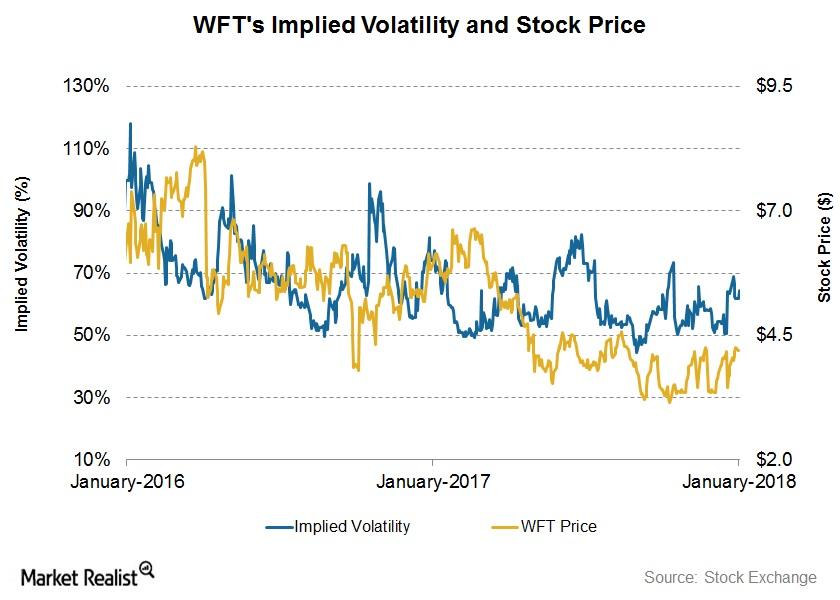
Weatherford’s Stock Price Forecast
On January 16, Weatherford International’s (WFT) implied volatility (or IV) was ~64%. Its 3Q17 earnings were announced on November 1, 2017. Since then, its implied volatility has increased from 54% to the current level.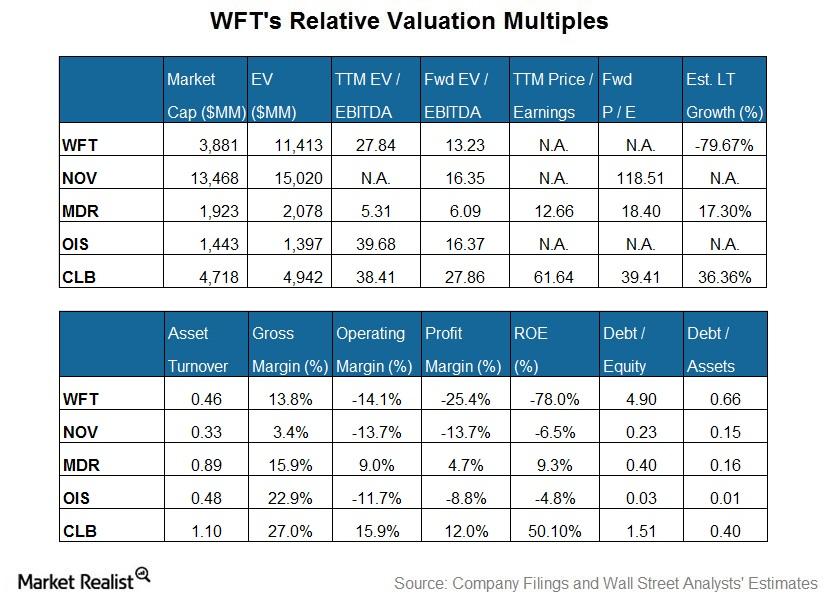
Weatherford International’s Valuation Compared to Its Peers
Weatherford International’s (WFT) EV (enterprise value) when scaled by a trailing 12-month adjusted EBITDA is close to the peer average in our group.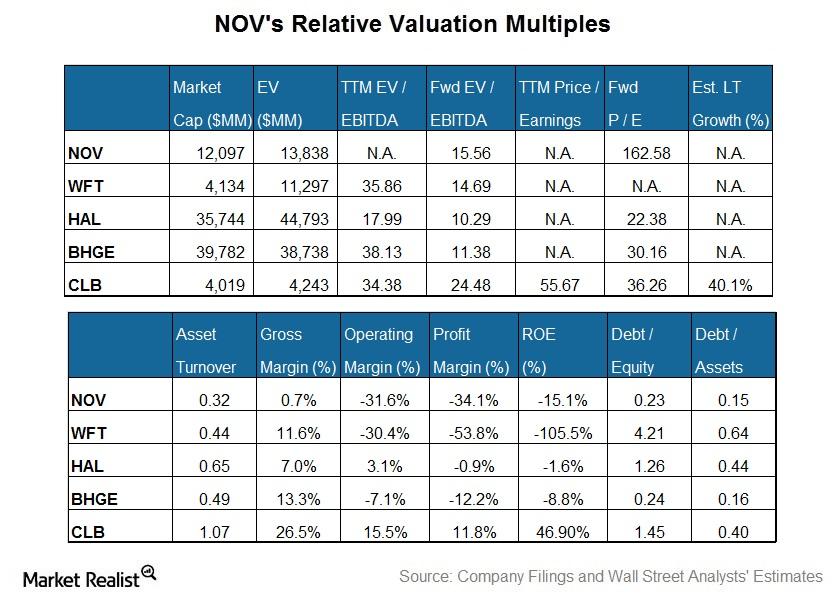
National Oilwell Varco’s Valuation Compared to Its Peers
National Oilwell’s valuation, expressed as the TTM PE (price-to-earnings) multiple, isn’t available due to its negative adjusted earnings.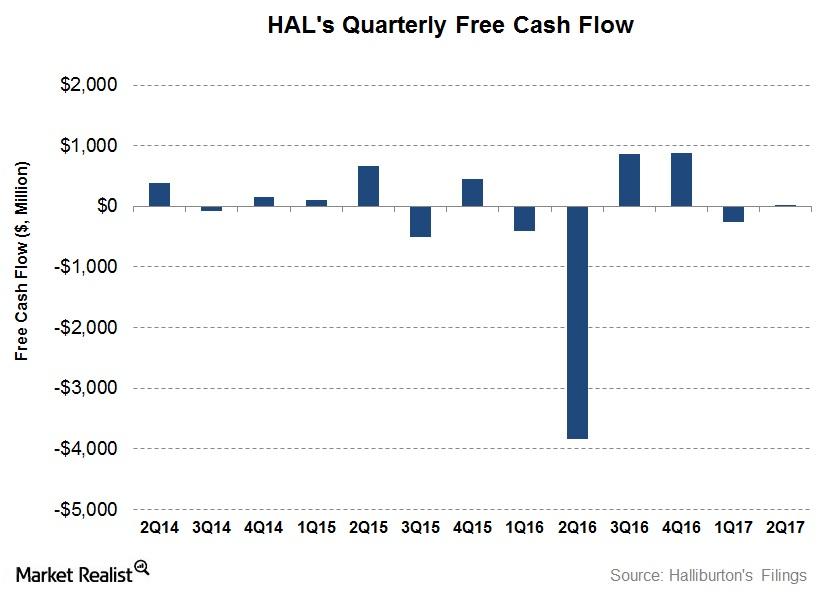
Behind Halliburton’s Free Cash Flow, Capex, and Acquisition Strategies
Halliburton’s (HAL) CFO (cash from operating activities) in 2Q17 showed a remarkable improvement over 2Q16. HAL’s CFO was a $346 million in 2Q17.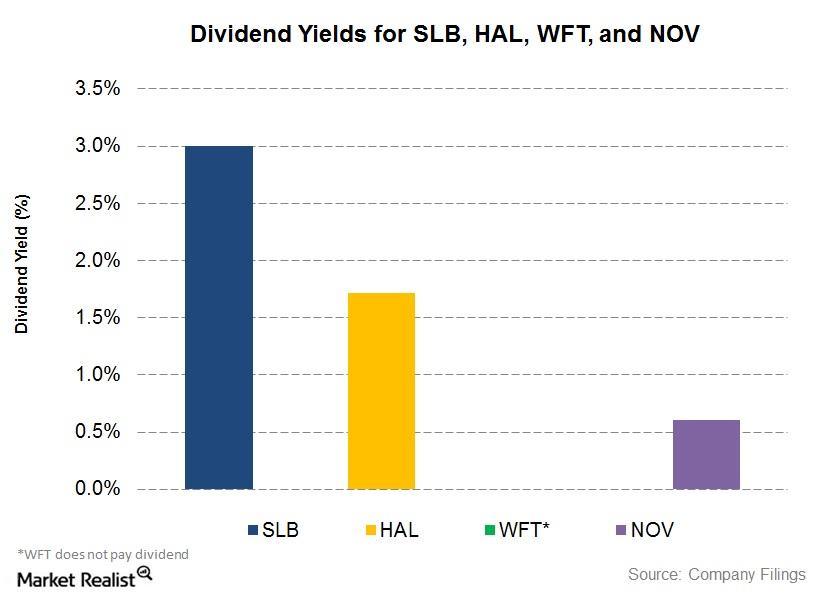
Dividend Yield in 2Q17: Comparing SLB, HAL, and NOV
Schlumberger’s (SLB) quarterly dividend per share remained unchanged from 2Q16 to 2Q17. In 2Q17, Schlumberger’s quarterly DPS is $0.50.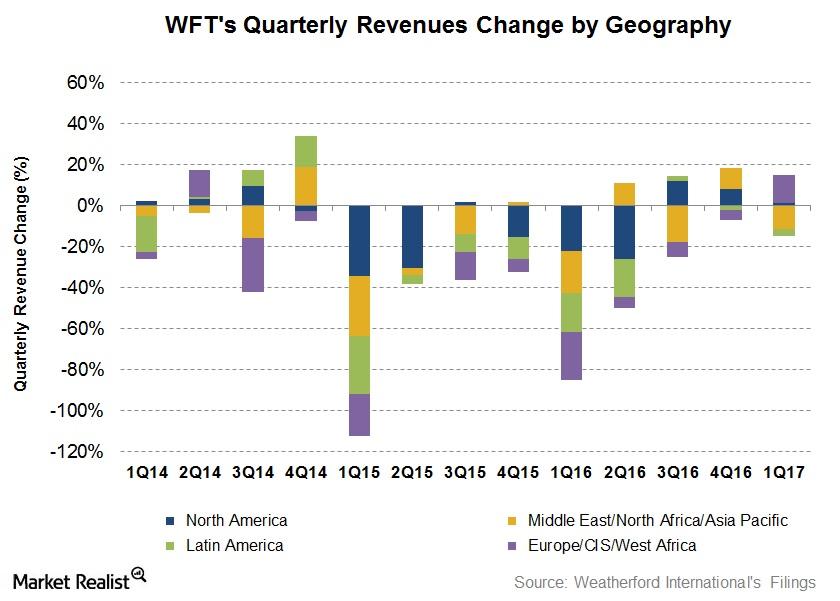
What Are Weatherford International’s Growth Drivers in 1Q17?
In 1Q17, Weatherford International’s net loss was $443 million.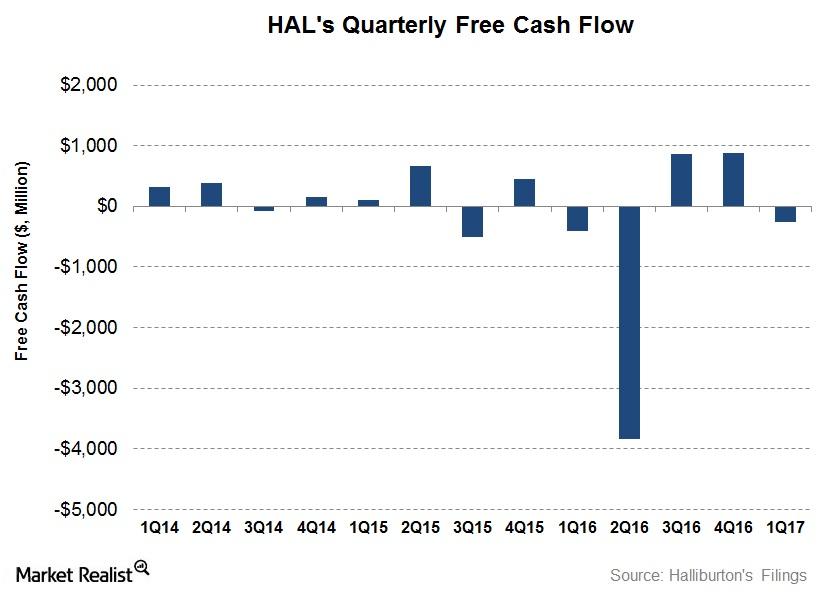
Analyzing Halliburton’s Free Cash Flow and Capex Plans
Halliburton’s cash from operating activities (or CFO) in 1Q17 was an improvement over 1Q16, although it was a steep deterioration compared to 4Q16.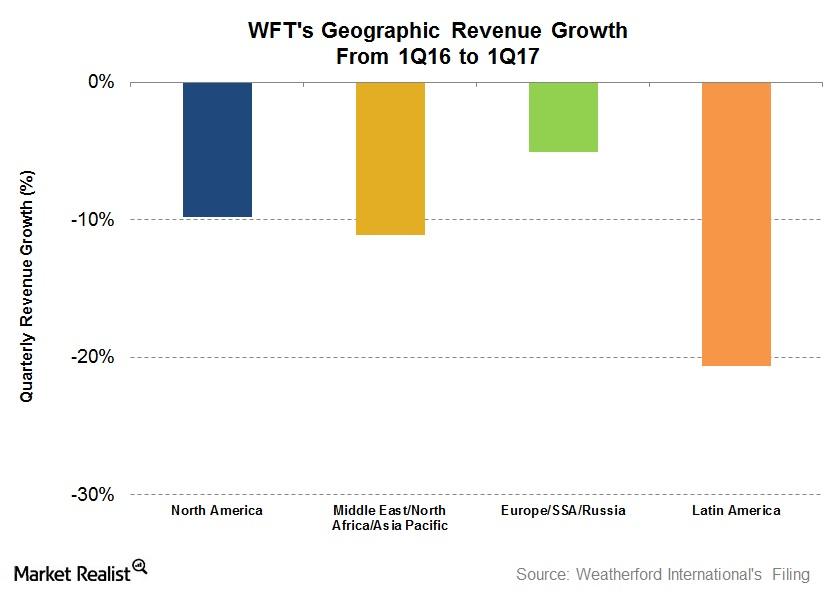
What Impacted Weatherford’s 1Q17 Performance?
Weatherford’s North America region’s 1Q17 operating loss improved to $18 million—compared its operating loss of $128 million last year.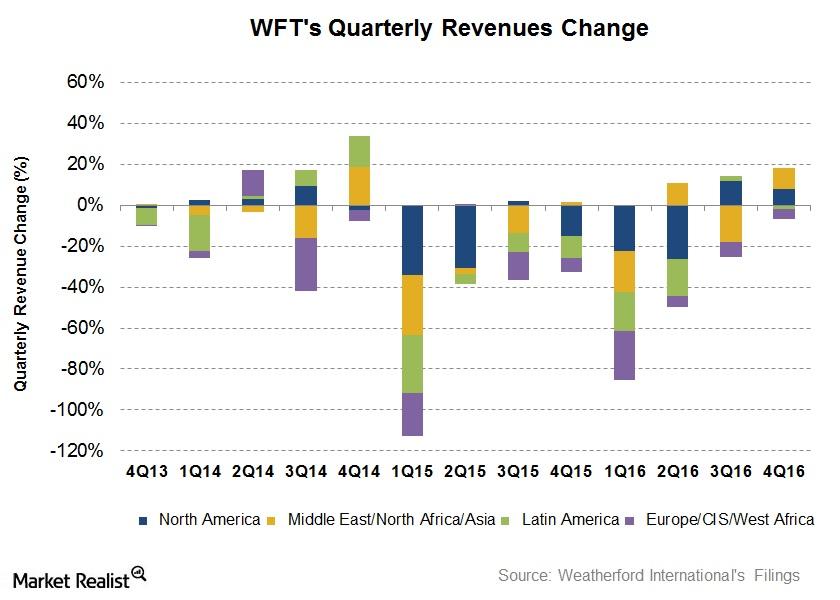
Analyzing Weatherford International’s Growth Drivers in 4Q16
Revenues from Weatherford International’s (WFT) Europe/Sub Saharan Africa/Russia region fell the most with a 36.5% fall from 4Q15 to 4Q16.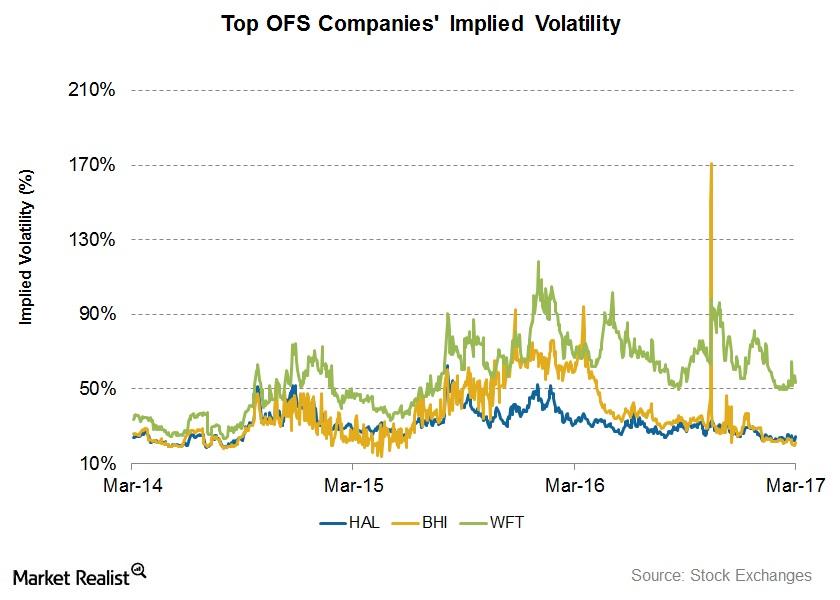
How Volatile Are the Top Oilfield Services Companies?
In this part of the series, we’ll compare the implied volatilities of the top OFS companies as rated by Wall Street analysts for 1Q17.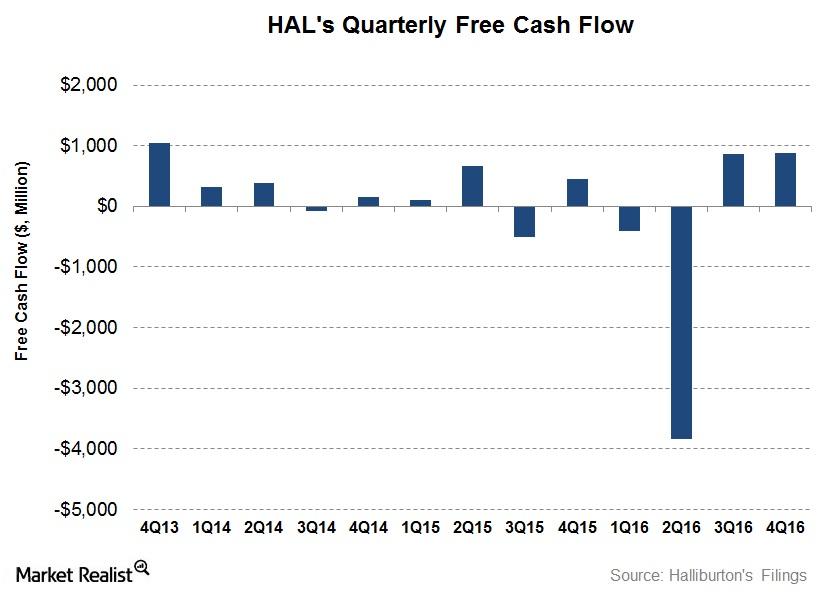
Analyzing Halliburton’s Free Cash Flow and Capex Plan
In this article, we’ll analyze how Halliburton’s (HAL) operating cash flows have trended over the past few quarters. We’ll also discuss its free cash flow (or FCF).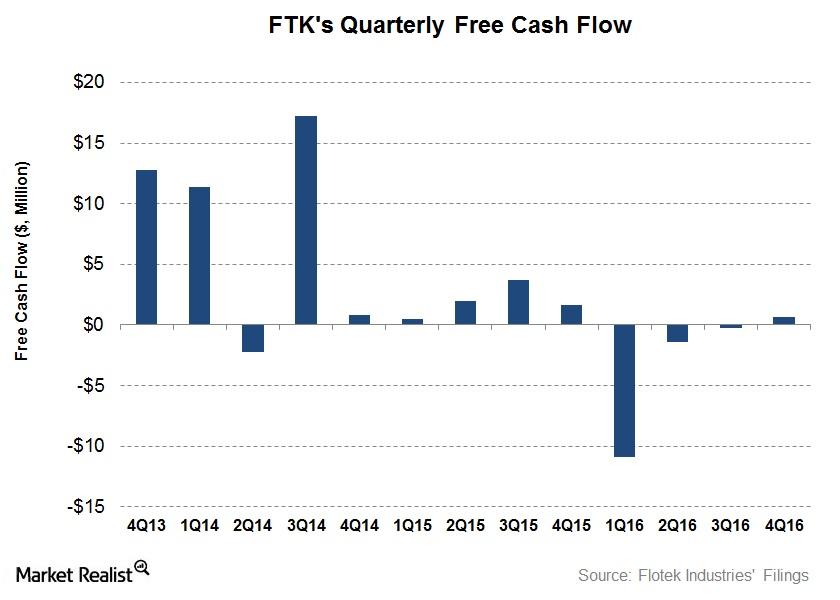
Flotek Industries’ Capex: Impact of a Credit Facility Agreement
In this article, we’ll analyze how Flotek Industries’ (FTK) operating cash flows trended over the past few quarters.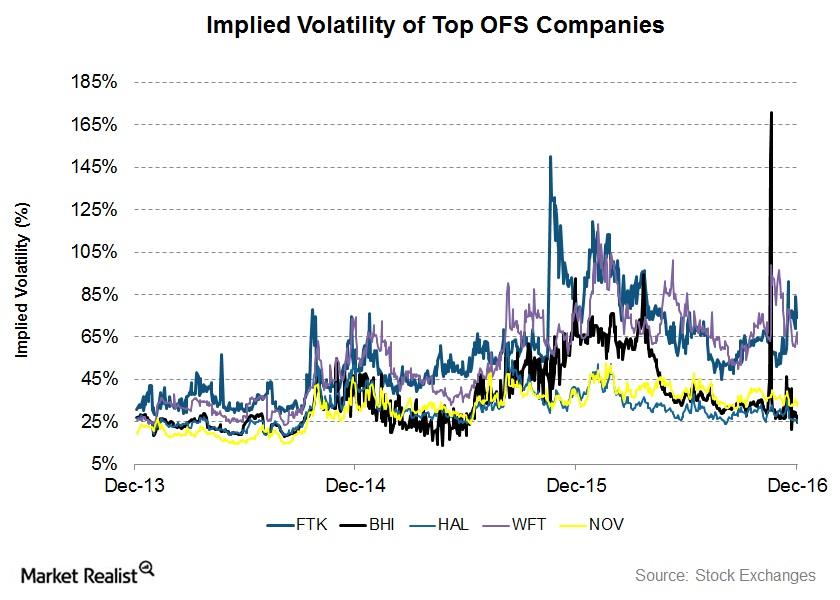
Top Oilfield Service Stocks: Analyzing Implied Volatility
In this article, we’ll compare implied volatility fr the top oilfield services (or OFS) companies, as rated by Wall Street analysts, for 4Q16.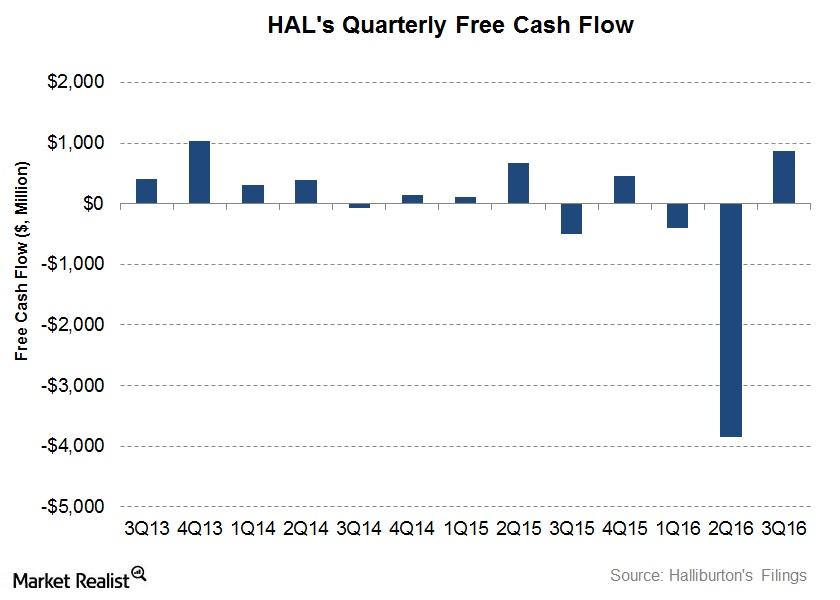
Why Did Halliburton’s Free Cash Flow Improve?
Halliburton’s cash from operating activities (or CFO) turned positive in 3Q16.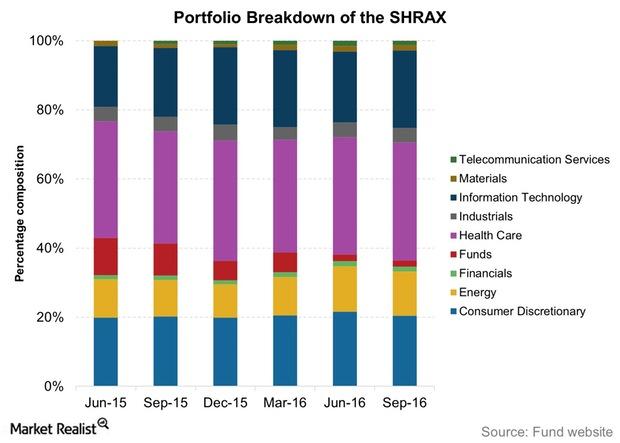
Inside the ClearBridge Aggressive Growth Fund Portfolio
The sectoral breakdown of SHRAX is unlike any other mutual fund in this review, with healthcare as its biggest holding, commanding 35% of the portfolio.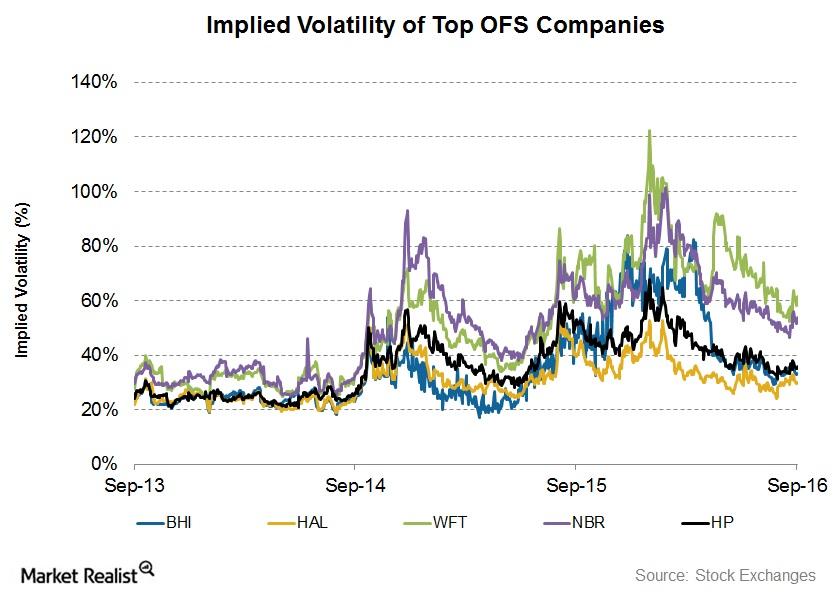
Implied Volatility: Analyzing the Top Oilfield Service Companies
On September 22, Halliburton’s implied volatility was ~28.5%. Since July 20, 2016, its implied volatility rose from ~27% to the current level.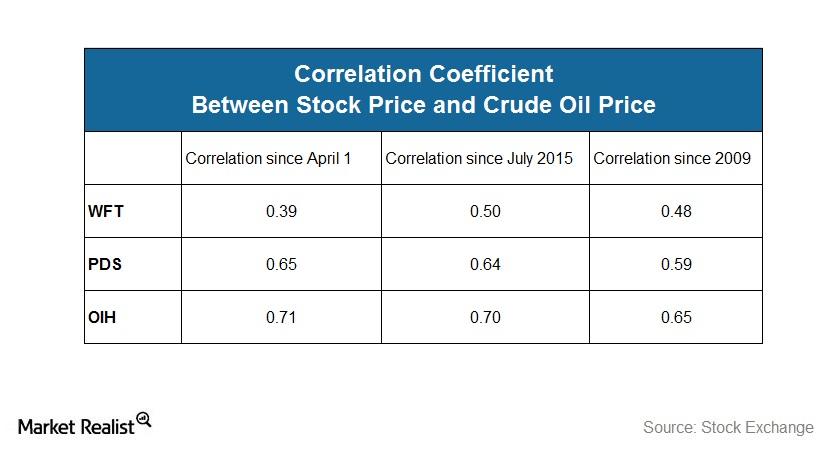
Has WFT’s Correlation with Crude Oil Fallen since 1Q16?
In this article, we’ll analyze the correlation between Weatherford International’s (WFT) stock price and West Texas Intermediate (or WTI) crude oil’s price.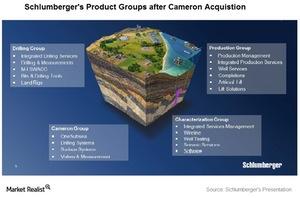
How Business Models Affect SLB’s or WFT’s Performances
In the OFS industry, Schlumberger has clearly been dominant while Weatherford International is now considered one of the weaker names.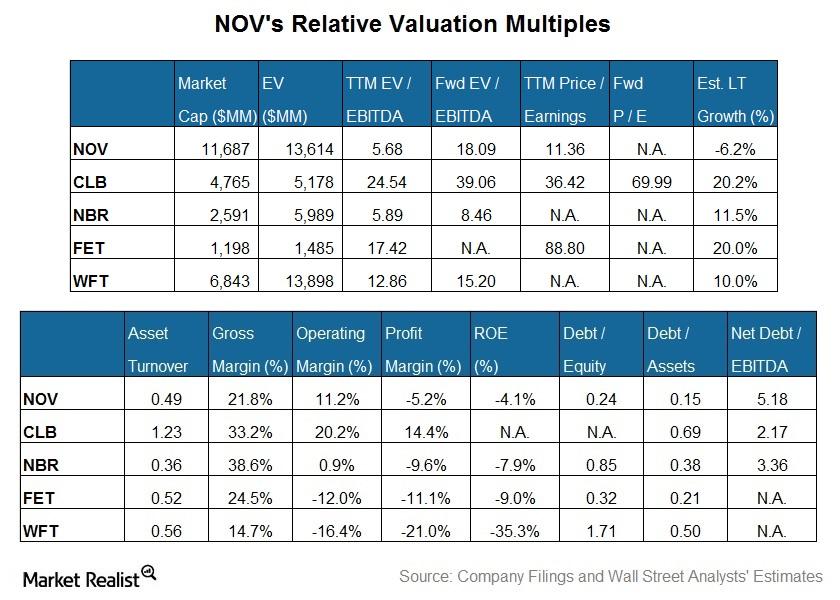
What Is NOV’s Valuation Compared to Its Peers’?
NOV’s enterprise value, when scaled by trailing-12-month adjusted EBITDA, is lower than the peer average.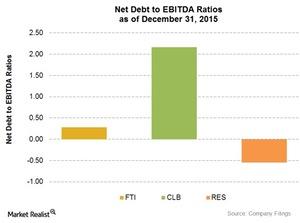
Analyzing the Net-Debt-to-EBITDA Ratios of 4 Major Mid-Cap OFS Companies
In fiscal 2015, RPC’s (RES) net-debt-to-EBITDA ratio stood at -0.54, down from the 0.34 it saw in 2014. The company’s long-term debt stood at zero in 2015.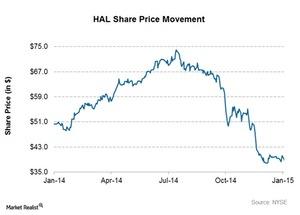
Must-know: An overview of Halliburton
Halliburton (HAL) is a Texas-based energy company. It’s an oil and gas equipment and service provider. In the past year, Halliburton’s stock price went down ~22%.