BTC iShares U.S. Oil & Gas Exploration & Production ETF
Latest BTC iShares U.S. Oil & Gas Exploration & Production ETF News and Updates
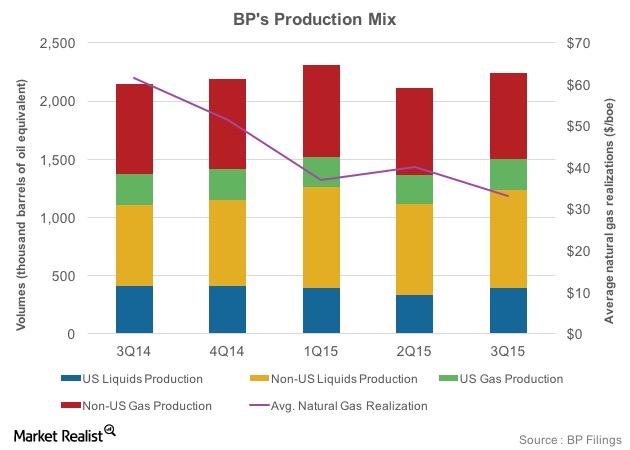
BP’s Upstream Segment: Large Upcoming Gas Projects
BP has a strong pipeline of projects in its upstream portfolio. These projects are expected to result in 800,000 barrels per day of new production by 2020.
Oil’s Contango: Supply–Demand Fears Could Impact the Market
On October 3, 2017, US crude oil (USL) (OIIL) November 2018 futures settled $0.33 higher than the November 2017 futures.
Brent-WTI Spread: Will US Oil Exports Rise Further?
On October 24, 2017, Brent crude oil (BNO) active futures were $5.86 above WTI crude oil active futures.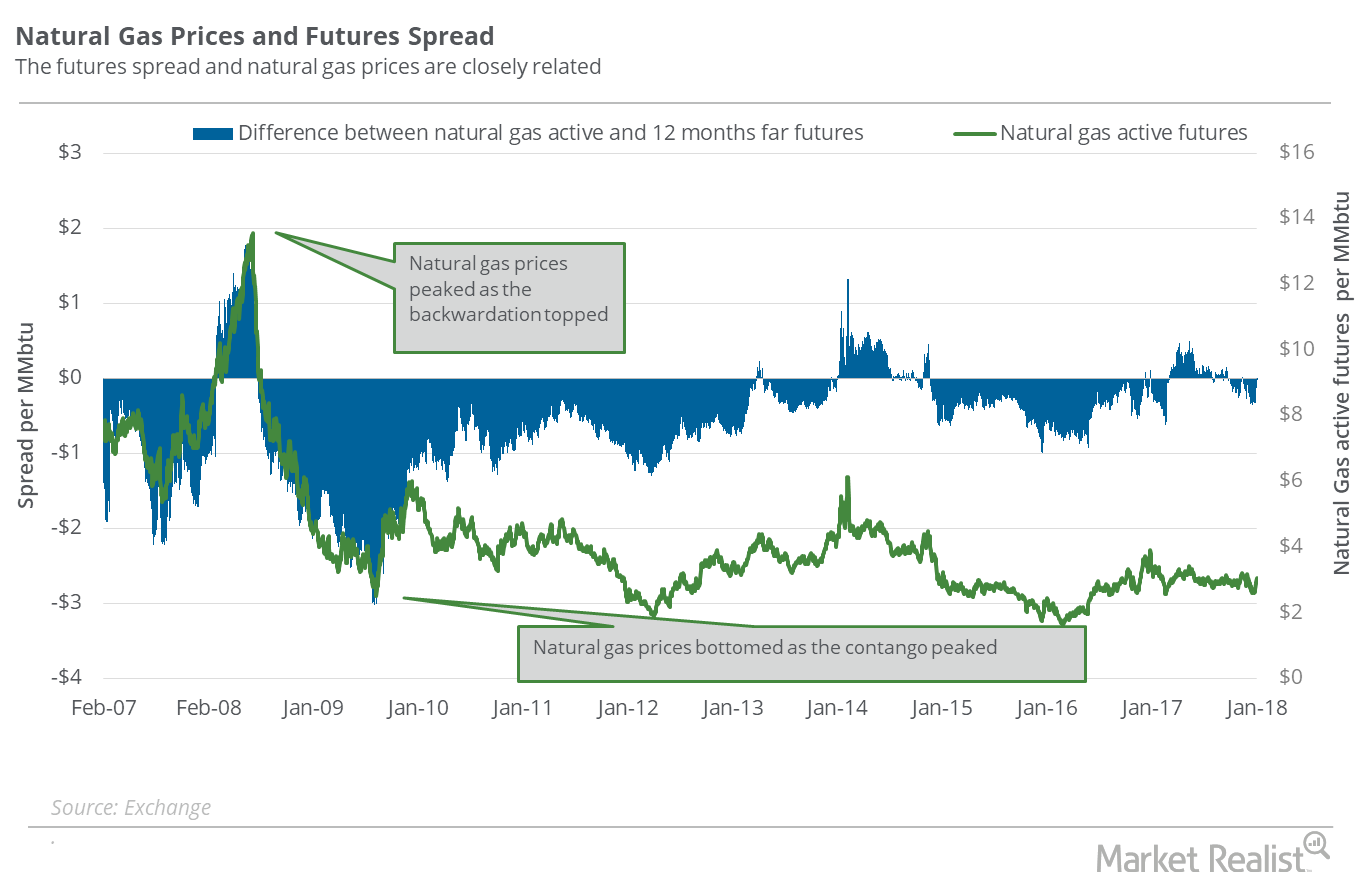
Natural Gas: Are Winter Demand Fears Rising?
On January 2, 2018, natural gas (UNG) (BOIL) (FCG) February 2018 futures settled $0.025 less than February 2019 futures.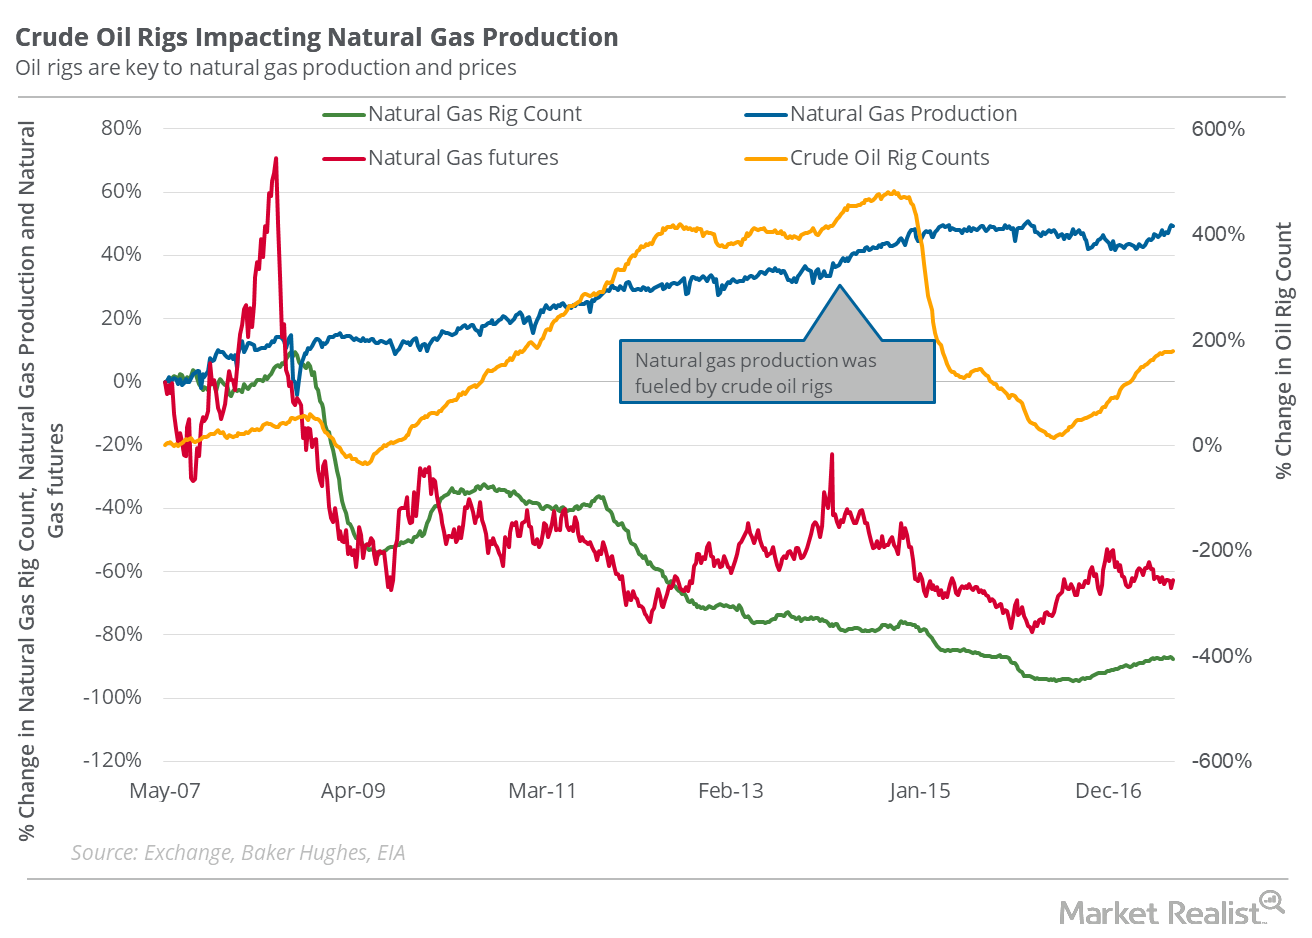
Behind the Natural Gas Rig Count: Will Production Rise?
The natural gas rig count rose by four to 187 in the week ended September 8, 2017. On a YoY basis, the natural gas rig count more than doubled that week.
Why the Brent-WTI Spread Could Make Global Oil Supplies Rise
On October 17, 2017, Brent crude oil (BNO) active futures closed $6 above the WTI (West Texas Intermediate) crude oil futures.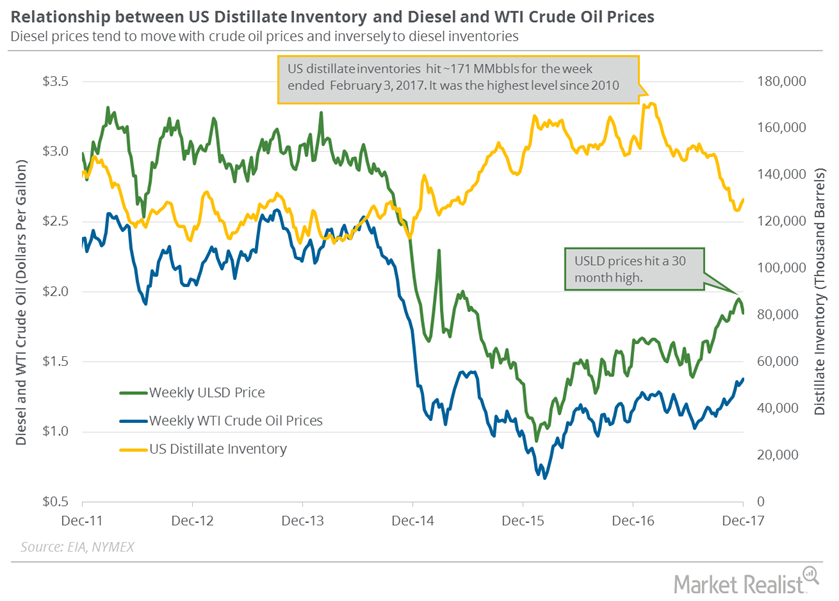
Are US Distillate Inventories Bearish for Oil Prices?
US distillate inventories rose by 1,667,000 barrels or 1.3% to 129.4 MMbbls (million barrels) on November 24–December 1, 2017.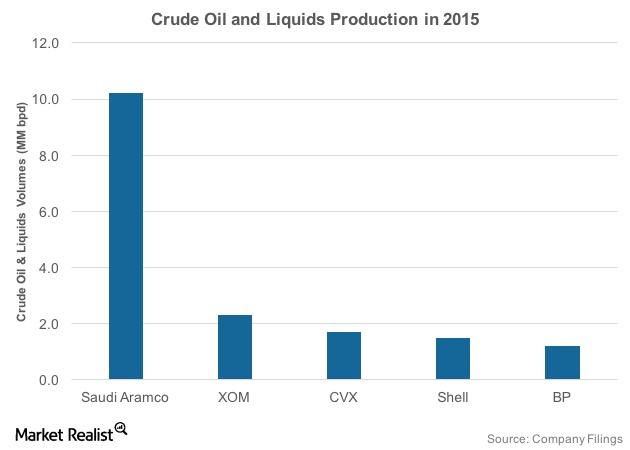
How Does Saudi Aramco’s Production Compare to Its Peers?
Saudi Aramco’s production accounted for 27% of OPEC’s average production in 2015. After Saudi Arabia, Iraq and Iran have the highest production in OPEC.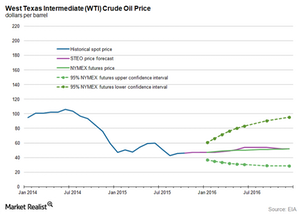
Crude Oil Bear Market: Worst Case Scenarios for 2016
Goldman Sachs (GS) suggests crude oil prices could test $20 per barrel in a worst case scenario in 2016.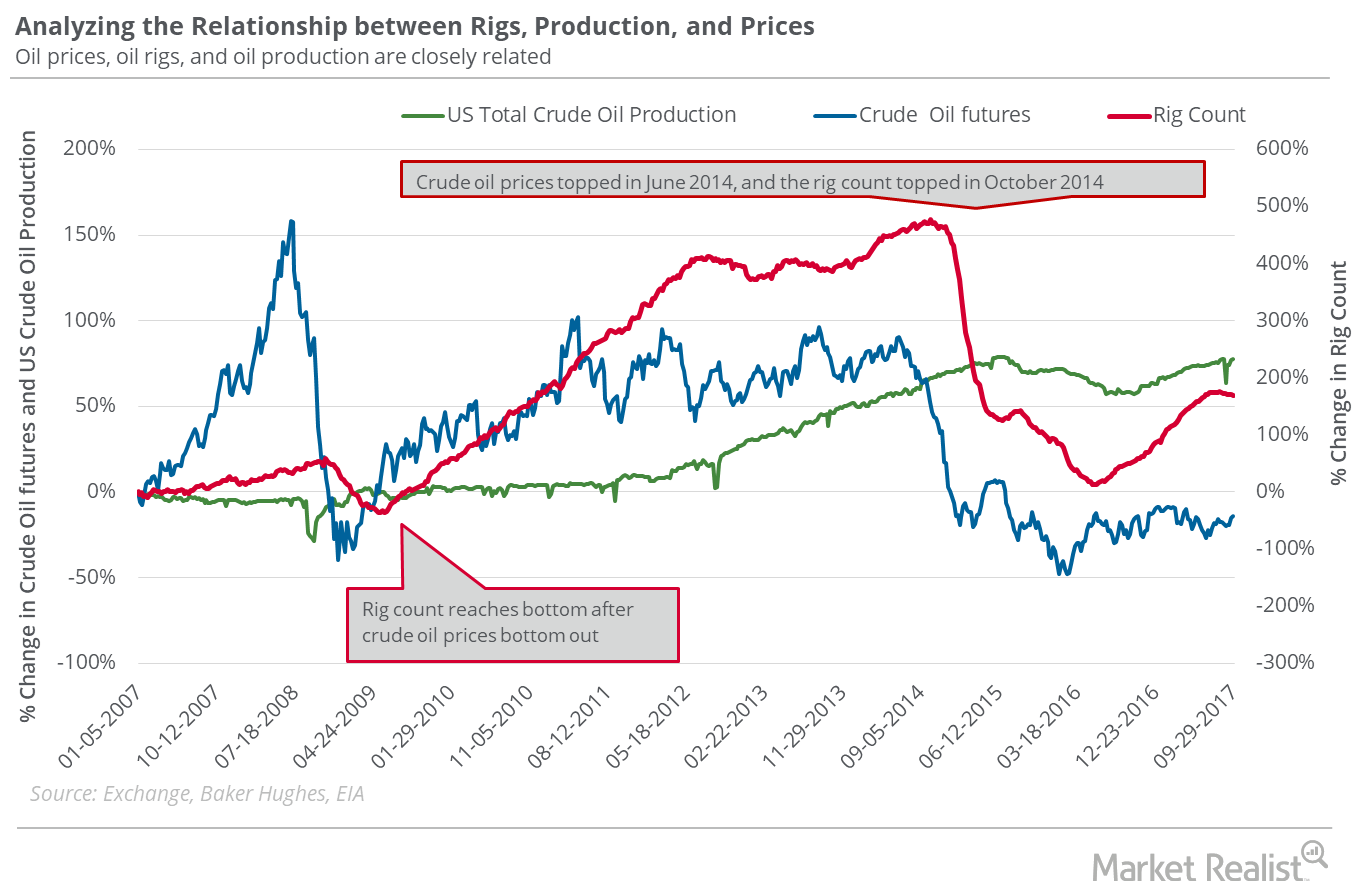
Futures Spread: Does It Signal End of Oil’s Oversupply Concern?
On October 17, 2017, US crude oil (USO) (OIIL) December 2018 futures traded $0.46 below the December 2017 futures.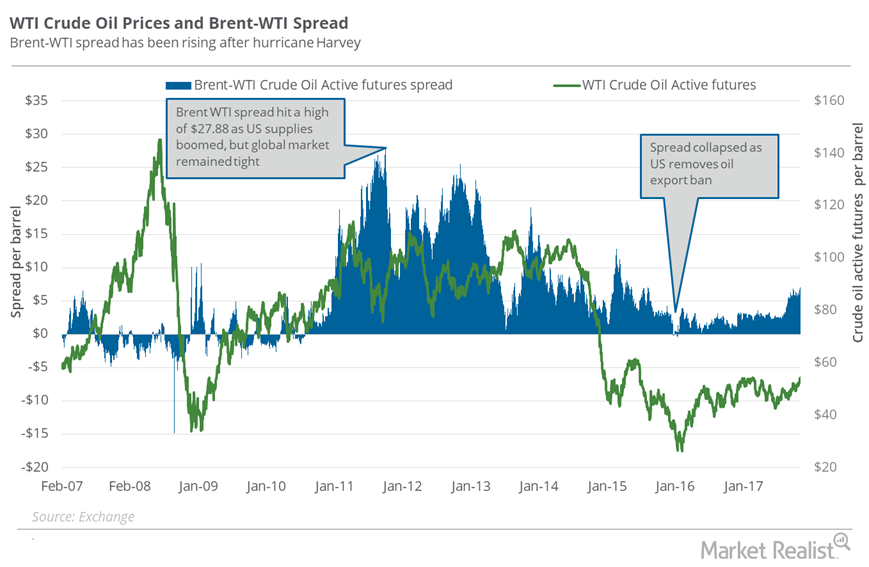
US Crude Oil Exports Could Be at a Tipping Point
On October 31, 2017, Brent crude oil (BNO) active futures were ~$7 above US crude oil (UCO) futures.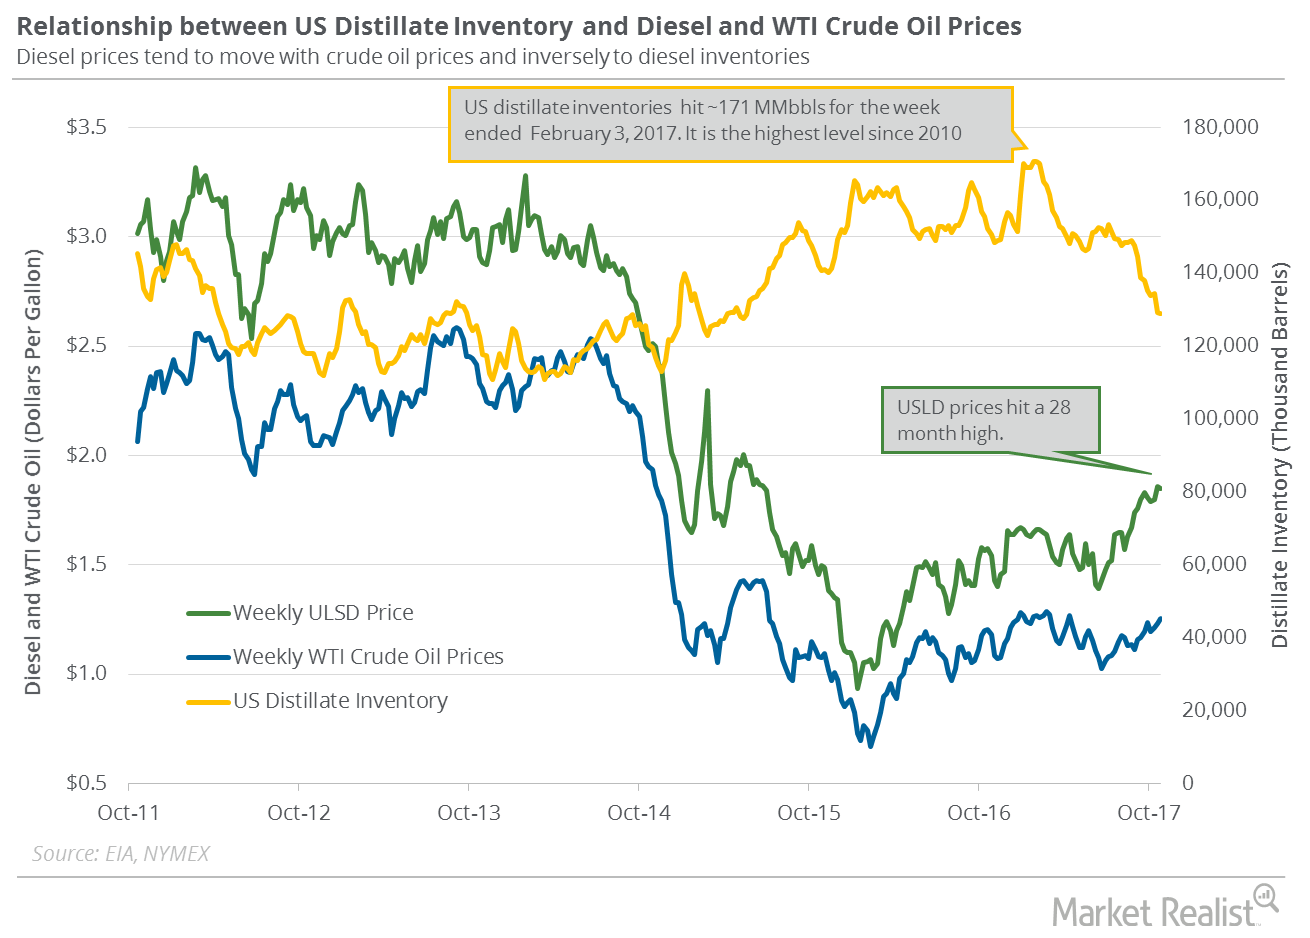
US Distillate Inventories Are near a 3-Year Low
US distillate inventories fell by 302,000 barrels to 128.9 MMbbls (million barrels) on October 20–27, 2017. It’s the lowest level since April 10, 2015.
US Natural Gas Consumption Could Help the Prices
US natural gas consumption fell 0.17% to 57.1 Bcf/d (billion cubic feet per day) on October 12–18, 2017. It rose 3.1% from the same period in 2016.
US Crude Oil Exports: Will They Affect OPEC’s Production Cut Deal?
On November 7, 2017, the difference between Brent crude oil (BNO) active futures and US crude oil (USO) active futures, or the Brent-WTI (West Texas Intermediate) spread, was $6.50.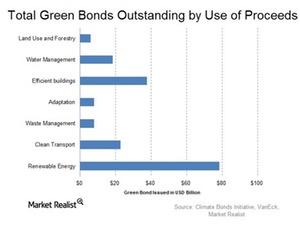
Can Government Incentives Boost Green Bond Growth?
In order for the green bond market to expand further, government roles are vital.
Natural Gas Market Could Be Pricing In a Supply Deficit
On January 16, 2018, the gap between natural gas’s February 2018 futures and February 2019 futures was $0.07, or the futures spread.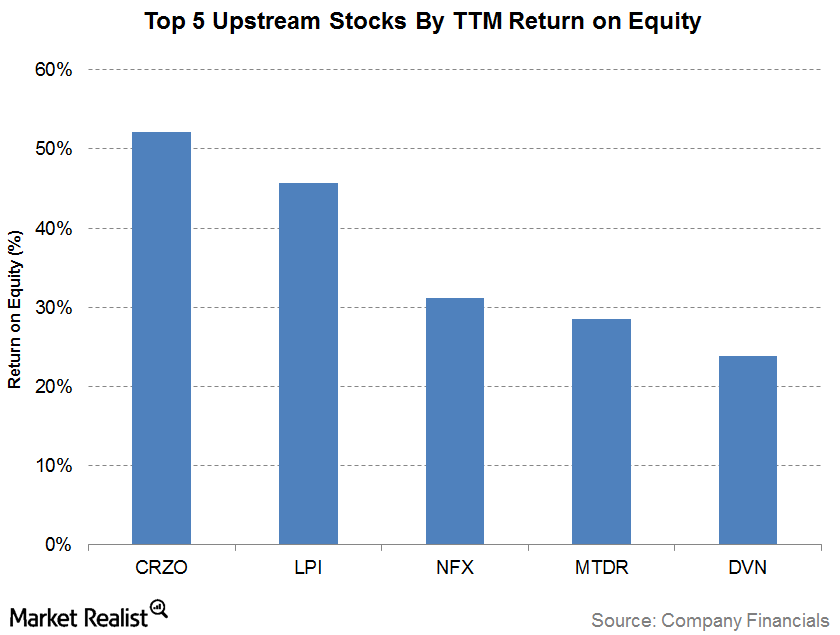
The Top 5 Upstream Companies Based on Return on Equity
The company with the highest trailing 12-month ROE (return on equity) as of 3Q17 is Carrizo Oil & Gas (CRZO) with an ROE of 52.1%.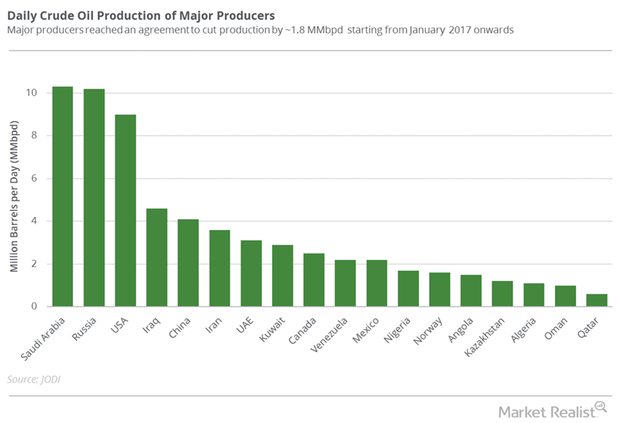
Crude Oil Prices Are Positive before OPEC’s Meeting
US crude oil futures for January delivery rose 0.3% to $57.47 per barrel at 1:10 AM EST on November 30, 2017. Prices rose ahead of OPEC’s meeting.
Are Oversupply Concerns Gripping Natural Gas Prices?
On November 22, natural gas (UNG)(BOIL) January 2018 futures closed at a discount of ~$0.2 to January 2019 futures.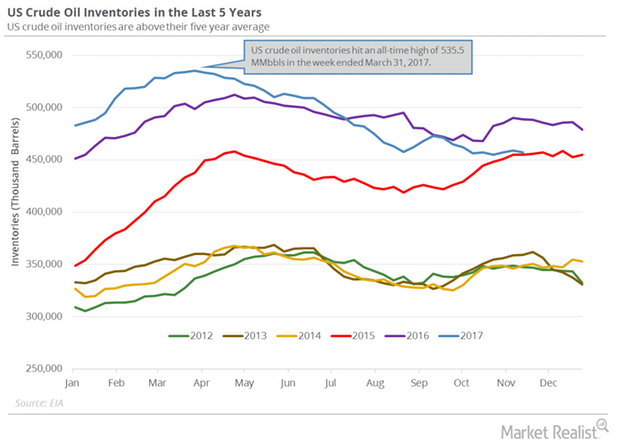
The Relationship between US Crude Oil Inventories and Oil Prices
Estimates for US crude oil inventories The EIA (U.S. Energy Information Administration) released its Weekly Petroleum Status Report on November 22, 2017. It reported that US crude oil inventories fell 1.9 MMbbls (million barrels) to 457.1 MMbbls between November 10 and 17, 2017. Inventories were 31.8 MMbbls (6.5%) lower than in the same period in 2016. The market anticipated […]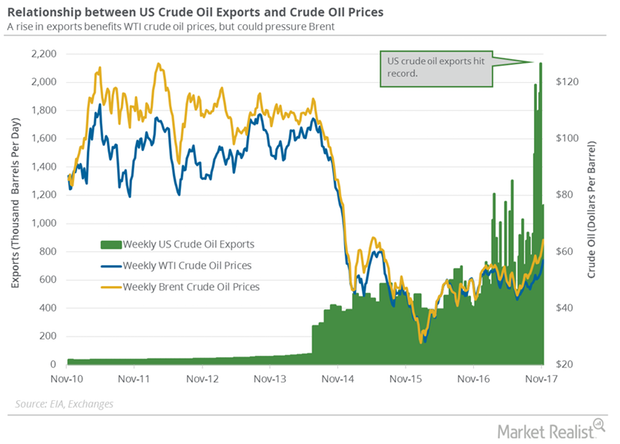
US Crude Oil Exports and Drilling Activity Impact OPEC
According to the EIA, US crude oil exports rose by 260,000 bpd to 1,129,000 bpd on November 3–10, 2017. Exports rose 30% week-over-week.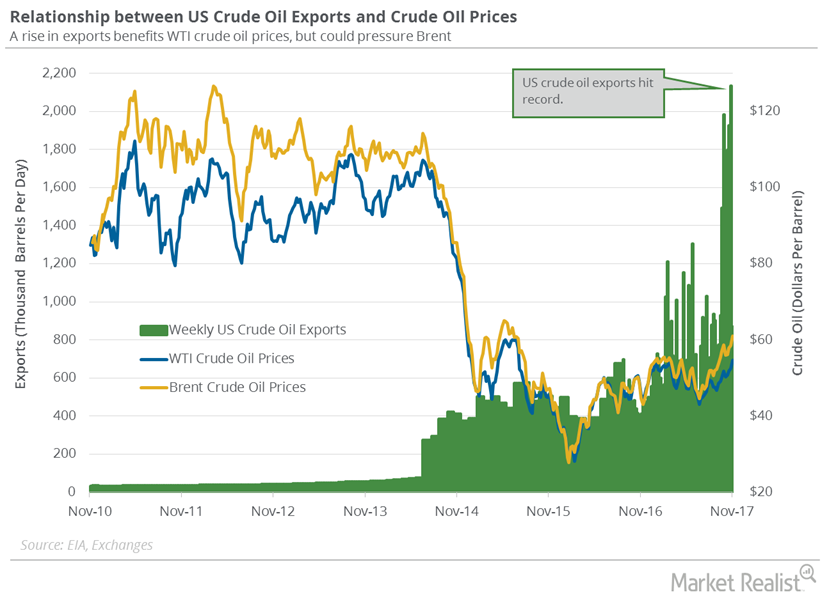
Russian and US Crude Oil Exports Are Important for Oil Bears
US crude oil exports fell by 1,264,000 bpd or 60% to 869,000 bpd on October 27–November 3, 2017. Exports rose by 459,000 bpd from the same period in 2016.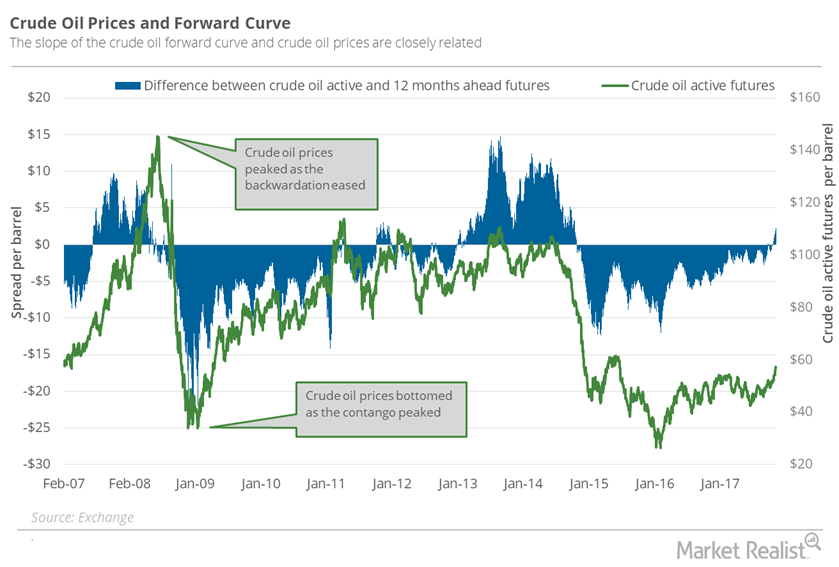
Futures Spread: Is the Oil Market Tightening?
On November 7, 2017, US crude oil (OIIL) December 2018 futures settled $2.08 below the December 2017 futures.
Understanding the Natural Gas Futures Spread: Are Oversupply Concerns Rising?
On November 1, natural gas December 2018 futures settled $0.22 above December 2017 futures. On October 25, the futures spread was at a premium of $0.11.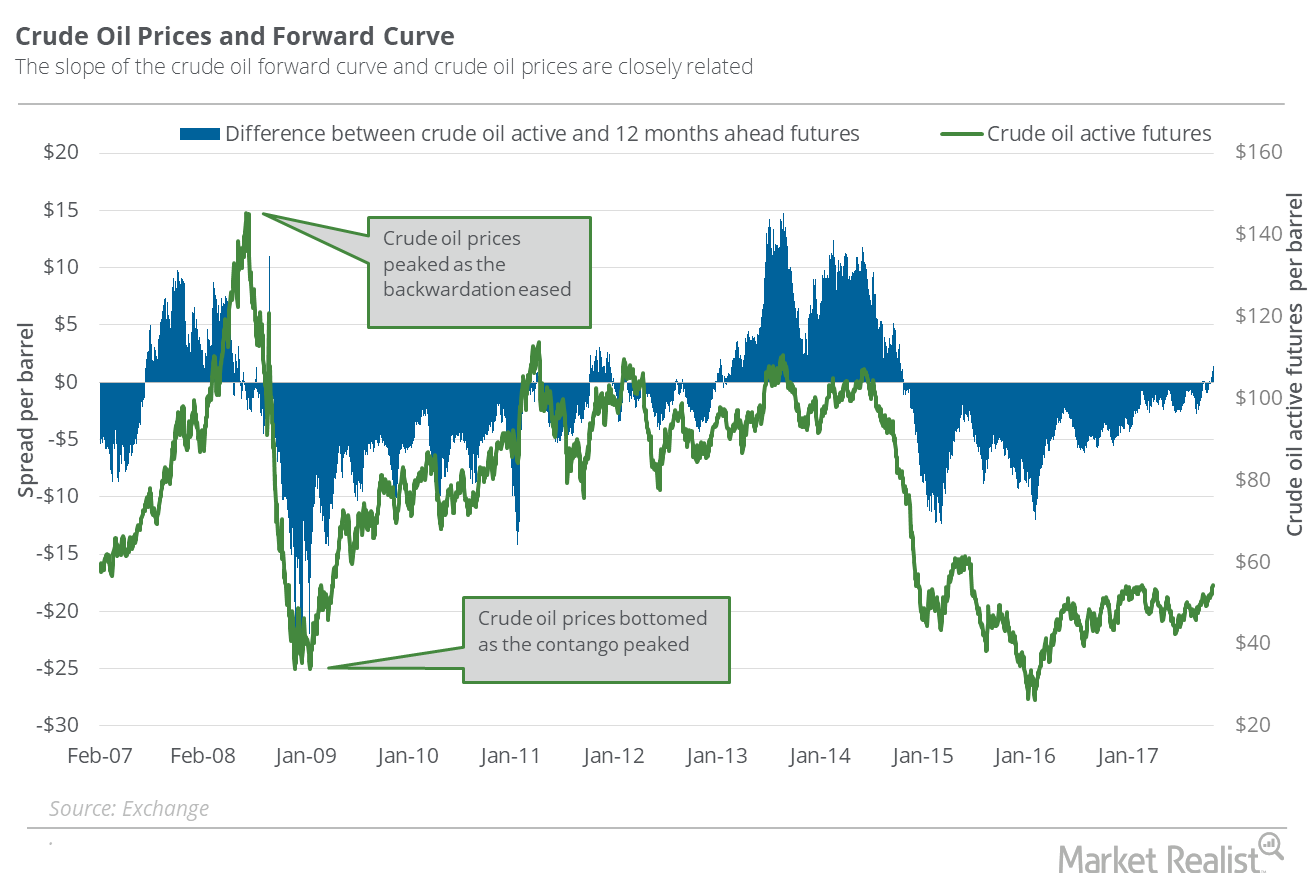
Is the Oil Market Balancing?
On October 31, 2017, US crude oil (USO) December 2018 futures settled $1.4 below December 2017 futures.
Reading the Natural Gas Futures Spread: Rising Oversupply Concerns
On October 11, 2017, the futures spread was at a premium of $0.13. Between then and October 18, natural gas November futures fell 1.2%.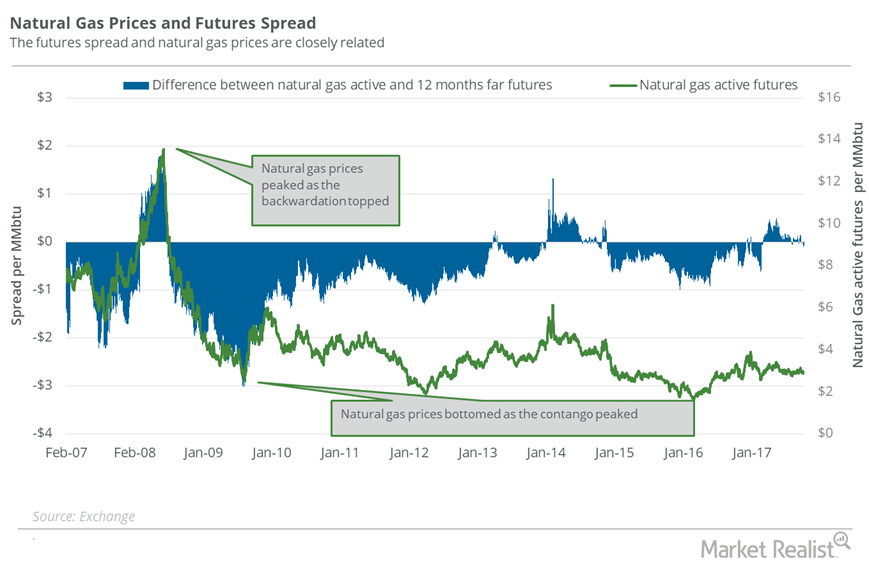
Why the Natural Gas Futures Spread Is Concerning Markets
When the futures spread is at a premium, or the premium rises, it could hamper the rise in natural gas prices.
Futures Spread: A Look at Natural Gas Supply–Demand Concerns
On October 4, 2017, natural gas (UNG) (GASL) November 2018 futures traded $0.08 above the November 2017 futures.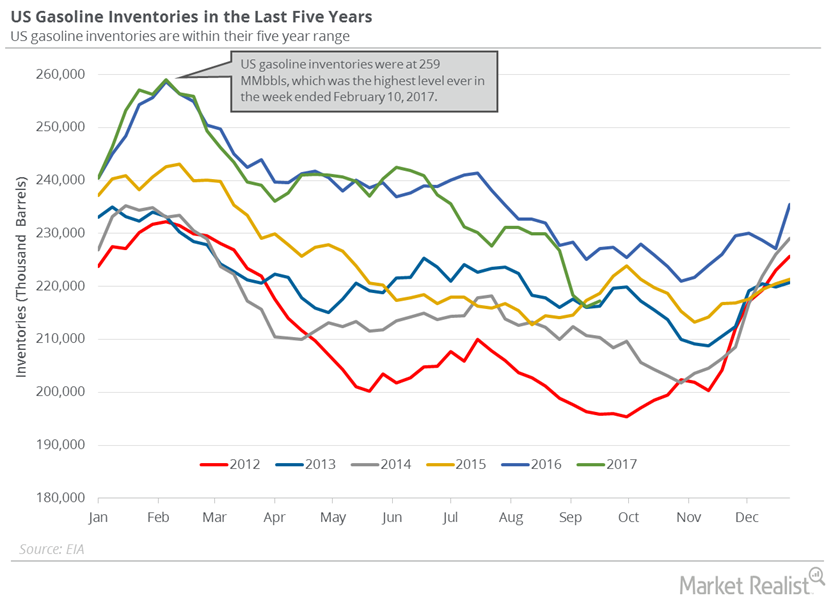
Understanding the Rising US Gasoline Inventories
The EIA estimated on September 27 that US gasoline inventories rose 1.1 MMbbls (million barrels) to 217.2 MMbbls from September 15–22, 2017.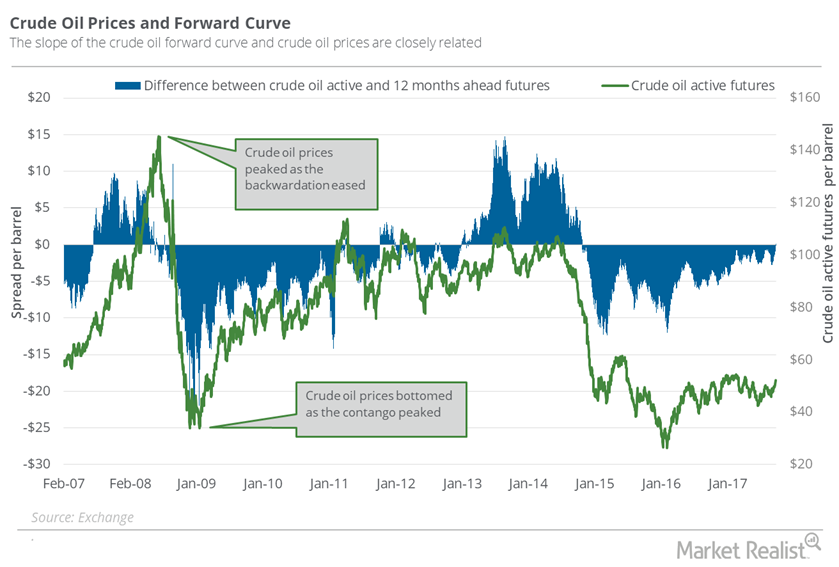
Understanding the Oil Futures’ Forward Curve
On September 26, 2017, US crude oil November 2017 futures traded just $0.14 below the November 2018 futures.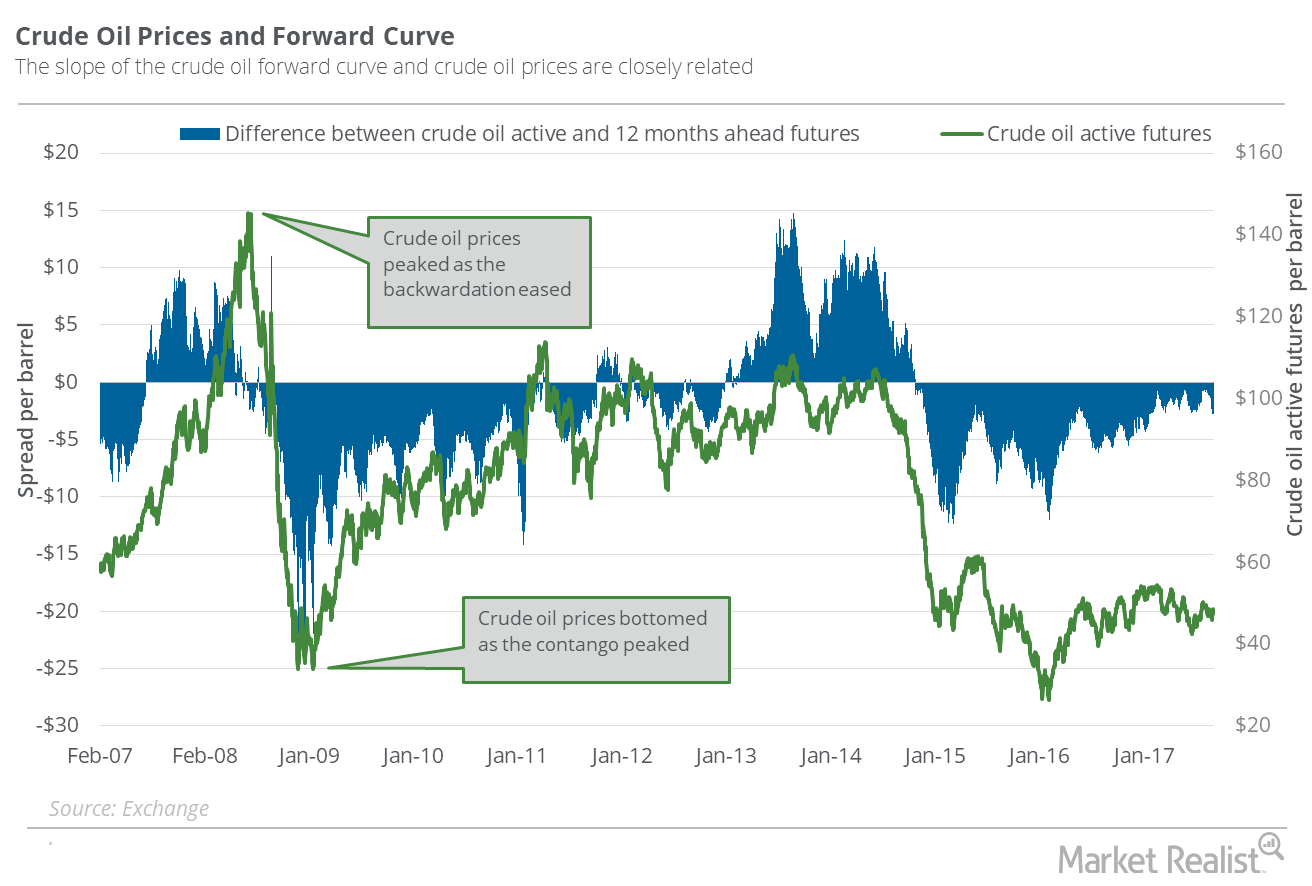
Have Oil Supply Glut Concerns Relaxed since Harvey?
On September 5, US crude oil October 2018 futures traded at a premium of $1.94 to October 2017 futures. On August 29, the premium was at $2.37.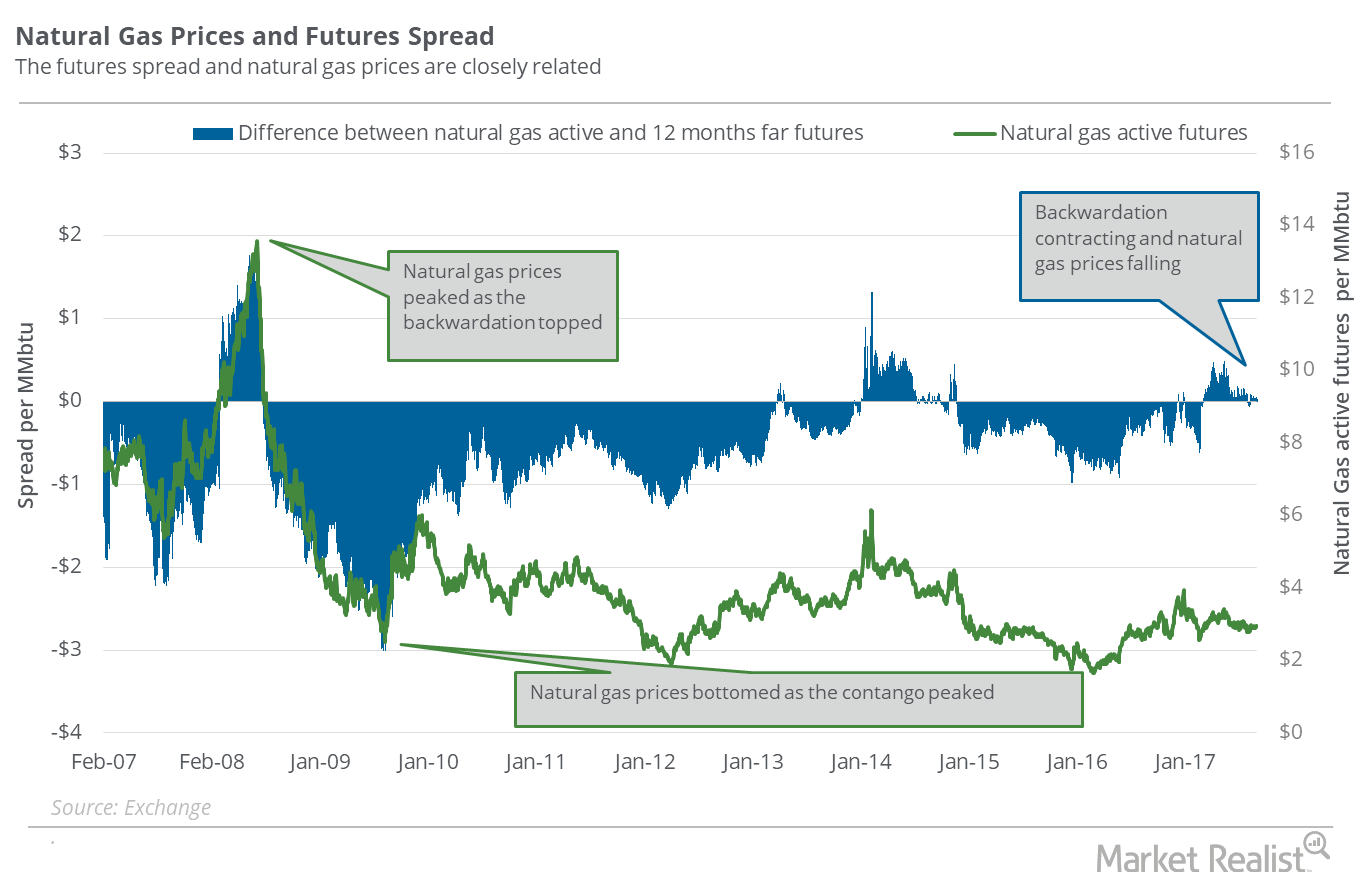
Natural Gas: Analyzing the Futures Spread
On August 30, 2017, natural gas October 2018 futures traded at a discount of ~$0.03 to October 2017 futures.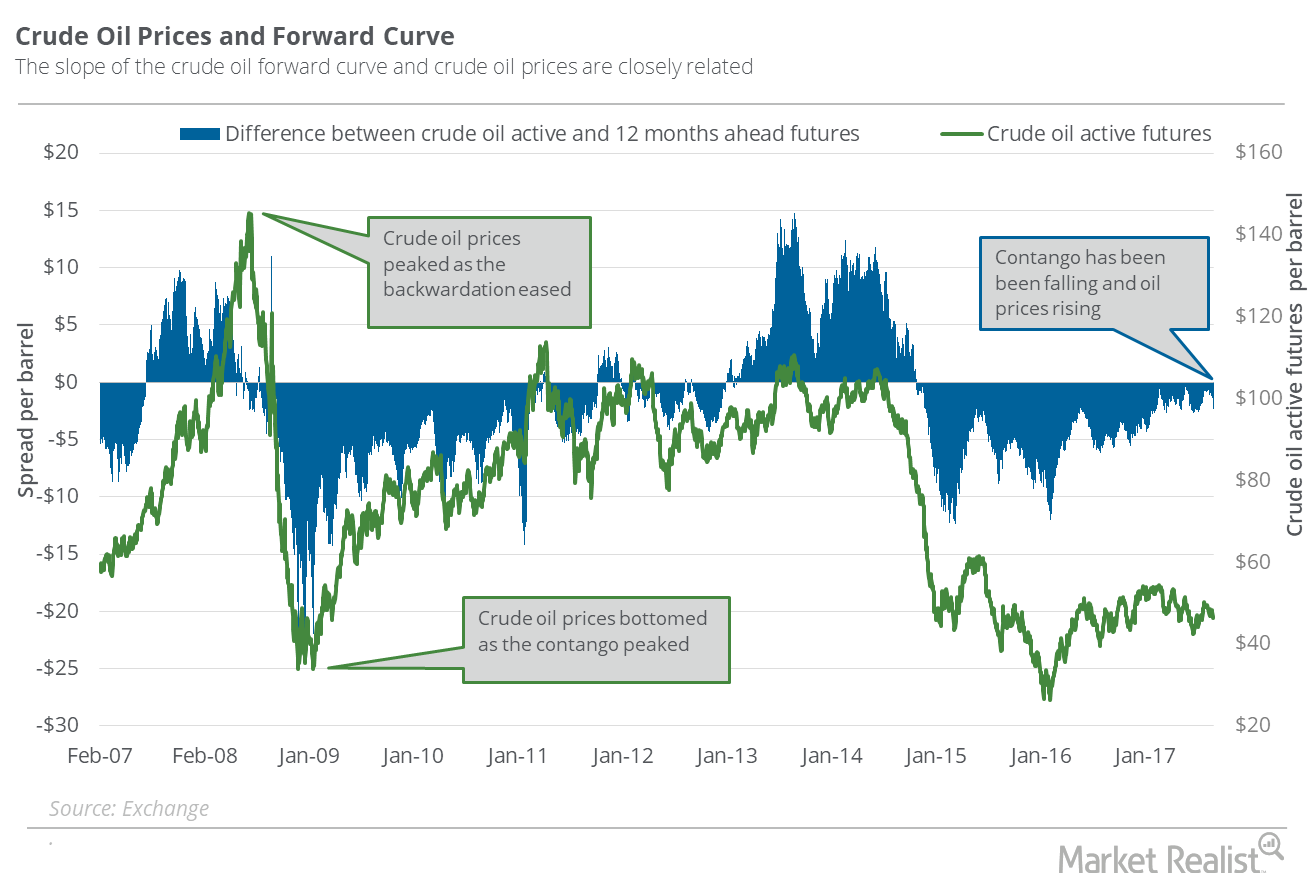
Oil’s Futures Spread: Have Supply Glut Concerns Increased?
On August 29, 2017, US crude oil (USL) October 2018 futures traded at a premium of $2.37 to October 2017 futures.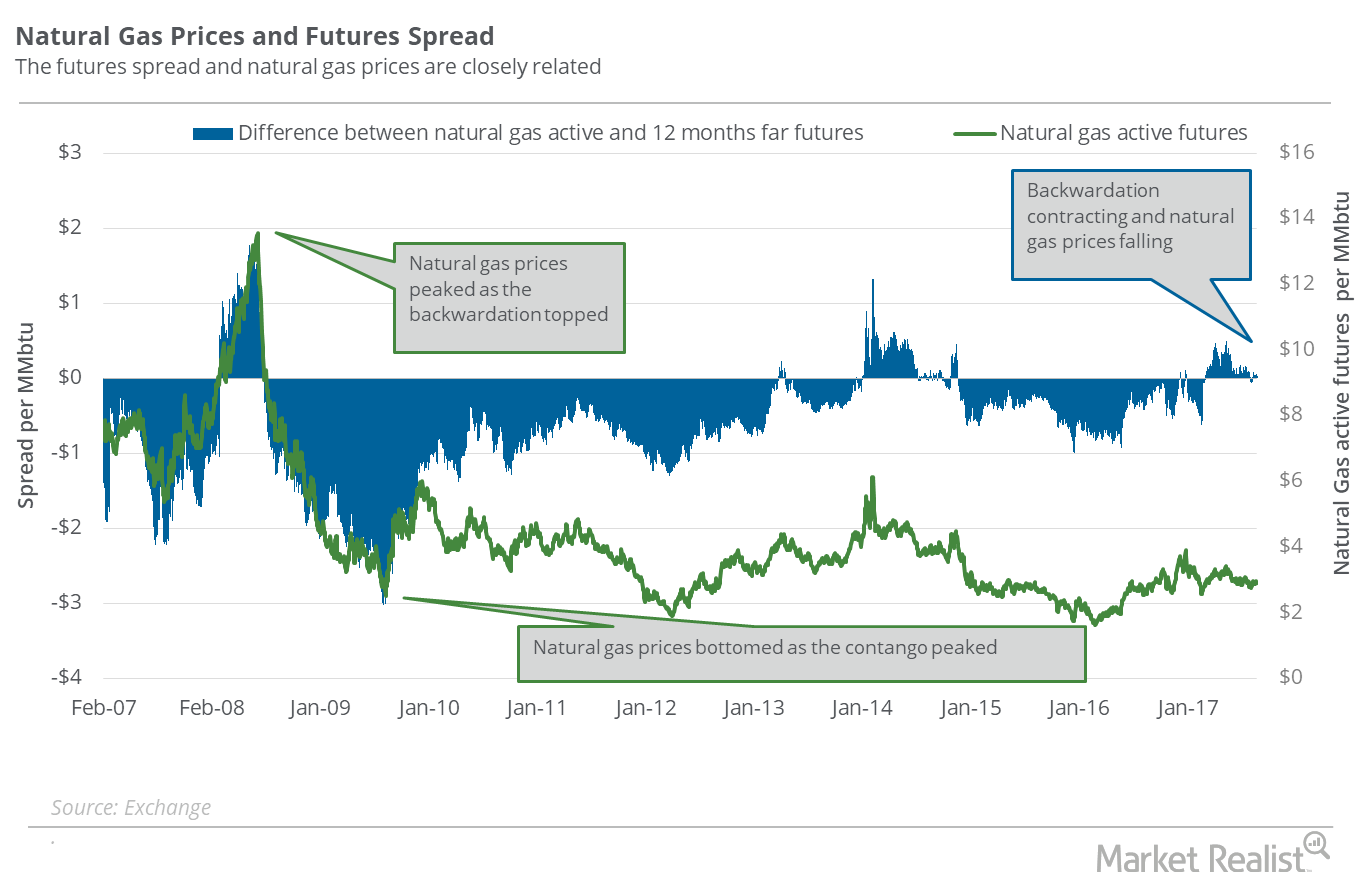
Natural Gas Futures Spread: Analyzing Supply-Glut Concerns
On August 23, 2017, natural gas September 2018 futures traded at a discount of $0.03 to September 2017 futures.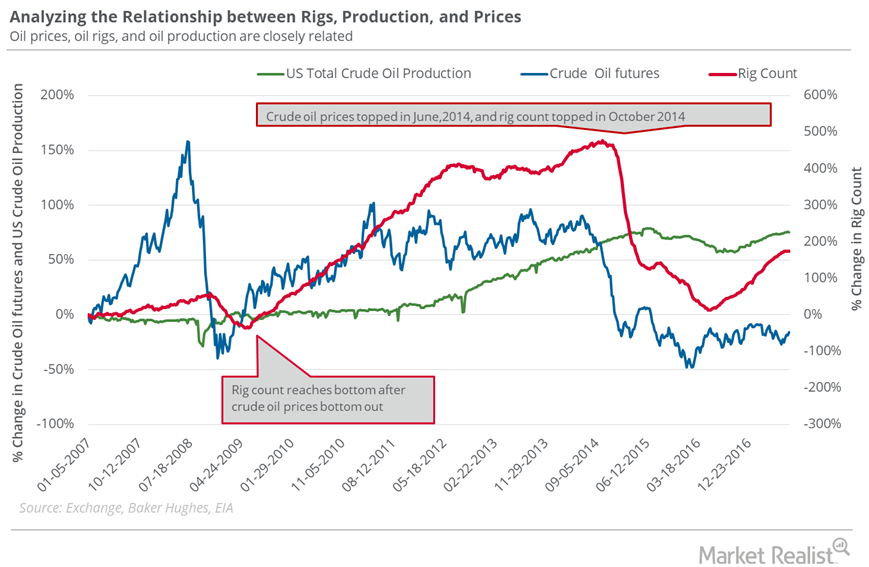
Could the Oil Rig Count Threaten Bullish Bets on Oil Prices?
The US oil rig count rose by three to 768 for the week ended August 11, 2017.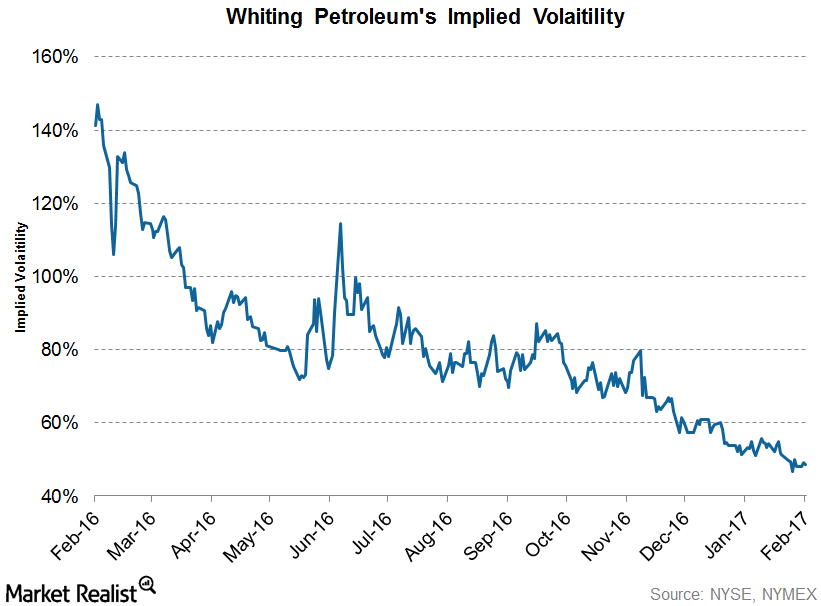
Whiting Petroleum’s Implied Volatility: Key Trends
Whiting Petroleum’s (WLL) implied volatility as of February 22, 2017, was 48.5%, which was ~4.3% lower than its 15-day average of 50.7%.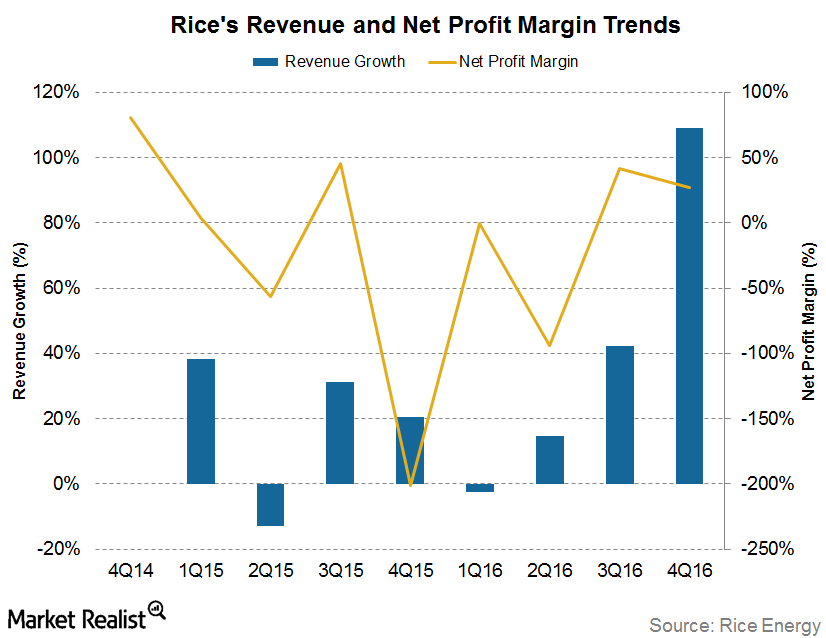
Rice Energy’s Revenue Growth and Net Profit Margin Trends
Rice Energy’s (RICE) 4Q16 revenue rose ~109.0% YoY (year-over-year).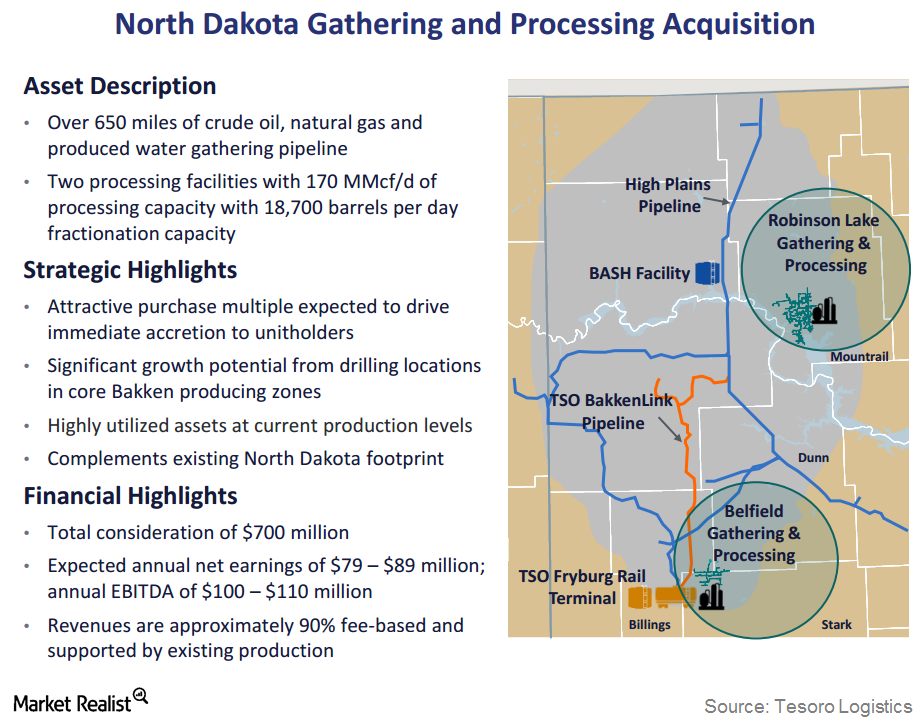
Whiting Petroleum Announces Bakken Midstream Divestiture
On November 21, 2016, Whiting Petroleum announced its intention to sell its Bakken midstream assets to an affiliate of Tesoro Logistics Rockies for $375 million.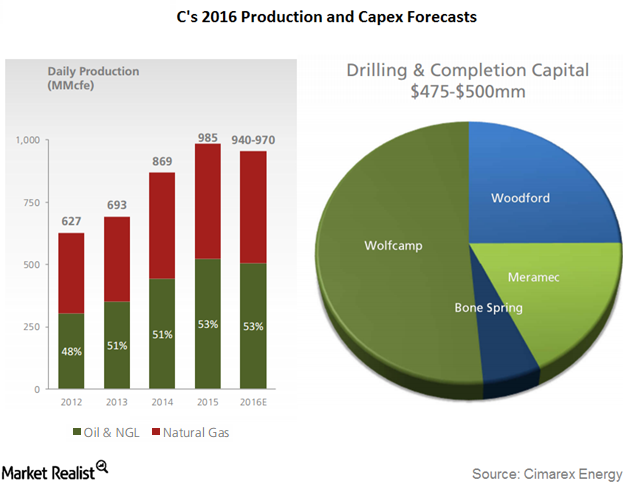
What Happened to Cimarex’s 1Q16 Production Volumes and Realized Prices?
Cimarex Energy’s (XEC) total production volume in 1Q16 was 973 MMcfe (millions of cubic feet equivalent). This represents a rise of ~3% YoY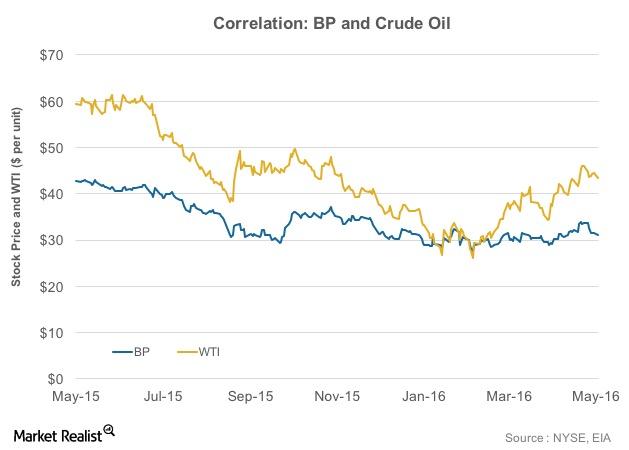
How Do BP’s Stock and Crude Oil Prices Correlate?
To what degree are integrated energy companies such as BP affected by volatility in crude oil prices? This varies from company to company.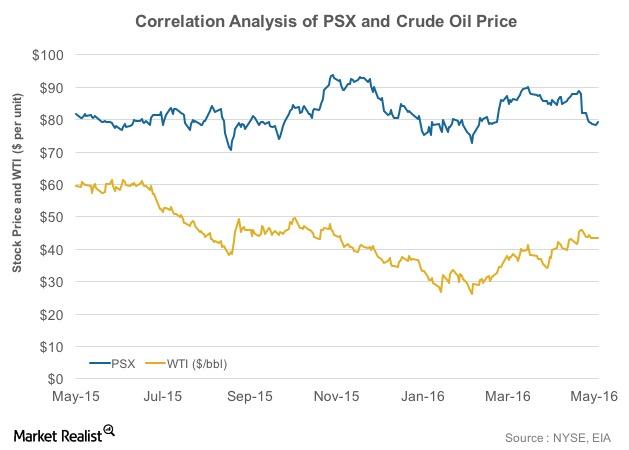
Phillips 66 and the Price of Crude Oil: A Correlation Analysis
The correlation value of Phillips 66 (PSX) and crude oil prices shows that the price of PSX stock moves in line with WTI prices to a certain extent.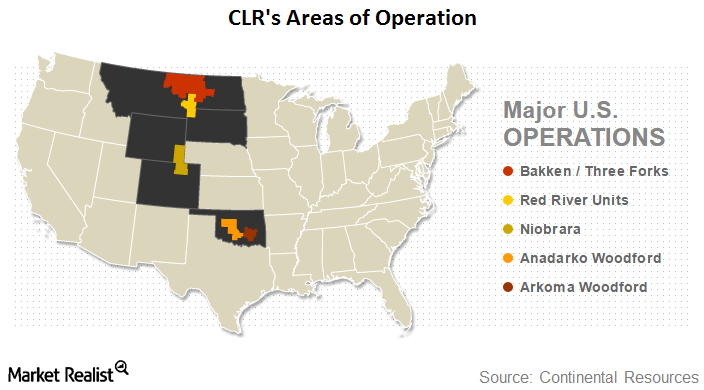
Continental Resources: An Introduction
In this series, we will analyze how badly Continental Resources (CLR) was hit by weak oil prices, and what measures it has taken to counter this situation. In 2015, crude oil accounted for 66% of CLR’s total production and 85% of its revenues.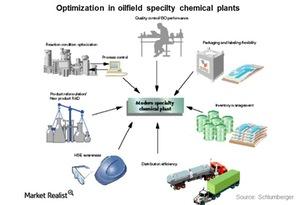
The Importance of Specialty Chemicals in the Oil Industry
Specialty oilfield chemicals are used in the oil and gas industry to improve well performance by making exploration and production more efficient.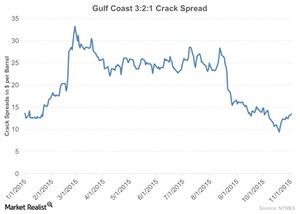
Wider Crack Spread: Its Impact on Refiners
The recent rise in the crack spread is driven by factors like low crude oil prices, a rise in demand for gasoline, and a sharp rise in demand for propane.