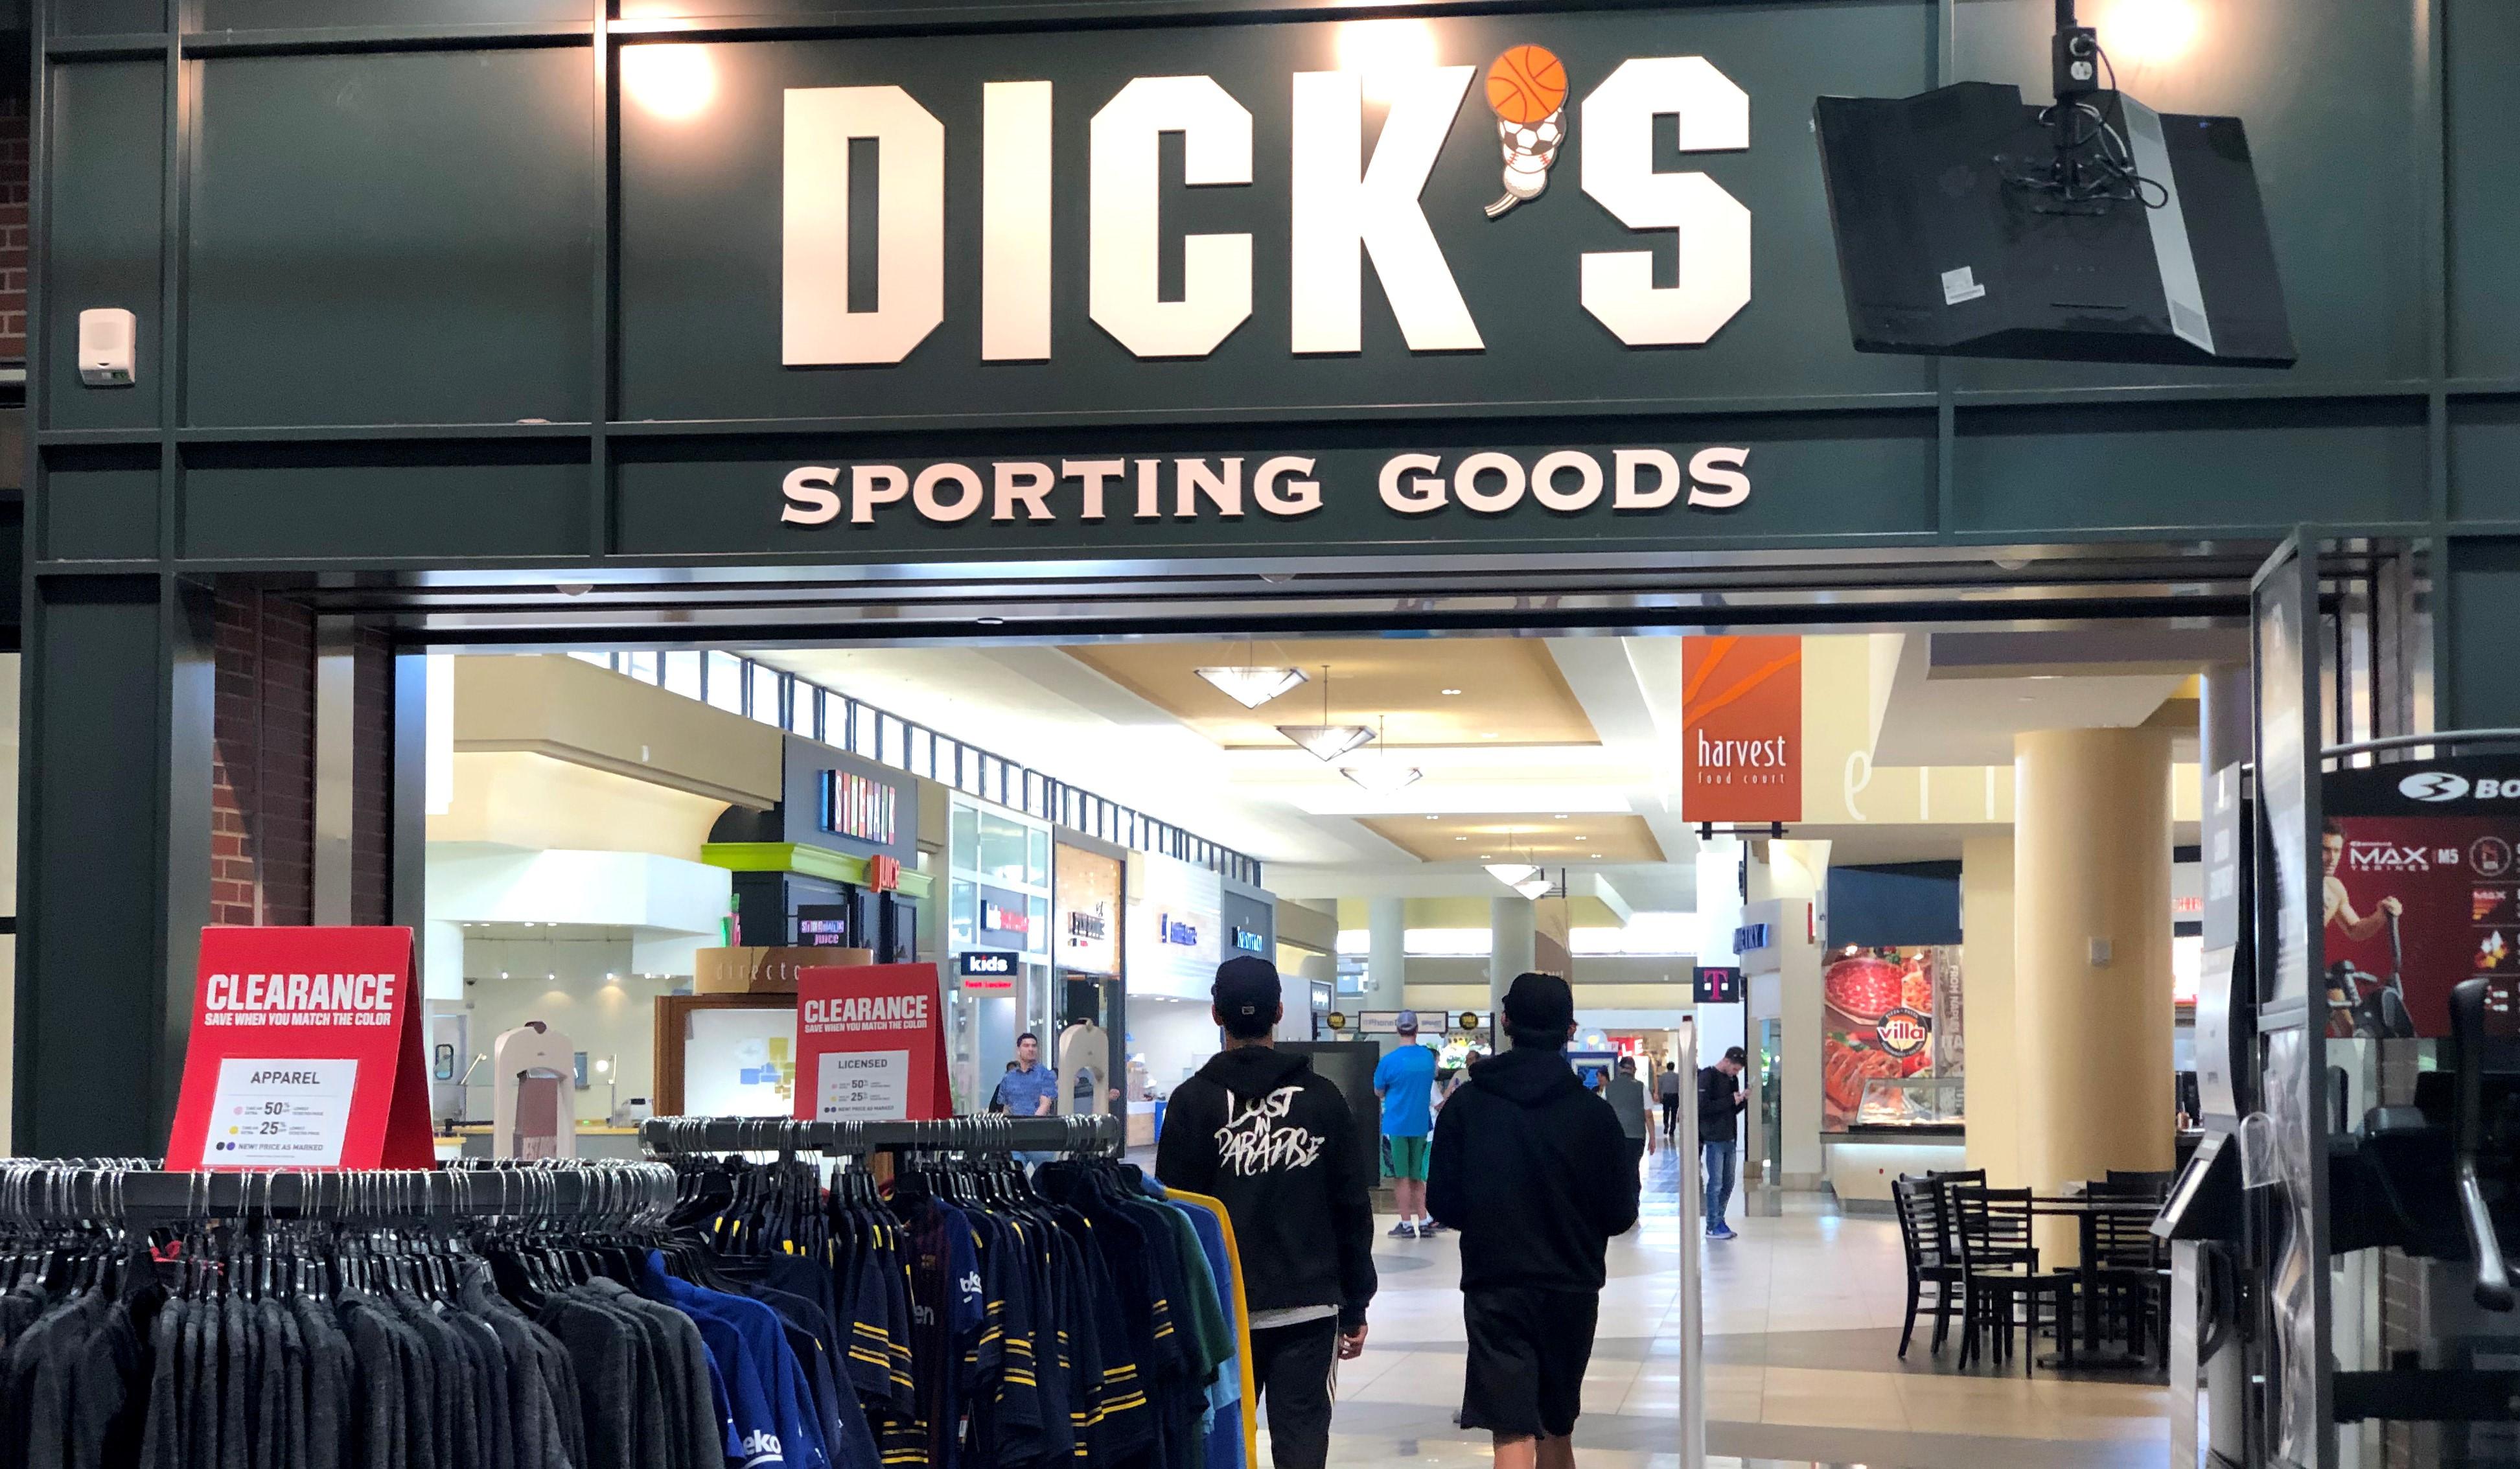
Dick's Sporting Goods Inc
Latest Dick's Sporting Goods Inc News and Updates
DKS Posts Positive Q2 Earnings, Stock Might Be Overvalued
Dick's Sporting Goods stock is on the move following a positive earnings call. Is the stock overvalued, or are investors looking ahead to a windfall?
What Are the Three Best Golf Stocks to Buy in 2021?
Millions of people tuning in and watching the national golf championship. What are the best golf stocks for investors to buy in 2021?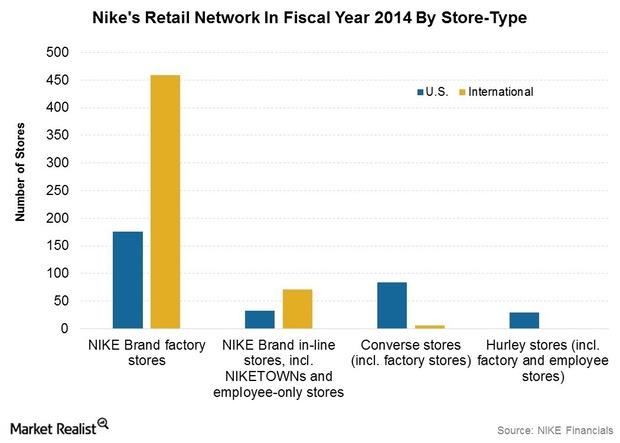
NIKE Scores Big Leveraging E-commerce, Retail Channels
The company is widening its retail footprint and growing e-commerce sales. NIKE’s store count stood at 858 stores at the end of fiscal 2014.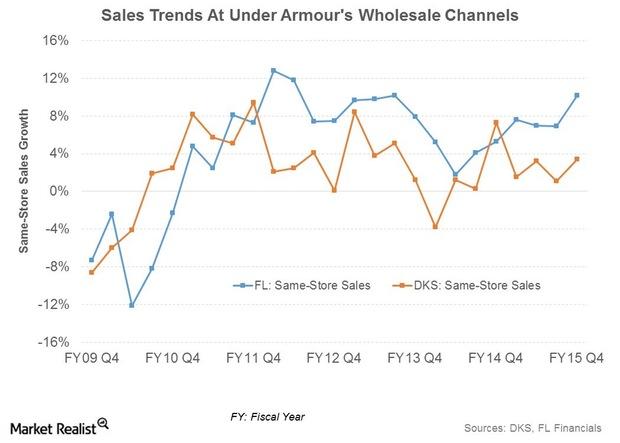
Under Armour: The ARMOURY and Its Wholesale Strategic Importance
The ARMOURY stores will cater to the premium segment of the market. They’ll also feature UA product exclusives and occasional visits from star athletes.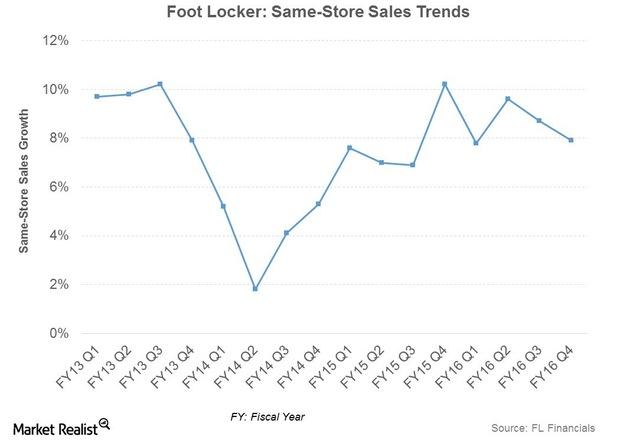
What Can We Expect from Nike’s Wholesale Channel in Fiscal 3Q16?
The wholesale channel is the largest channel for Nike’s (NKE) sales.
Porter’s Five Forces: What’s Foot Locker’s Industry Position?
In this part, we’ll look at industry forces affecting sporting goods retailers. We’ll also look at Foot Locker’s competitive positioning based on Porter’s Five Forces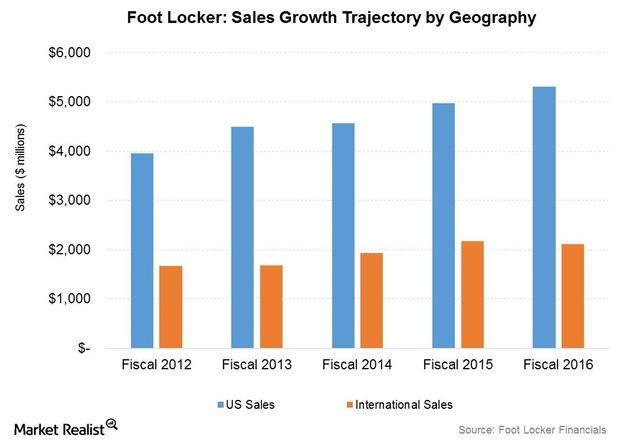
Fleet of Foot? Foot Locker’s Fastest-Growing Sales Segments
In fiscal 2016, Foot Locker made $5.3 billion in US sales, representing 71.6% of its total revenue. In contrast, international revenue came in at $2.1 billion.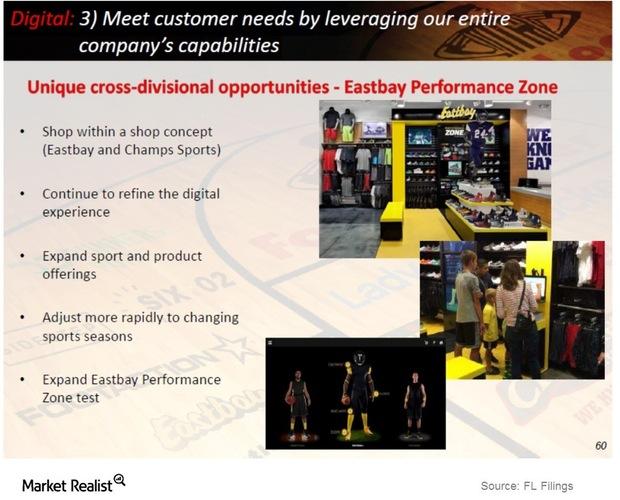
Foot Locker’s e-Commerce Sales Growth: Potential and Prospects
Foot Locker (FL) operates several e-commerce websites under the Foot Locker and other store banners. It reports e-commerce sales under the direct-to-customer segment.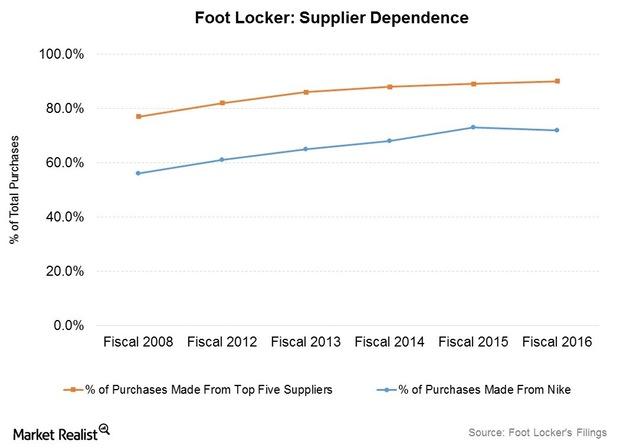
Analyzing the Cogs in Foot Locker’s Supply Chain
Foot Locker’s distribution and supply chain includes five distribution centers around the world. It owns two of them and leases three.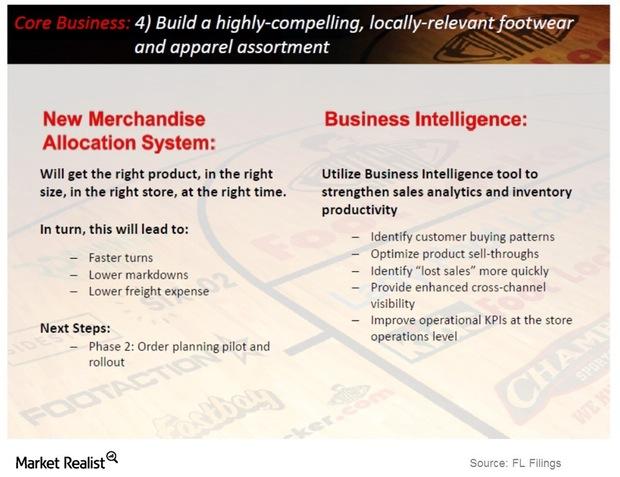
How Foot Locker Has Stepped Up Inventory Management Efforts
In recent quarters, Foot Locker (FL) has made inventory management a priority. The retailer is targeting faster inventory turns.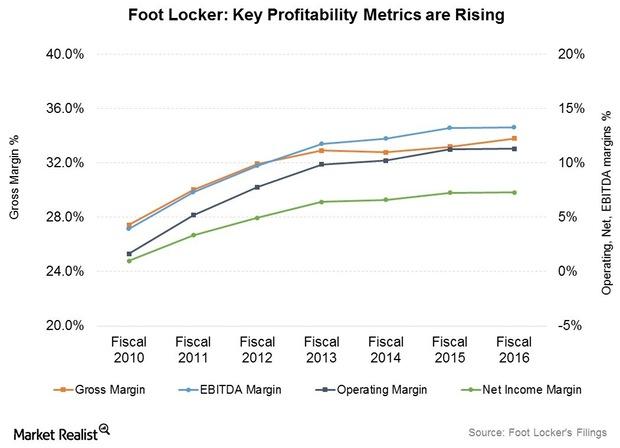
A Look at Foot Locker’s Cost Structure, Expanding Profitability
As part of its long-term plan, Foot Locker (FL) has been concentrating on enhancing its profitability margins and focusing on store remodels and improved service and product assortment.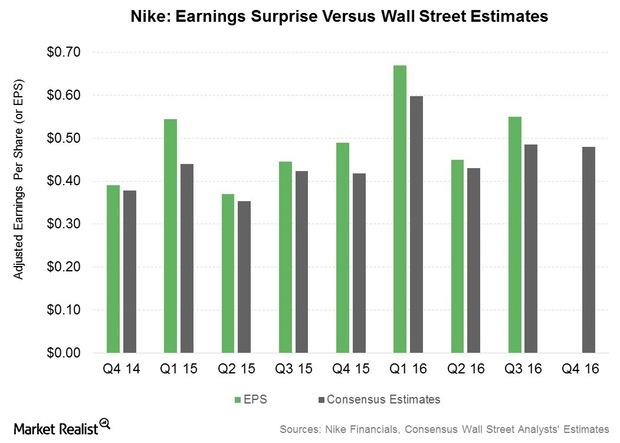
The Earnings Outlook for Nike in Fiscal 4Q16
After posting adjusted EPS growth rates exceeding 20% in the first three quarters of fiscal 2016, the earnings expectations for Nike (NKE) in the fourth quarter are modest.
Will SNAP Stock Rise above Its IPO Price after Earnings?
The Q3 Snap earnings report is due on October 22. So could a positive surprise be enough to send Snap stock back toward its original price?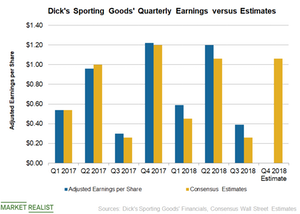
A Look at Dick’s Sporting Goods’ Bottom-Line Performance in 2018
In the last ten quarters, Dick’s Sporting Goods (DKS) has topped analysts’ bottom-line estimates eight times and missed them twice.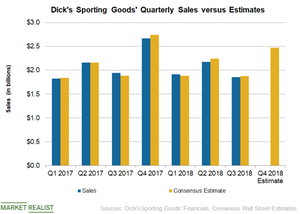
Dick’s Sporting Goods’ Sales Growth Was Unimpressive in 2018
In the last ten quarters, Dick’s Sporting Goods (DKS) has missed analysts’ top-line estimates five times and surpassed them in the rest of the quarters.
How Dick’s Sporting Goods Stock Performed in 2018
Dick’s Sporting Goods (DKS) stock rose 8.6% to $31.20 in 2018.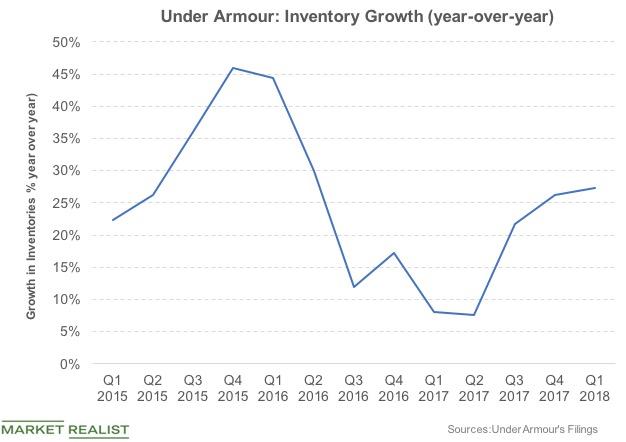
Under Armour: Inventory Management in Focus
Inventory backlog has been a critical pressing issue for Under Armour (UAA) for some time.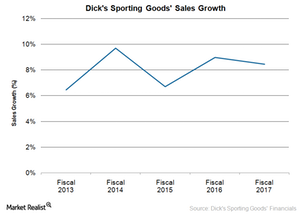
An Insight into Dick’s Sporting Goods’ Sales Trends
In fiscal 2017, Dick’s Sporting Goods (DKS) reported sales of $8.59 billion, missing analysts’ estimate by just 0.8%.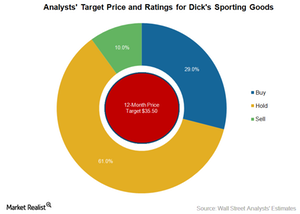
Dick’s Sporting Goods: What Analysts Recommend after Fiscal 4Q17
As of March 13, 2018, 61% of the 31 analysts covering Dick’s Sporting Goods (DKS) stock are recommending a “hold.”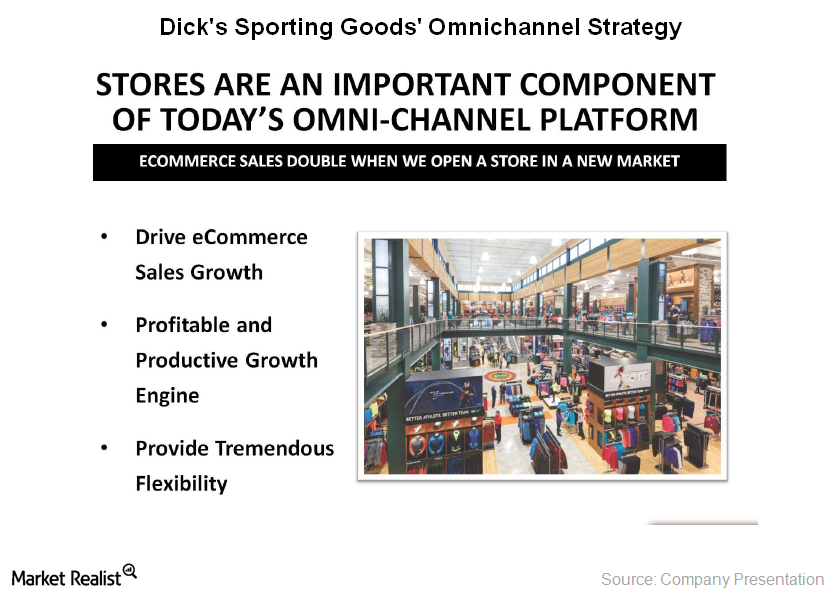
Dick’s Sporting Goods’ Growth Strategies in 2018
To thrive in such a challenging retail environment, Dick’s Sporting Goods is now investing in e-commerce and omnichannel capabilities.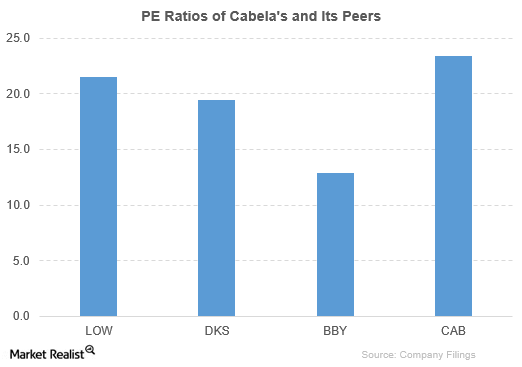
How Does Cabela’s Compare to Its Peers?
Cabela’s peers have outperformed the company based on PBV. However, Cabela’s has outperformed its peers based on PE and PS.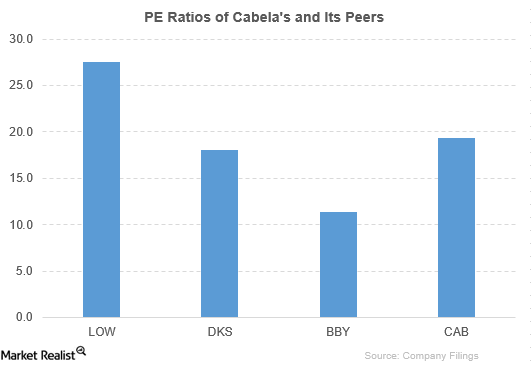
How Does Cabela’s Compare to Its Peers after 2Q16 Earnings?
Cabela’s (CAB) has been outperformed by its peers based on PBV (price-to-book value) ratio. However, Cabela’s has mostly outperformed its peers based on PE (price-to-earnings) and price-to-sales ratios.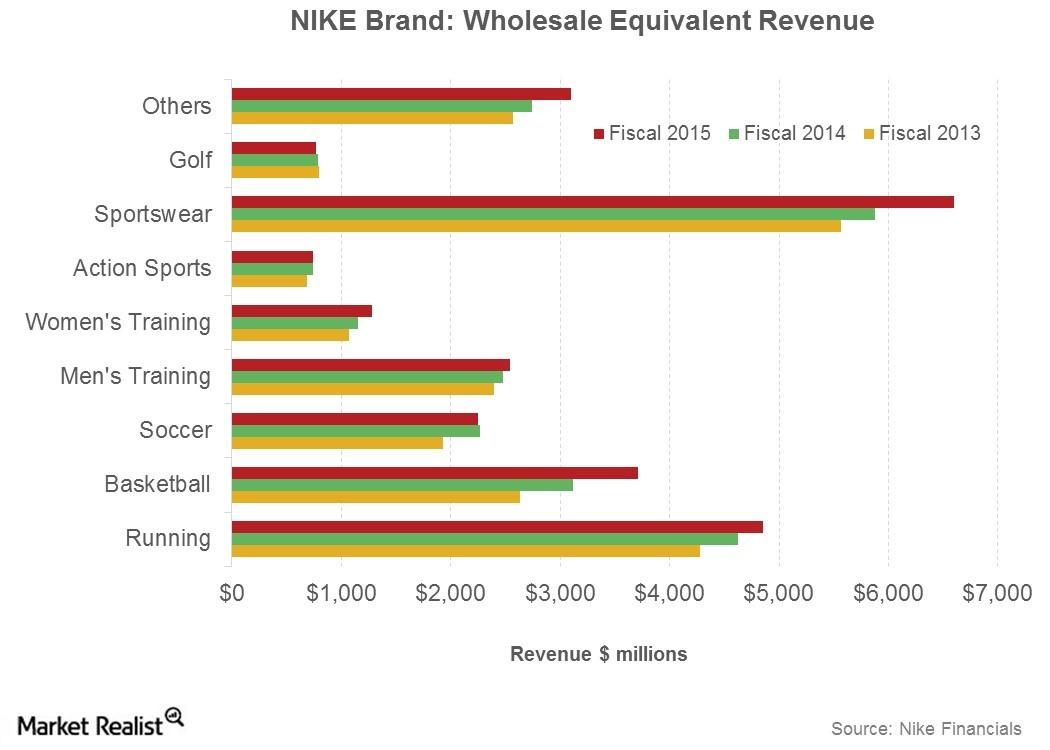
Future Sales Drivers for Nike’s Integrated Marketplace Model
Nike is expecting sales through wholesalers to grow at a mid- to high-single compounded annual growth rate over the next five years through fiscal 2020.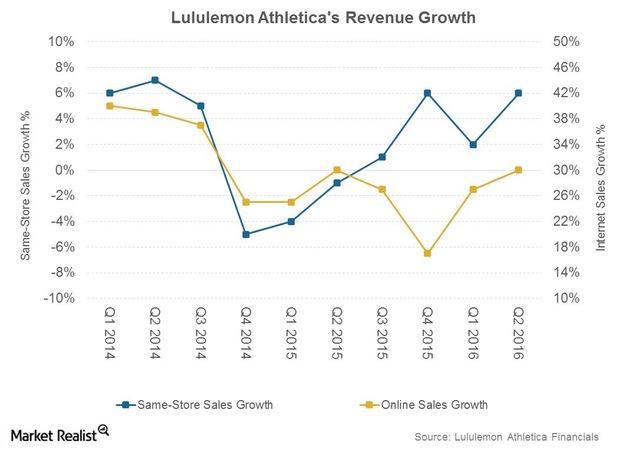
Can Lululemon Keep Seeing Traction in Same-Store Sales?
Lululemon’s same-store sales performance was healthy in 2Q16. There’s been a reversal in the negative trend that dogged the retailer for much of last year, particularly in its brick-and-mortar channel.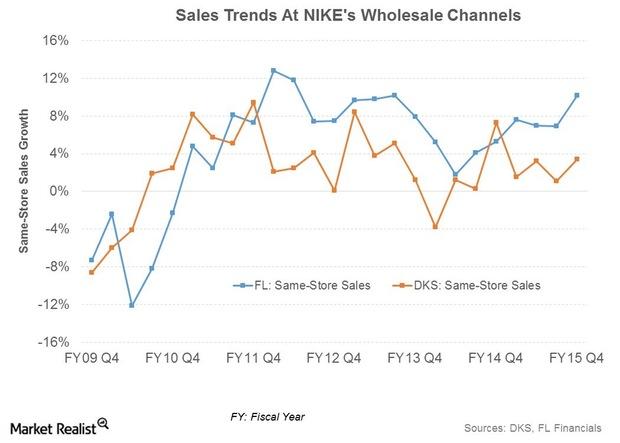
How Nike Benefits from Its Wholesale Partnerships
Nike (NKE) has a number of stores-within-stores, or exclusive standalone stores, partnering with retailers.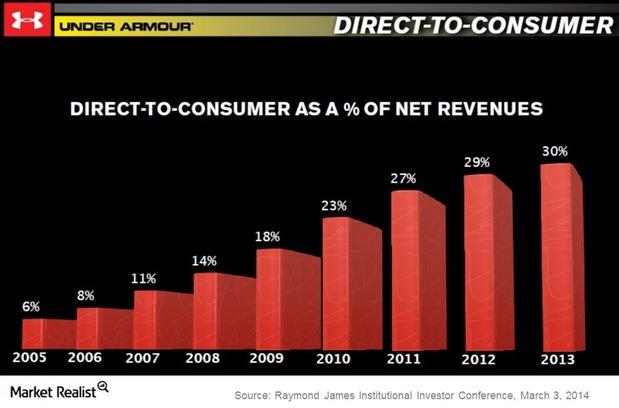
Under Armour revenues and retail presence
Wholesales represented 68% of Under Armour revenues in 2013. As a category, however, DTC sales have increased steadily over the years.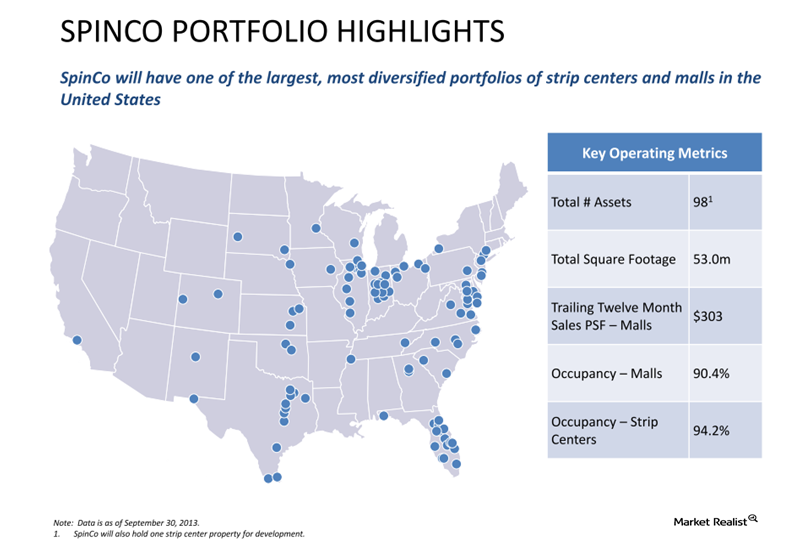
Must-know basics of Simon Property Group’s spinoff REIT, Spinco
Spinco will have one of the largest, most diversified portfolios of strip centers and malls in the United States. It will hold a total of 98 assets.