Fossil Group Inc
Latest Fossil Group Inc News and Updates
It Was a Festive Holiday Season for Signet Jewelers
On January 7, 2016, Signet Jewelers (SIG), the world’s largest retailer of diamond jewelry, announced its broad-based success in the holiday season with revenue of $1.9 billion.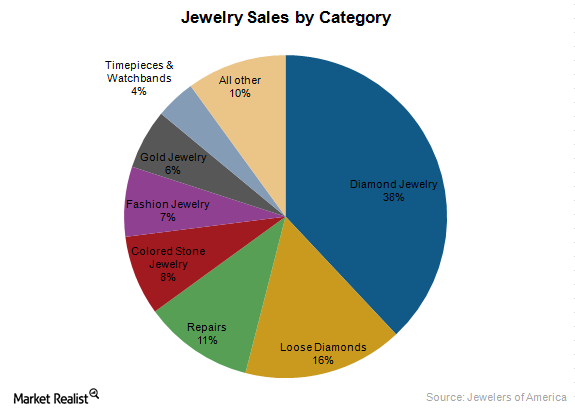
State of the Jewelry Industry in 2015: Growth and Challenges
Trends shaping the jewelry industry include Increasing demand for branded jewelry and an increased focus on e-commerce sales.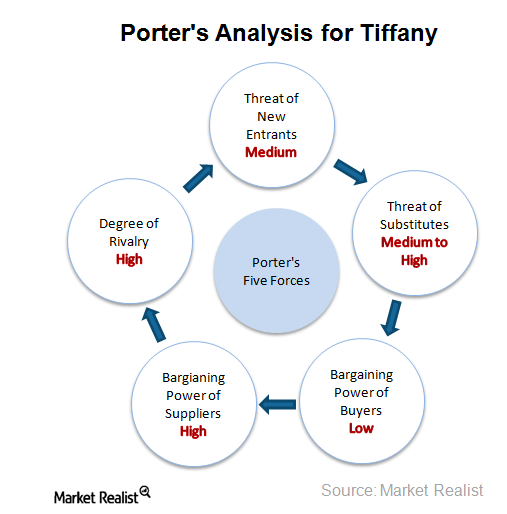
Tiffany’s Competitive Position: Porter’s Five Forces Analysis
Porter’s Five Forces model suggests that there are five forces that determine the attractiveness and long-term profitability of an industry or a sector.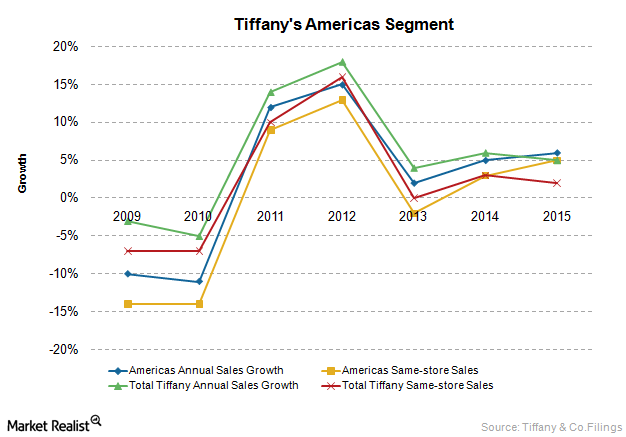
Analyzing Tiffany’s Largest Segment: The Americas
Tiffany & Co.’s Americas segment includes sales from company-operated retail stores in the United States, Canada, Mexico, and Brazil.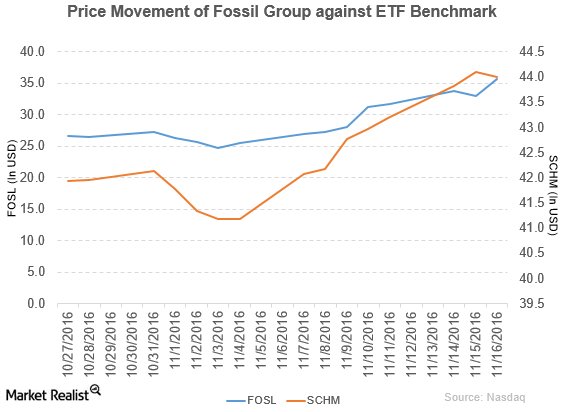
KeyBanc Capital Markets Upgrades Fossil to ‘Overweight’
Fossil Group (FOSL) has a market cap of $1.6 billion. It rose 8.4% to close at $35.70 per share on November 16, 2016.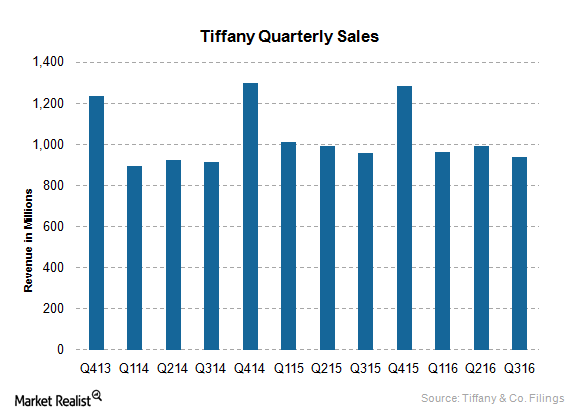
Hurdles in Tiffany’s Growth: Weaknesses and Threats
Since it’s a luxury brand, Tiffany & Co.’s products are priced high, with no promotions. Thus, Tiffany products may be out of reach for many customers.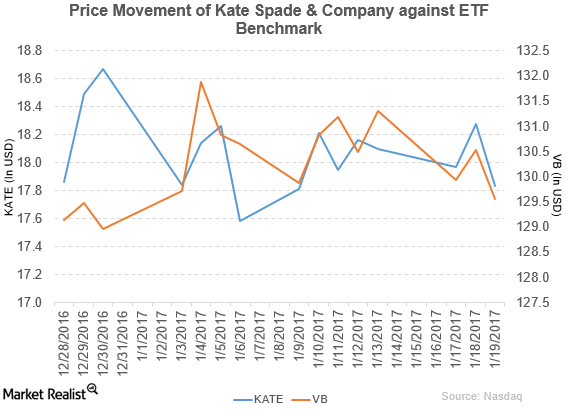
Bank of America/Merrill Lynch Downgrades Kate Spade to ‘Neutral’
Kate Spade (KATE) reported fiscal 3Q16 net sales of $316.5 million—a rise of 14.1% compared to net sales of $277.3 million in fiscal 3Q15.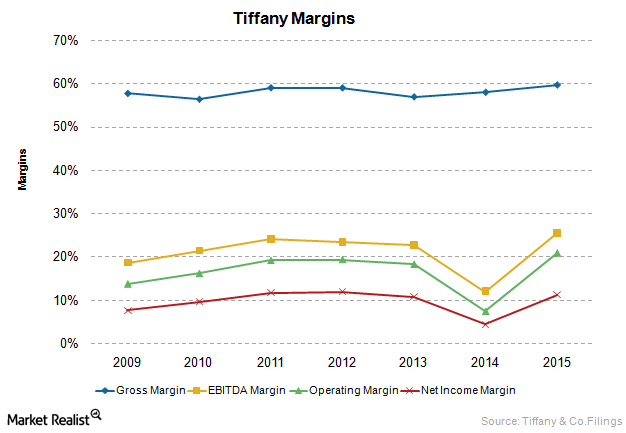
Why Tiffany & Co. Is More Profitable than Its Competitors
Since 2006, Tiffany’s margins have been on the higher side compared to its peers, including Signet Jewelers and Fossil, in the retail jewelry industry.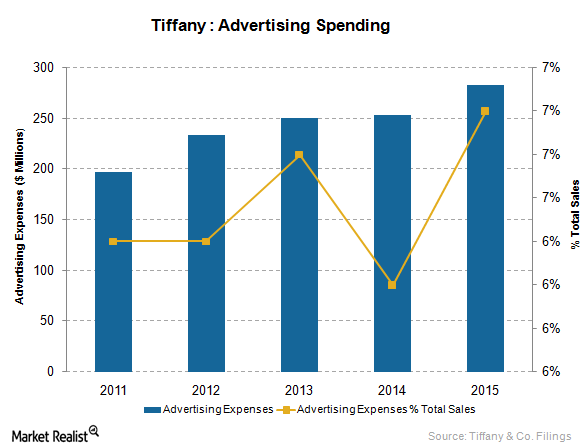
Why Tiffany Is Spending More on Marketing
Tiffany has been increasing its advertising expenses. In fiscal 2015, it spent $284 million on advertising, marketing, and public and media relations.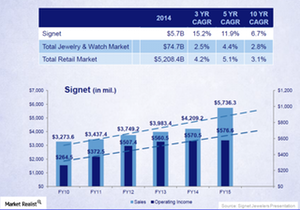
Signet Jeweler’s Market Positioning in the Retail Jewelry Industry
Total retail jewelry sales in the US grew at a CAGR of 4.4%, reaching $74.7 billion in 2014. Fine jewelry sales grew at a CAGR of 5%, reaching ~$69 billion.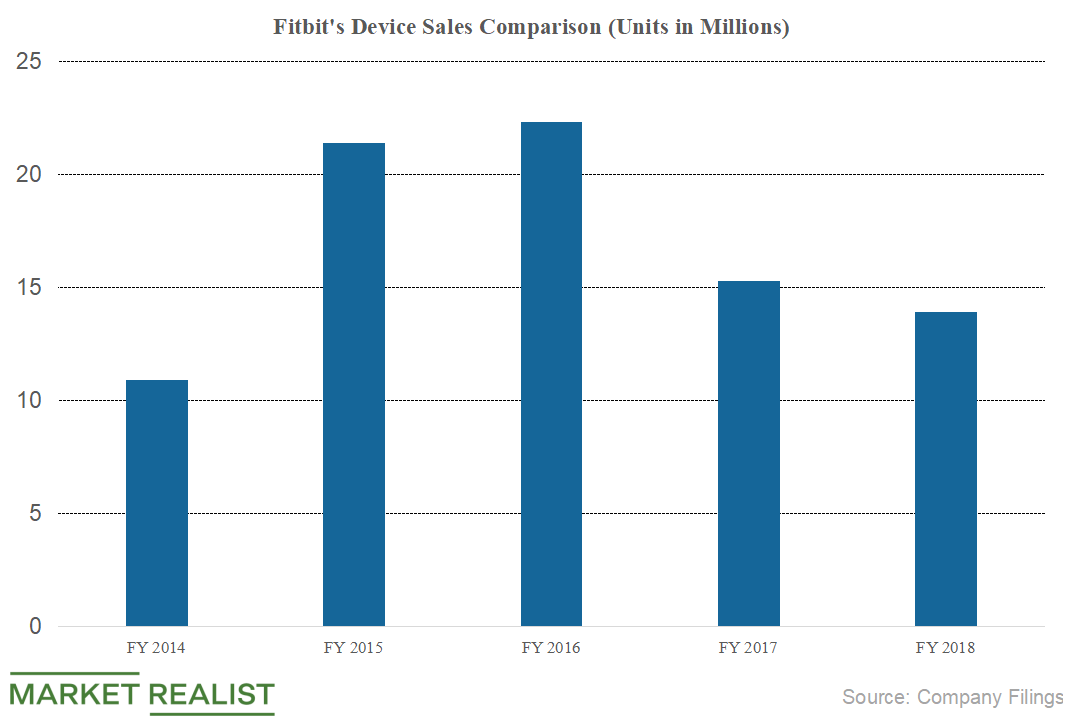
Fitness Trackers Are Likely to Hit Fitbit’s Sales in 2019
Though Fitbit’s smartwatch sales rose 437% in 2018, the company posted negative overall revenue growth.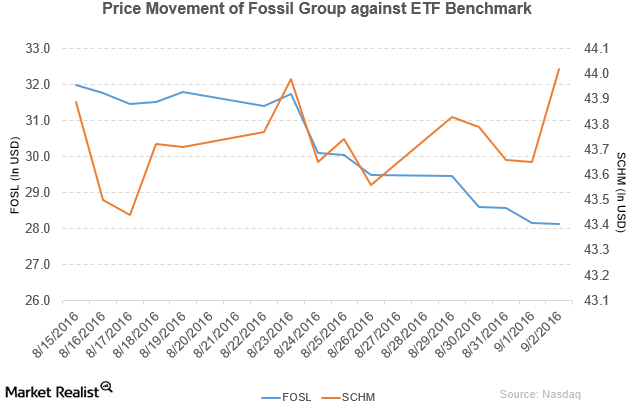
Fossil Will Ship Smartwatches Based on Qualcomm Technologies
Fossil fell by 4.6% to close at $28.13 per share during the fifth week of August, with weekly, monthly, and YTD price movements of -4.6%, -4.8%, and -23.1%.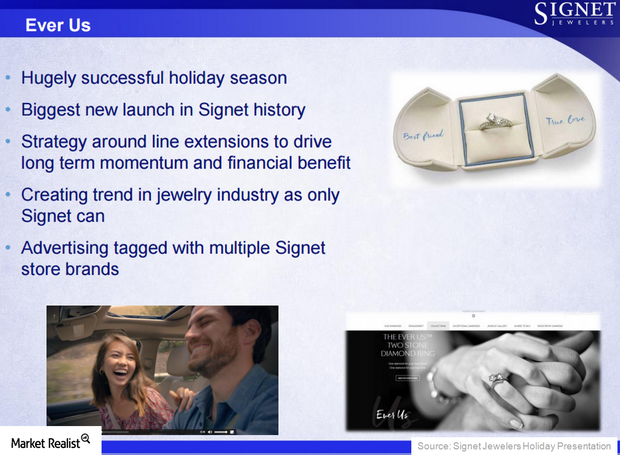
Signet Jewelers’ Ever Us Is Setting Trend for Jewelry Industry
Signet launched a new collection called Ever Us in October 2015. It’s meant to meet the need for jewelry that represents the bond between two people.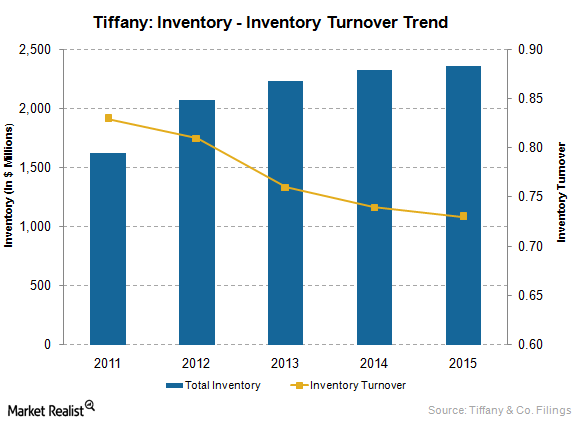
Low Inventory Turnover Is a Concern at Tiffany & Co.
At the end of fiscal 2015, Tiffany had a total inventory of $2.4 billion and inventory turnover of 0.73x, implying potential low sales and excess inventory.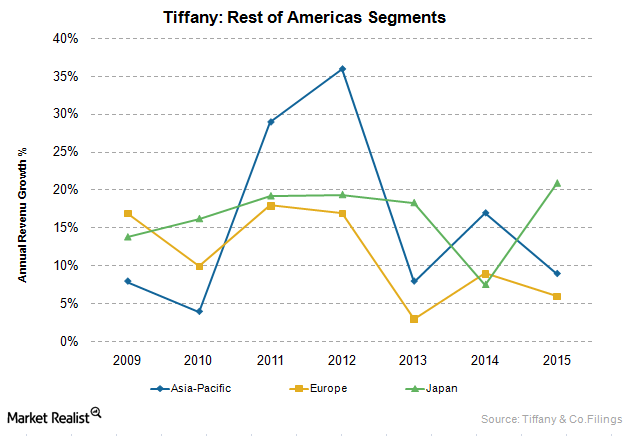
Analyzing Tiffany & Co.’s International Segments
Tiffany & Co. has presences to differing degrees in the Asia-Pacific, Japan, Europe, and Other regions.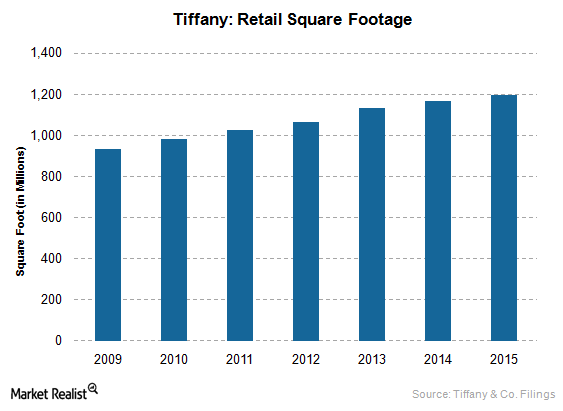
Analyzing Tiffany’s Key Strategic Objectives
Tiffany’s key strategic objectives for growth include expanding marketing communications, opening stores in key markets, and enhancing in-store experience.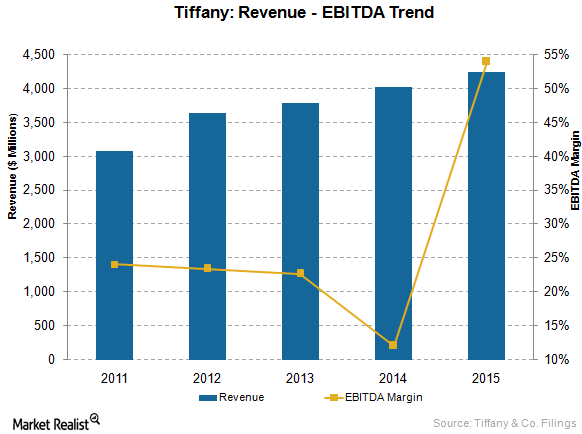
A Must-Know Business Overview of Tiffany & Co.
Tiffany & Co. is a holding company that operates through its subsidiary companies. The most notable is Tiffany & Company, a jeweler and specialty retailer.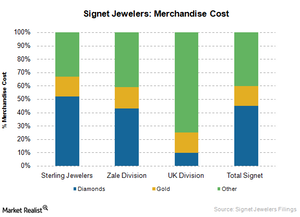
Signet Jewelers’ Aim to Improve Vertical Integration and Supply Chain
Signet aims to advance its vertical integration, including the sourcing and manufacturing of rough diamonds, which should help improve its supply chain.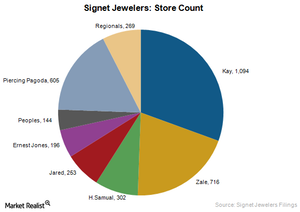
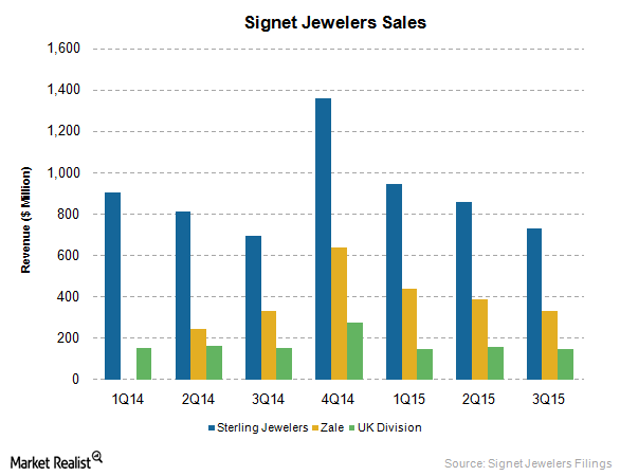
A Snapshot of Signet Jewelers’ Divisions and Product Offerings
Signet Jewelers operates under three divisions: the Sterling Jewelers division, the Zale division, and the UK Jewelry division.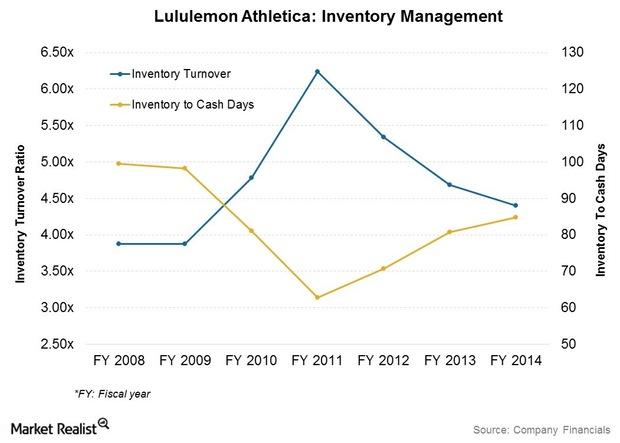
Lululemon’s Retail Inventory Management Strategies Are Crucial
These changes should lower future inventory levels and probably result in higher inventory turnover and lower inventory-to-cash days.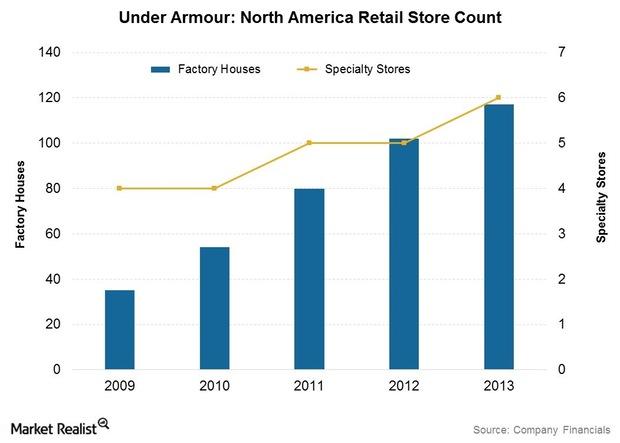
The Cogs In The Under Armour Supply Chain
Under Armour: Sourcing, manufacturing, and distribution decisions Under Armour, Inc. (UA) manufactures virtually nothing in-house. Production is outsourced to third-party manufacturers overseas. This is common practice in the apparel industry among companies including the The Gap, Inc. (GPS) and Fossil, Inc. (FOSL). These companies are held by the Consumer Discretionary Select Sector SPDR ETF (XLY), as are United Armour, or […]