How Does the US Dollar Affect Natural Gas Prices?
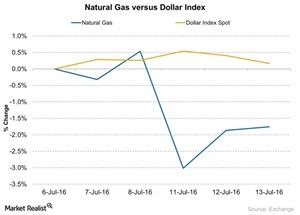
Between July 6 and July 13, 2016, natural gas (UNG) (DGAZ) (BOIL) (GASL) (GASX) (DGAZ) (FCG) futures fell by ~1.8%, and the US Dollar Index (UUP) rose by ~0.17%.
July 14 2016, Published 11:04 a.m. ET

Natural gas and the US dollar index
Between July 6 and July 13, 2016, natural gas (UNG) (DGAZ) (BOIL) (GASL) (GASX) (DGAZ) (FCG) futures fell by ~1.8%, and the US Dollar Index (UUP) rose by ~0.17%. The dollar strengthened after the Brexit vote.
In the last five trading sessions, natural gas futures and the US Dollar Index moved in opposite directions in four instances. The correlation between the two over the last five trading sessions was -68.5%. This illustrates an inverse relationship between natural gas and the US Dollar Index, which is similar to the relationship between the US dollar and crude oil.
Natural gas price movements
On May 2, 2016, the US Dollar Index closed at 92.62, its lowest level year-to-date. Between May 2 and July 13, the US Dollar Index rose by ~3.9% while natural gas futures rallied by 34.0%.
Between May 2 and July 8, the US Dollar Index and natural gas prices moved in opposite directions based on the closing price in 26 out of 50 trading sessions. This isn’t enough evidence to point to an inverse relationship between the two like the relationship between the US dollar and crude oil.
This analysis could be important for natural-gas-weighted stocks such as Range Resources (RRC), Antero Resources (AR), Rex Energy (REXX), Gulfport Energy (GPOR), EXCO Resources (XCO), Contango Oil & Gas (MCF), and Memorial Resource Development (MRD). Broader economic developments can move the US dollar and the broader markets.
