Consumer Staples Select Sector SPDR® ETF
Latest Consumer Staples Select Sector SPDR® ETF News and Updates
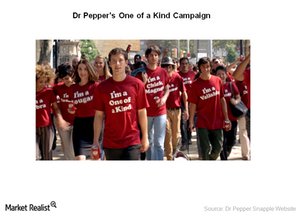
Dr Pepper Snapple targets key demographics in advertising campaigns
Dr Pepper Snapple is targeting Hispanics and Millennials in its advertising. By 2020, Hispanics will make up 19% of the US population. Millenials represents 24%.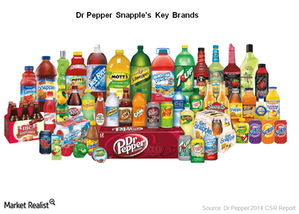
An overview of Dr Pepper Snapple’s key brands
Canada Dry, 7UP, A&W, and Sunkist are Dr Pepper Snapple’s Core 4 brands. Noncarbonated beverages include ready-to-drink tea, juice, juice drinks, and mixers.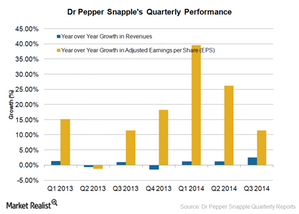
Dr Pepper Snapple’s recent performance and the road ahead
Dr Pepper Snapple expects its fiscal 2014 revenues to increase by 1%. Investors should be cautious since the company expects an impact from higher transportation and marketing costs.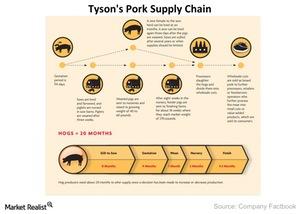
Tyson Foods Pork Biz In The Top Three
The Tyson Foods Pork segment processes live hogs into primal, sub-primal cuts, case-ready pork ready to be sold at retail stores, and fully cooked products.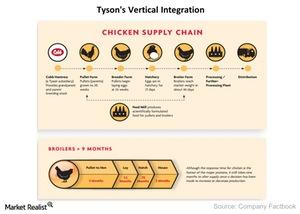
Vertical Integration Keeps Tyson Foods On Top Of Chicken Market
Vertical integration involves a single company owning and controlling all the various stages in the production chain.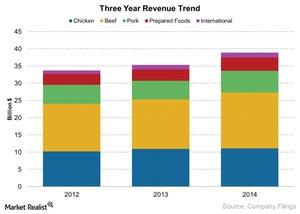
Tyson Foods Revenue Segments
Tyson Foods revenue is reported in five segments: Beef, Chicken, Pork, Processed Foods, and International. The Beef segment accounted for 43% of revenues.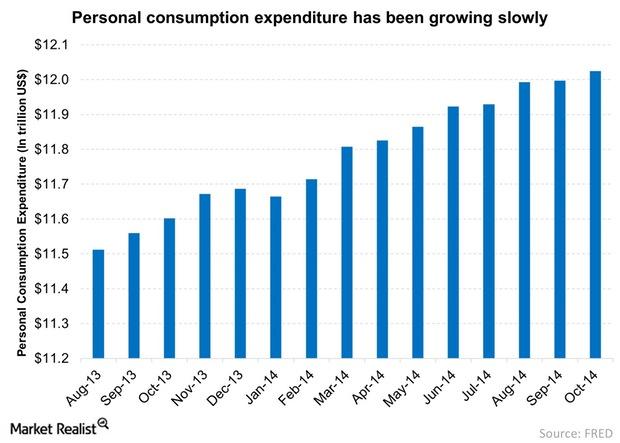
Personal Consumption Expenditure Remains Low
Slow growth in personal consumption expenditure may affect growth. Currently, personal consumer expenditure is $12 trillion. This is ~70% of the GDP.
The Coca-Cola Company versus PepsiCo: A battle of giants
The Coca-Cola Company (KO) and Pepsico, Inc. (PEP), are dominant players in the soft drinks market. Both companies own a strong portfolio of liquid refreshments and several brands.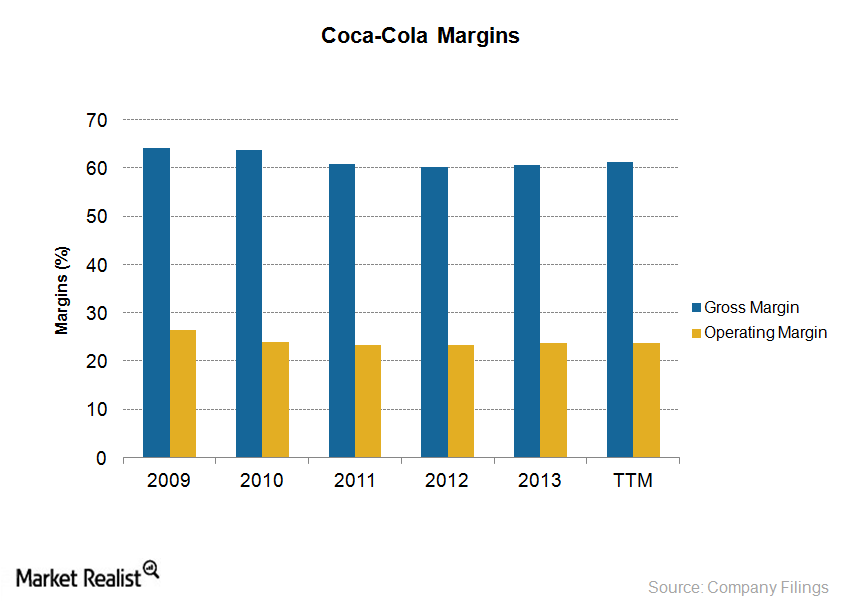
Coca-Cola fights declining margins with productivity measures
The Coca-Cola Company (KO) has been implementing several efficiency initiatives to offset the impact of adverse market conditions and declining demand for carbonated soft drinks.Company & Industry Overviews Why Pilgrim’s Pride filed for bankruptcy
The primary reason why Pilgrim’s Pride filed for Chapter 11 bankruptcy was the burden of total debts in the amount of $1.9 billion.Company & Industry Overviews Pilgrim’s Pride Corporation’s three customer categories
Pilgrim’s customer base is spread across 100 countries, including the US and Mexico, which together contributed ~92% of the company’s revenues as of 2013 year-end.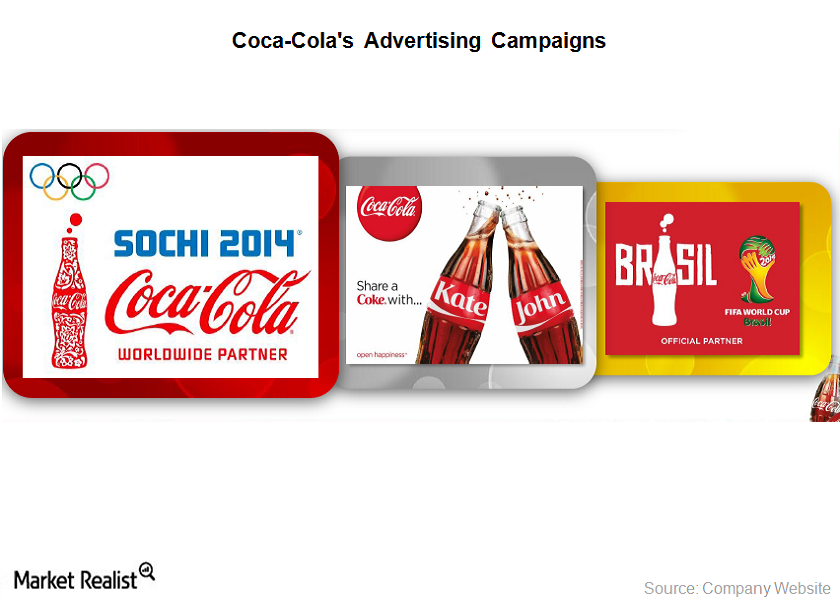
Advertising is a key strategy for Coca-Cola’s growth
In 2013, Coca-Cola spent $3.37 billion, or 7.0% of it’s 2013 revenues, on advertising—including in-store activations, loyalty points programs, and point-of-sale marketing.Company & Industry Overviews The importance of Coca-Cola’s iconic brand name
Coca-Cola enjoys huge popularity across the world. The company ranked third in Interbrand’s 2014 world’s most valuable brands list, with an estimated brand value of $81.6 billion.
Investing in Coca-Cola: The world’s largest soft drink company
The Coca-Cola Company (KO), founded in 1892, is the world’s largest soft drink maker. It sells more than 3,500 products worldwide.Company & Industry Overviews International growth opportunities for the soft drink industry
Growing populations and better standards of living in emerging markets will drive demand for beverages. The long-term prospects for growth in emerging economies are promising.Company & Industry Overviews Why growth is sluggish in the non-alcoholic beverage industry
The World Health Organization suggests that sugar should account for only 5% of total energy intake per day. A single soda can contains around 40 grams of sugar.Company & Industry Overviews Why the soft drink industry is dominated by Coke and Pepsi
Coca-Cola and PepsiCo spend enormous amounts of money on innovation, advertising and marketing, and on strengthening their distribution network. It would be difficult for a new entity to make the substantial capital investments required to compete with these firms.Company & Industry Overviews The role of branding and advertising in the soft drink industry
Soft-drink makers continually invest in branding. In 2013, Coca-Cola and PepsiCo spent $3.3 billion and $3.9 billion, respectively, on advertising and marketing activities.Company & Industry Overviews Understanding the soft drink industry’s key markets
Market intelligence firm Euromonitor International estimates the middle class around the world will include 1.5 billion households by 2020, a 25% rise over 2012.Company & Industry Overviews Key indicators of the non-alcoholic beverage industry
US consumption spending accounts for over two-thirds of the country’s gross domestic product. A favorable trend in consumer spending on non-durable goods is a positive indicator for the non-alcoholic beverage industry.Company & Industry Overviews Understanding the value chain of the soft drink industry
Coca-Cola and PepsiCo’s wide distribution network gives them significant pricing power. Carbonated soft drinks have similar prices due to the intense competition in the industry.Company & Industry Overviews Understanding consumer craving for soft drinks
Soft drinks contain considerable amounts of sugar, which is a form of carbohydrate. Consumption of excess sugar releases a hormone called dopamine, which induces pleasure in the brain. Caffeine, another key ingredient, stimulates the nervous system.Company & Industry Overviews A guide to the non-alcoholic beverage industry
The non-alcoholic beverage industry broadly includes soft drinks and hot drinks. In the US, soft drinks, or liquid refreshment beverages, lead food and beverage retail sales. In this series, we’ll focus on the soft drinks market.
