General Growth Properties Inc
Latest General Growth Properties Inc News and Updates
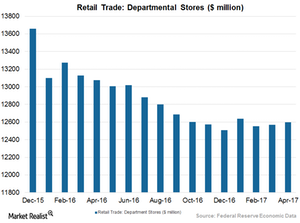
GGP and Other Retail REITs Struggle to Exist in Digital Era
During 1Q17, General Growth Properties’ (GGP) occupancy rate (same-store leased percentage) fell to 95.9% from 96.6% in 1Q16.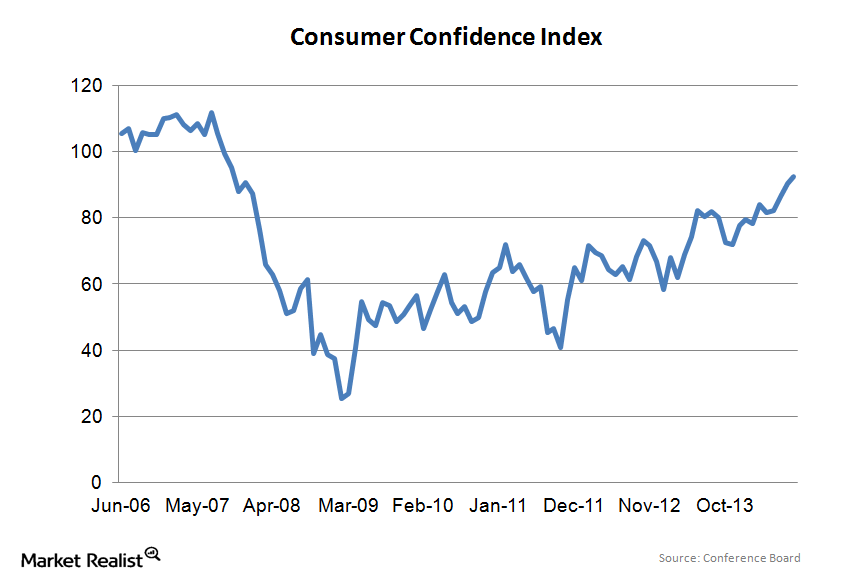
Why rising asset prices are driving consumer confidence higher
The CCI is one of the oldest consumer surveys, originally started as a mail-in survey in 1967. It asks respondents whether certain conditions are positive, negative, or neutral.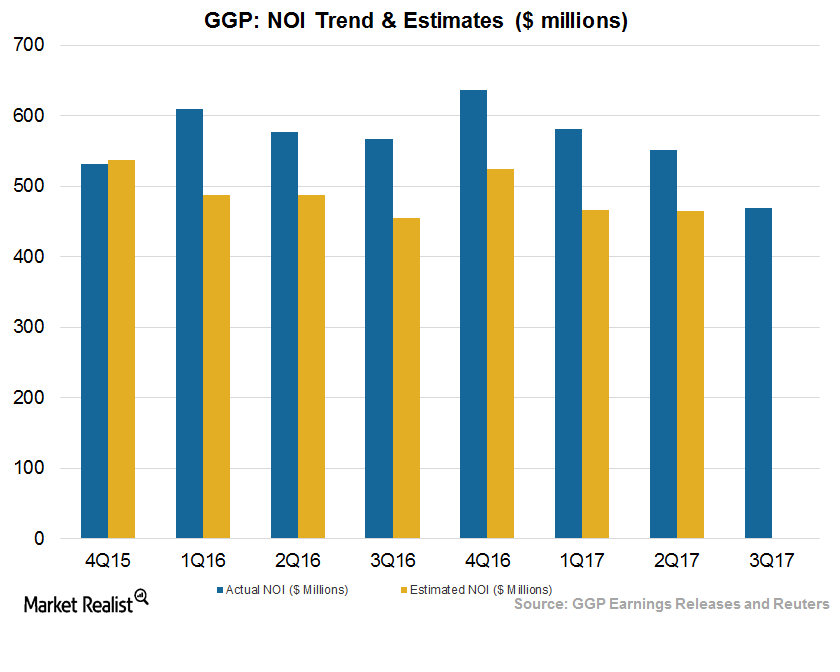
How GGP Managed Its Expenses in 2Q17
In 2Q17, GGP (GGP) reported NOI (net operating income) of $551.0 million, which came in higher than the previous year at $554.0 million.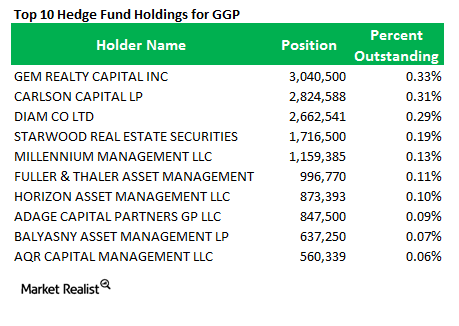
Why did Ackman’s Pershing Square exit General Growth Properties?
Last week, Pershing Square exited its entire stake in General Growth Properties.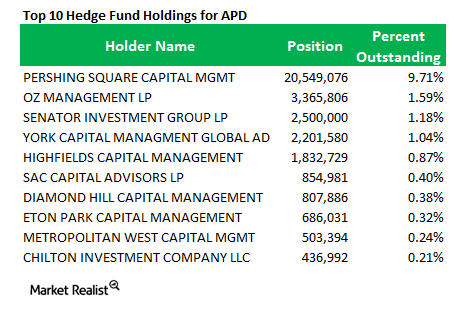
Why Pershing Square increased its stake in Air Products and Chemicals
Pershing Square increased its position in Air Products and Chemicals, Inc. from 21.31% in 3Q 2013 to 27.91% in 4Q 2013.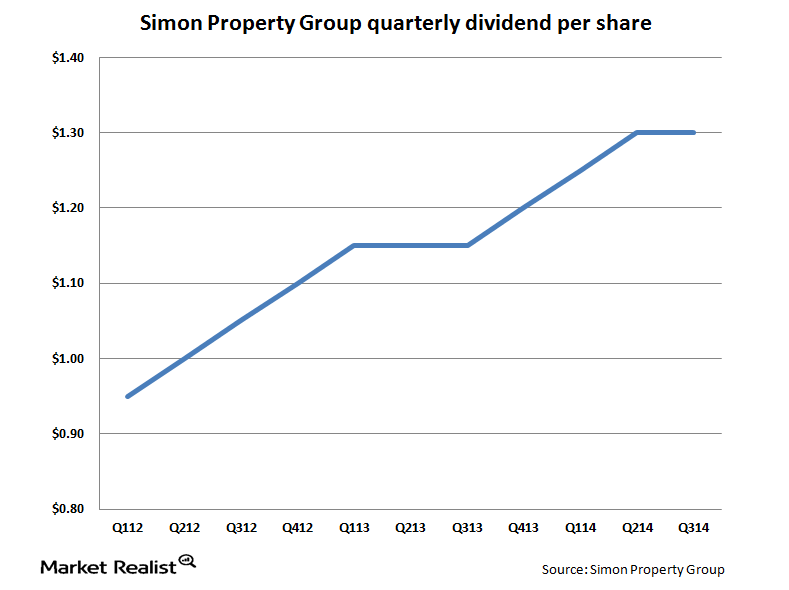
Simon Property Group faces competition from online retailers
Simon Property Group is by far the biggest shopping center REIT in the U.S., with a market capitalization of $53 billion. The next biggest REITs are less than half Simon’s size.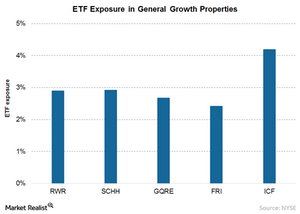
How to Invest in General Growth Properties through ETFs
General Growth Properties has a market cap of $22.1 billion, is part of S&P 500 index, and sees allocation in the major REIT-specific ETFs like ICF.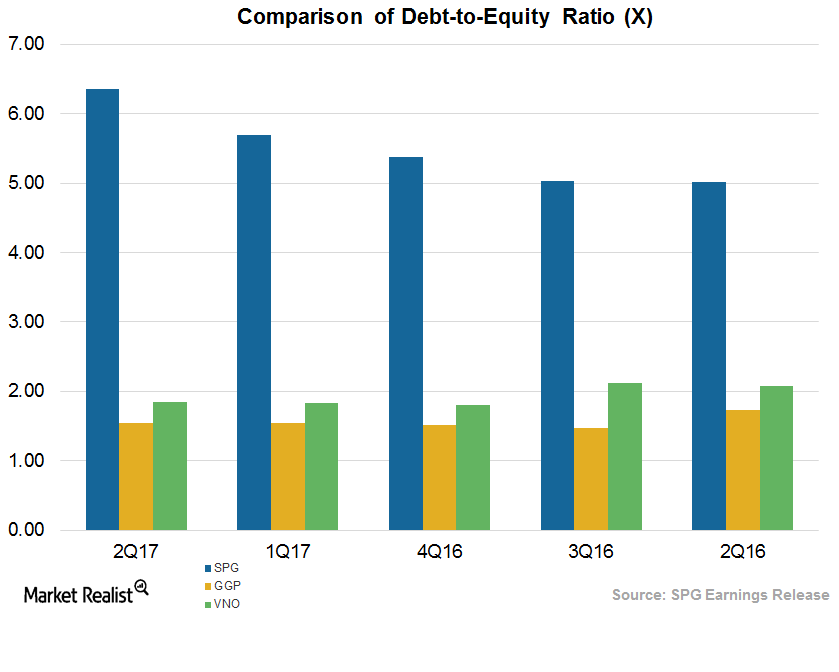
Commercial REITs Have Higher Debt-to-Equity Ratios
GGP’s (GGP) debt-to-equity was 1.55x for 2Q17, which was higher than the industrial mean of 1.07x. As of 2Q17, GGP had $2.0 billion of liquidity.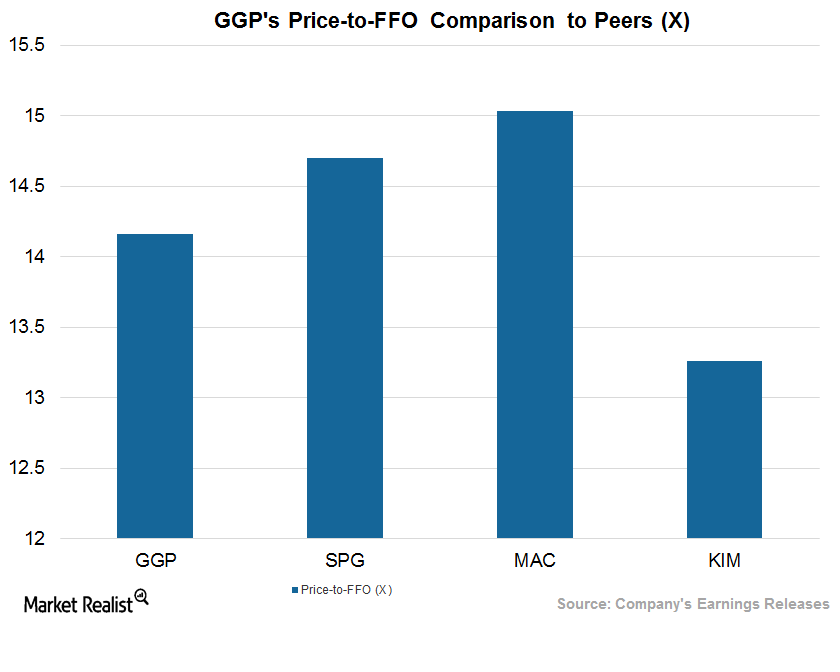
How GGP Stacks Up against Its Peers after 2Q17
GGP’s estimated price-to-FFO multiple for fiscal 2018 is 14.2x, which is at a premium compared to its peers.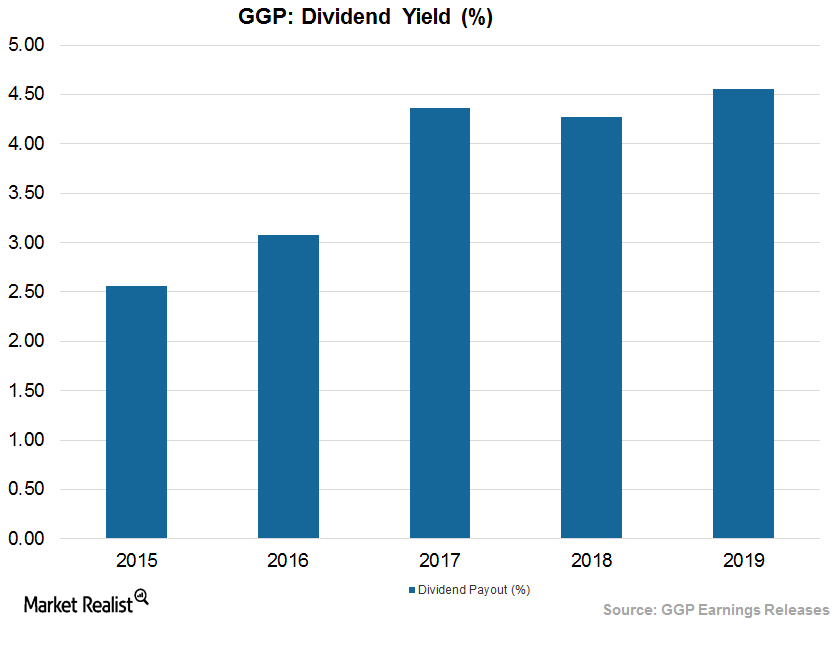
GGP’s Generous Return to Stockholders in 2Q17
In 2Q17, GGP (GGP) paid $17.5 million in dividends to its shareholders. That was higher than $13.3 million paid a year ago.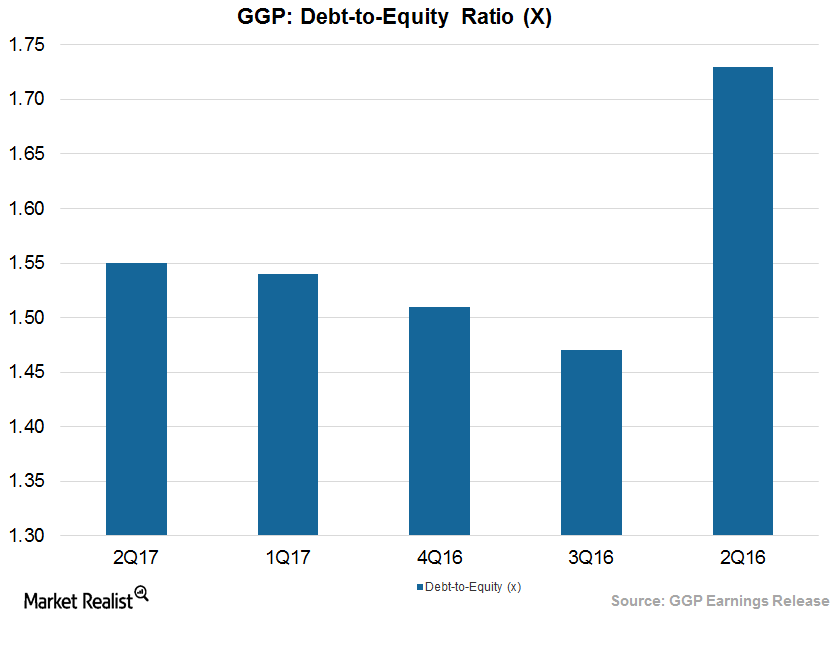
GGP Has High Debt-to-Equity Ratio as of 2Q17: Can It Be Lowered?
GGP maintained a debt-to-equity ratio of 1.55x for 2Q17. That was higher than the industrial mean of 1.07x.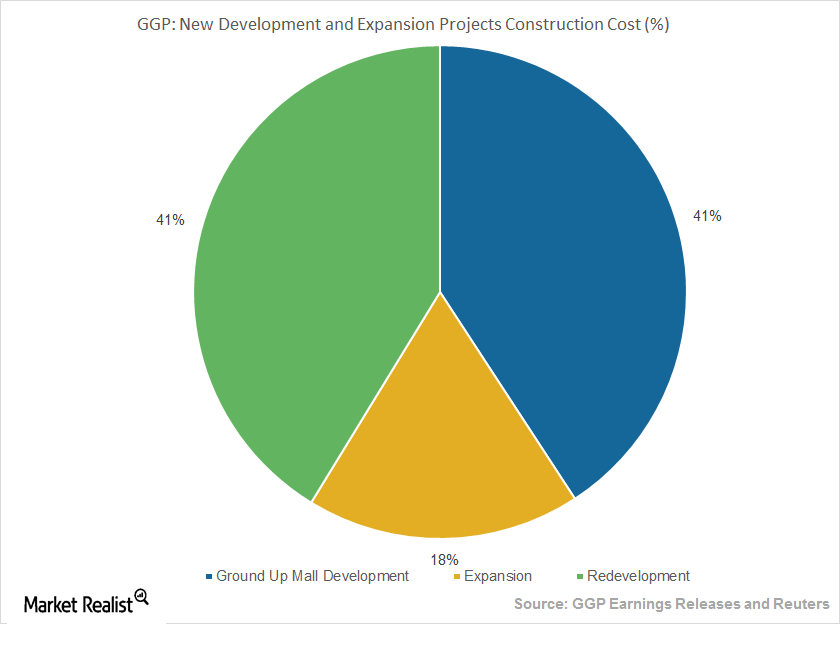
GGP Grew in 2Q17 Due to Development and Redevelopment
GGP has redeveloped its vacant spaces for non-retail uses such as restaurants, entertainment zones, fitness centers, and grocery stores.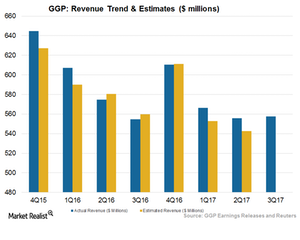
What Caused GGP’s Soft Rent Growth in 2Q17?
GGP’s (GGP) minimum rent fell by $17.0 million in 2Q17, mainly because of dilution resulting from the sale of an interest in the Fashion Show Mall in Las Vegas n 2016.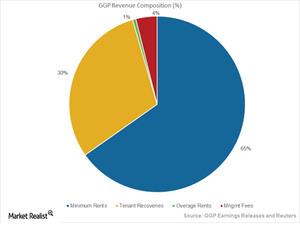
GGP’s Revenue Rode High in 2Q17, Backed by New Leases
GGP’s minimum rent fell 3.9% to $349.2 million, and tenant recoveries fell 4.6% to $161.9 million. Overage rent fell 25.0% to $3.3 million.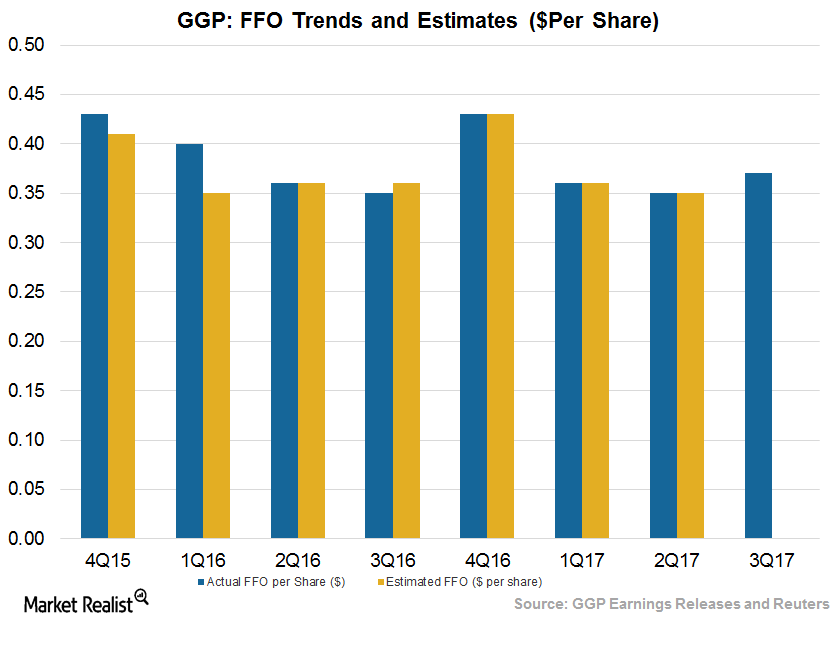
GGP’s 2Q17 Results from an Investor’s Perspective
GGP (GGP) reported funds from operations (or FFO) of $0.35 per share, which was in line with Wall Street estimates. Adjusted FFO remained flat year-over-year.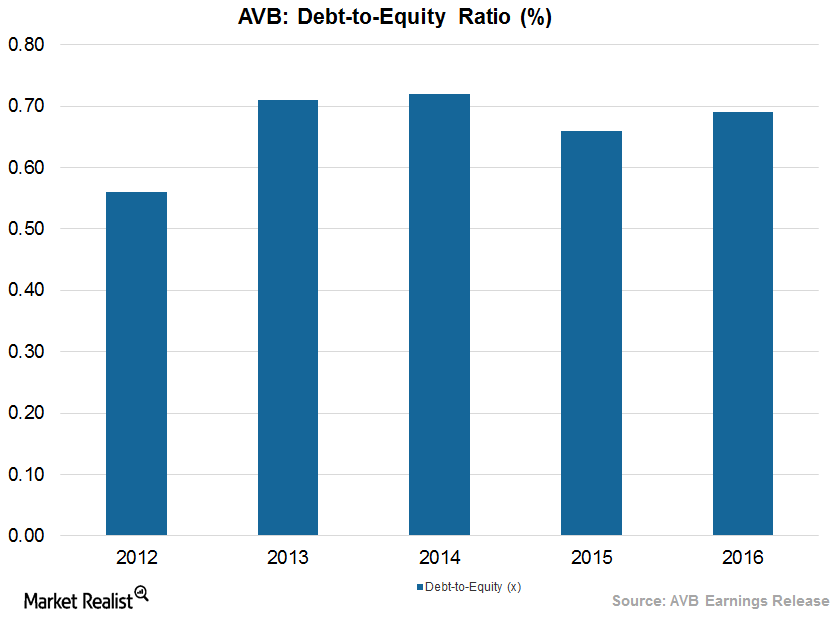
How AvalonBay Communities Leverages Its Balance Sheet
AvalonBay has been able to maintain a low debt-to-equity ratio in the last five years. The company reported a debt-to-equity ratio of ~1.5x in 1Q17.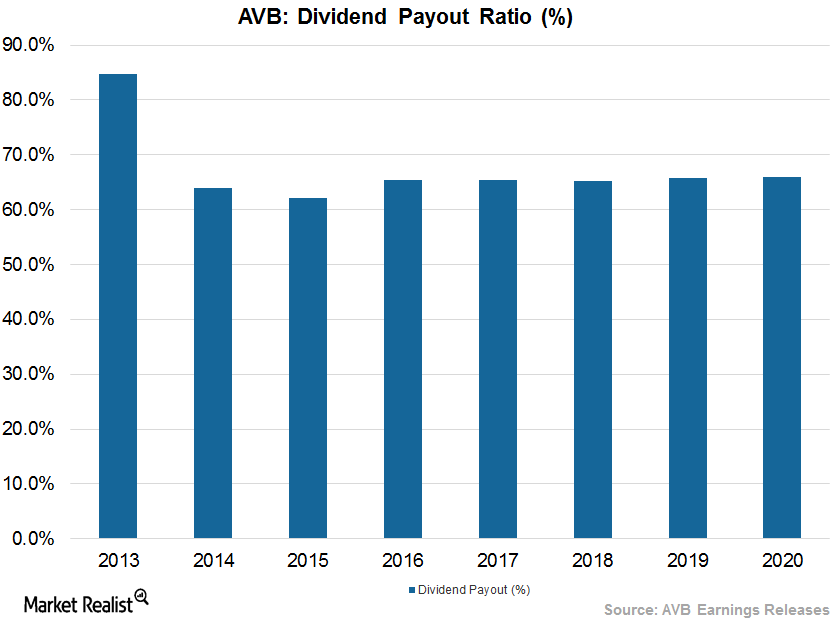
AvalonBay Communities: A Rewarding Stock for Shareholders
During 2016, AvalonBay Communities (AVB) repurchased 57,172 shares worth $0.6 million.
The Impact of Trump’s Proposed 2018 Budget on Residential REITs
According to President Trump’s proposed budget for fiscal 2018, the administration is expected to slash $6 million from the U.S. Department of Housing and Urban Development budget, decreasing its funding by 13.2% to $40.7 billion.
AvalonBay Communities and the Residential REIT Industry Overview
According to NHAB’s Housing Economics survey, housing starts are expected to rise 6.2% in 2017 and ~6.3% in 2018, backed by respective 9.6% and ~11.8% gains in single-family home sales.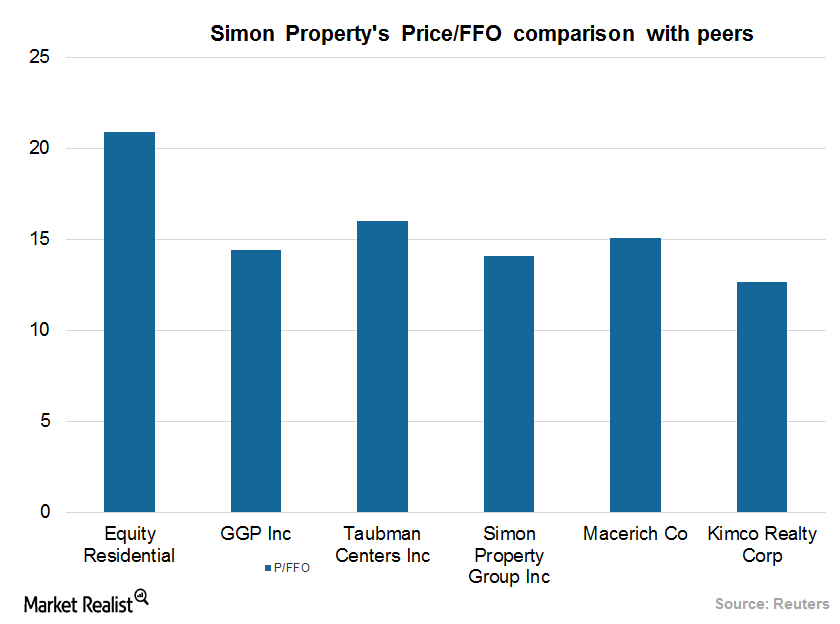
Investing in Simon Property Group: Relative Valuation
Simon Property Group’s current price-to-FFO multiple is ~14.1x.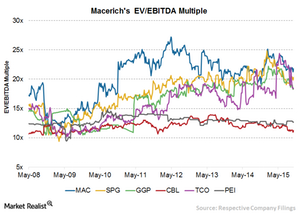
Macerich’s Highest EV-to-EBITDA Multiple Compared to Peers
Over the past eight years, Macerich’s EV-to-EBITDA has ranged between 11.9x–27.2x, with a current EV-to-EBITDA multiple of around 21.8x.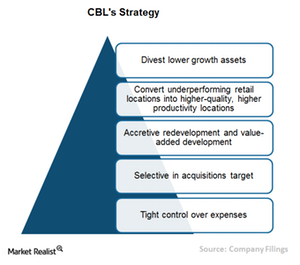
How CBL Plans to Increase Shareholder Returns
CBL’s (CBL) long-term strategy is to maximize shareholder returns while maintaining prudent risk profile.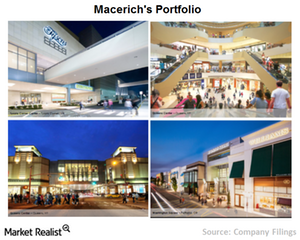
Investing in Macerich: a Must-Know Company Overview
Macerich is a self-managed REIT headquartered in Santa Monica, California. The company was founded in New York in 1964.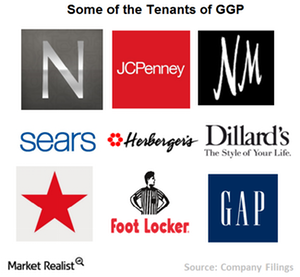
General Growth Properties’ Top Tenants in Retail
The malls in GGP’s portfolio receive a smaller percentage of their operating income from anchor tenants than from specialty retailers who lease space.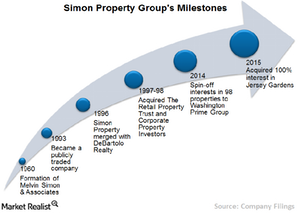
Introducing Simon Property Group: A Must-Know Company Overview
Headquartered in Indianapolis, Simon Property Group formed in 1993 when the shopping center division of Melvin Simon & Associates became publicly-traded.
