Iamgold Corp
Latest Iamgold Corp News and Updates
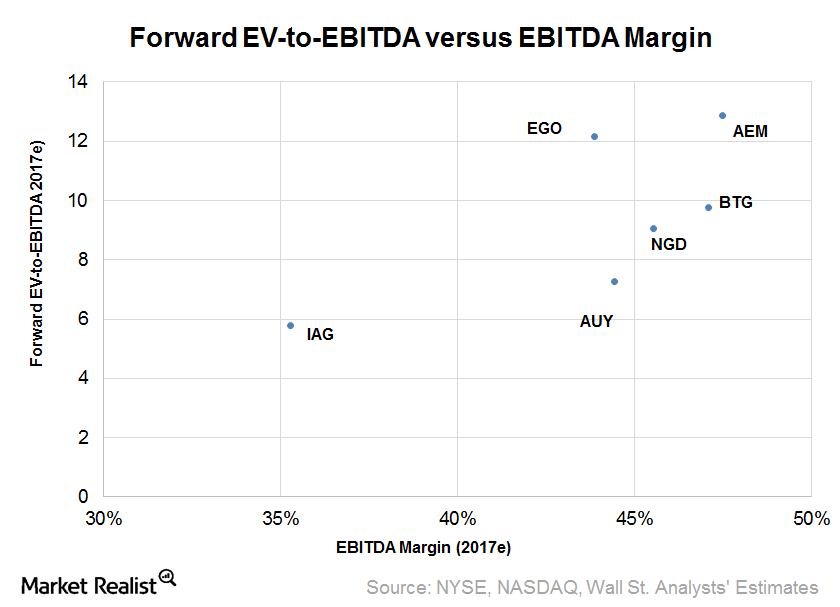
What Could Drive IAMGOLD Corp.’s Valuation Going Forward?
IAG stock could continue to gain traction due to its high operational leverage, at least as long as the upward trend in gold prices continues.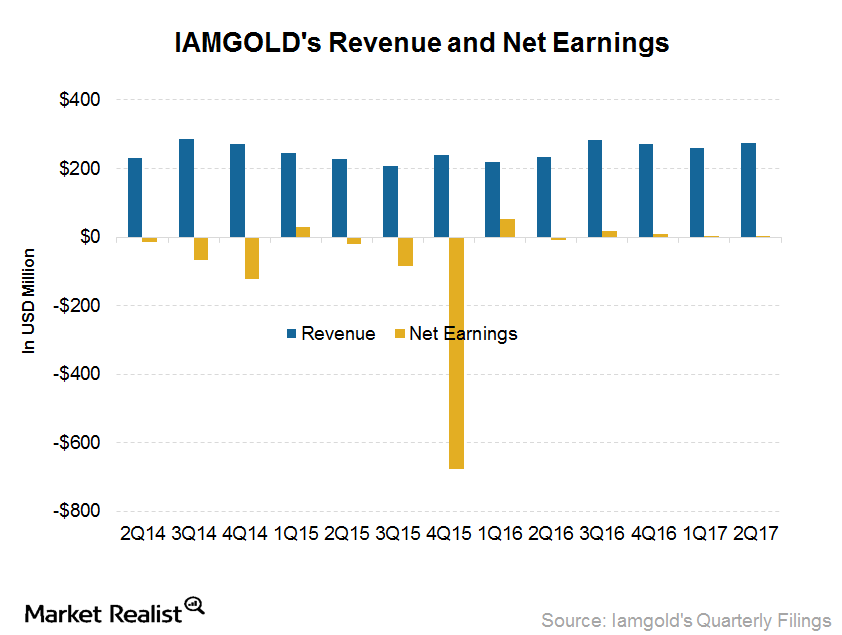
Understanding IAMGOLD’s 2Q17 Earnings Highlights
IAMGOLD’s (IAG) 2Q17 production was 223,000 ounces of gold—growth of 26,000 ounces or 13% year-over-year (or YoY).
Which Gold Stocks Do Analysts Love and Hate?
Gold price’s reversal this year has created opportunities in gold stocks. The SPDR Gold Shares ETF (GLD) had gained 11% year-to-date as of Friday.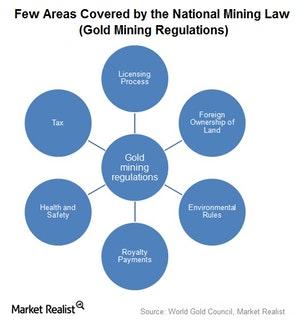
How Strict Is the Gold-Regulated Market?
Bitcoin (ARKW) has seen its price plunge since the start of 2018 due to news that world leaders are planning to implement regulations on digital currencies.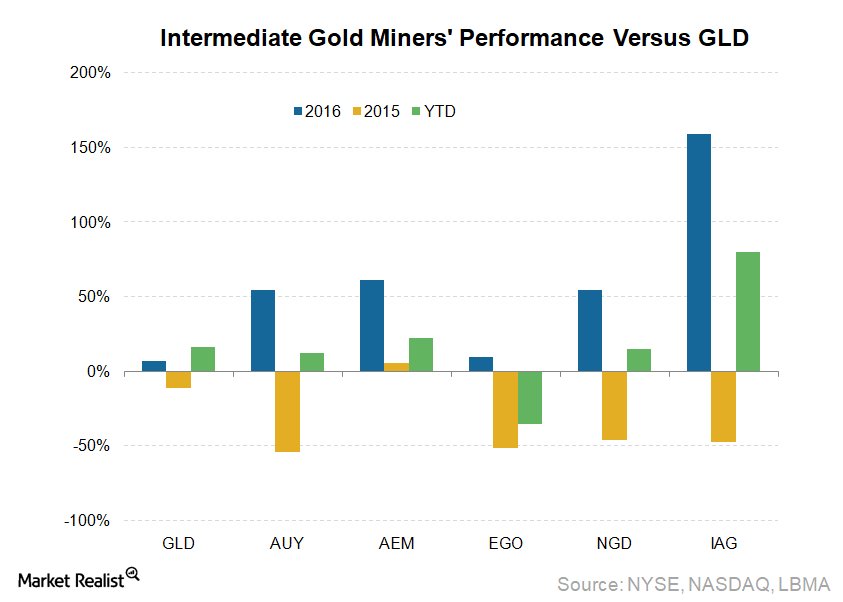
Why Are Intermediate Gold Miners so Exuberant?
Intermediate gold miners are smaller than senior gold miners in terms of production and market capitalization, but they are still generally liquid.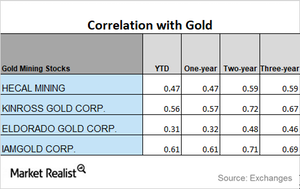
Correlation Reading of Miners and Funds in the Last 3 Years
During the past year, IamGold has seen the highest correlation to gold, while Eldorado Gold has the lowest correlation.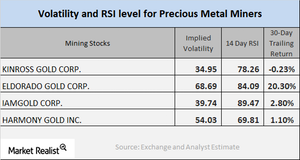
Reading Key Mining Stock Technicals as of December
Most of the mining companies have increased during the past two weeks due to the rise of gold and silver.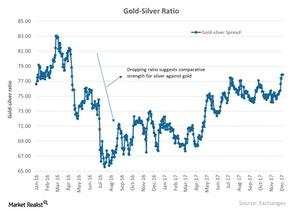
A Brief Look at December 2017’s Precious Metal Spread Measures
In this article, we’ll discuss the gold-silver, gold-platinum, and gold-palladium spreads. These three spreads stand at 77.9, 1.38, and 1.23, respectively.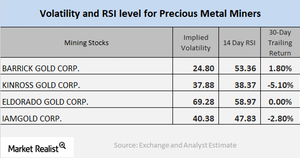
Reading Miner Volatility in December 2017
In this article, we’ll take a look at the call-implied volatilities and RSI scores of Barrick Gold, Kinross Gold, Eldorado Gold, and IAMGOLD.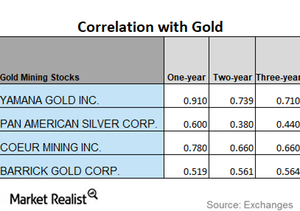
Correlation and Mining Stocks this Month
We’ll briefly analyze mining stocks’ correlation with gold. Gold is the most crucial of the precious metals, and mining stocks tend to increasingly take their price changes from gold.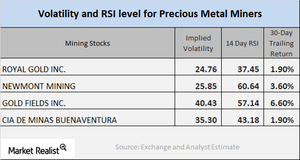
Analyzing Mining Stocks’ Technical Indicators
Gold Fields, Coeur Mining, Hecla Mining, and IamGold have call implied volatilities of 40.4%, 46.7%, 33.6%, and 44.3%, respectively.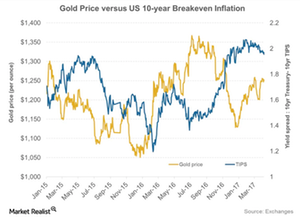
How Inflation Becomes a Core Determinant of the Price of Gold
The possible interest rate hike is taking a lot of market participants’ attention. Many policymakers are also focusing on inflation numbers.
Who’s Pro Gold and Who’s Not?
Geopolitical events like the tensions with North Korea helped drive the price of gold higher in September 2017.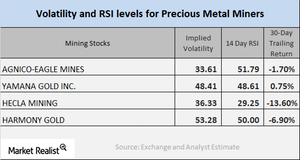
Mining Stocks: Analyzing the Technical Details
In this part, we’ll concentrate on the technical readings of key mining stocks, including their call implied volatilities and RSI (relative strength index) levels.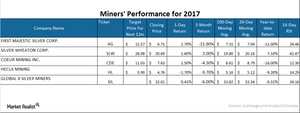
A Look at Mining Stocks’ Price Movement
Mining stocks’ reaction On Tuesday, October 31, precious metal mining stocks fell, following precious metals. In this part of our series, we’ll look at the moving averages and returns of four key mining stocks: Silver Wheaton (SLW), Hecla Mining (HL), Alacer Gold (ASR), and IAMGOLD (IAG). Hecla Mining and Alacer Gold have fallen 9.9% and 10.3%, respectively, YTD […]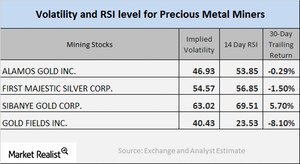
The Importance of Knowing the Technicals of Mining Stocks
On October 30, 2017, ABX, AU, KGC, and IAG had call implied volatilities of 29.1%, 40.9%, 41.6%, and 44.3%, respectively.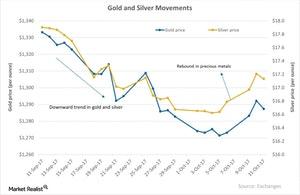
The Reaction of Precious Metals on October 11
The last few days have seen a rise in precious metal prices. However, on Wednesday, October 11, 2017, the prices of these loved metals fell.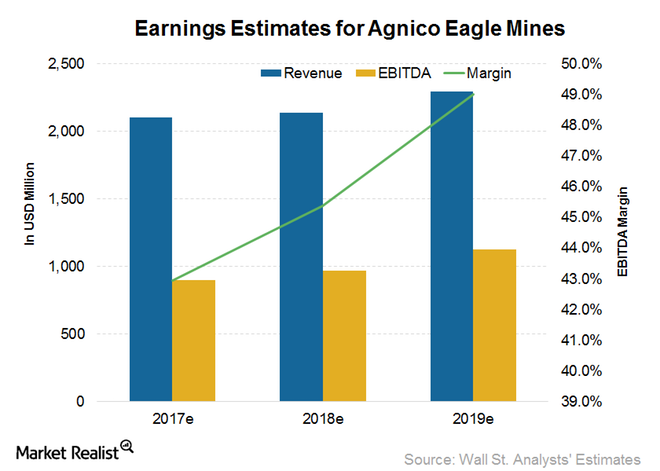
How Analysts Estimate Agnico Eagle Mines’ Earnings in 2017 and Beyond
Despite just 0.7% expected growth in revenues for 2017, Agnico Eagle Mine’s EBITDA is expected to grow 5.6% YoY in 2017.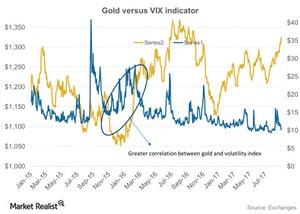
How North Korea Has Affected the Precious Metal Market
Precious metals have been buoyed by tension in North Korea. If North Korea does another missile test, it could prompt investors to move to haven assets such as gold, silver, Treasuries, and major currencies.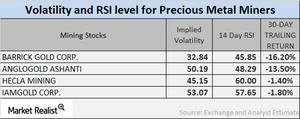
Volatility for Precious Metal Miners: Movement Going Forward
The ETFS Physical Swiss Gold (SGOL) and the ETFS Physical Silver (SIVR) have risen 8.5% and 4.1%, respectively, on a year-to-date basis as of May 18, 2017.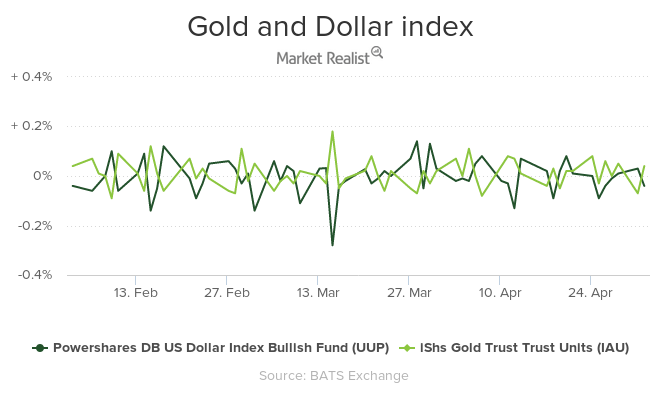
Global Tremors, the Dollar, and Gold in Early May
Geopolitical risks had been playing on haven bids for precious metals, but now, we may be seeing to be a temporary respite—however brief—from global worries.
Behind Mining RSI Levels and Volatility Now
Leveraged mining funds including the Direxion Daily Gold Miners (NUGT) and the Proshares Ultra Silver (AGQ) saw big jumps in early 2017 due to the revival in precious metals.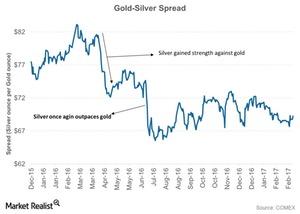
Analyzing the Gold-Silver Spread as Investors Await Further Cues
When analyzing the precious metals market, it’s important to take a look at the relationship between gold (SGOL) and silver (SIVR).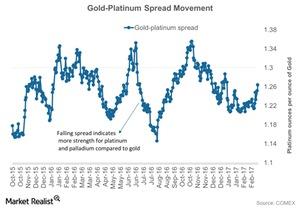
Where’s the Platinum Spread Headed in 2017?
Among the four precious metals, platinum has been the worst-performing precious metal and has seen a year-to-date rise of only 5.8%.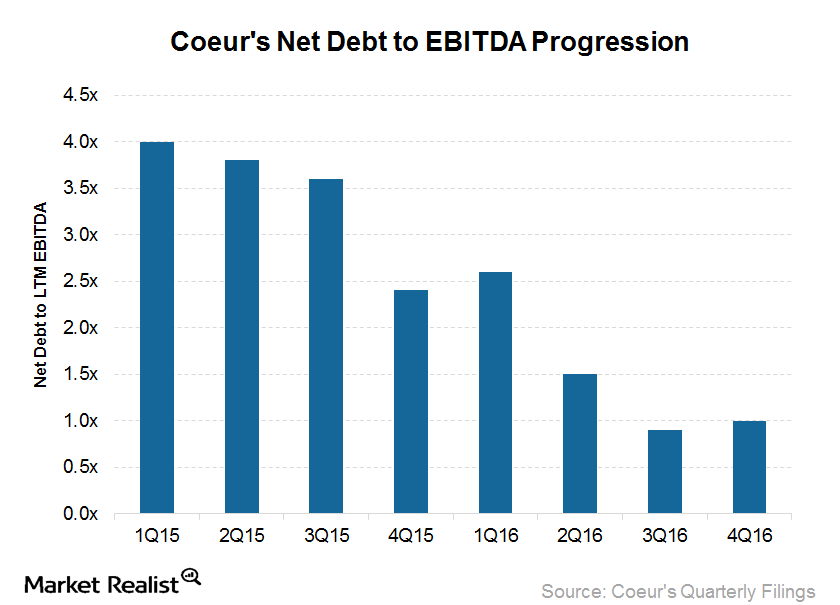
Coeur’s Financial Leverage Improves: A Word of Caution
Coeur Mining (CDE) ended 2016 with an outstanding debt of $210.9 million. That’s 57.0% less than at the end of 2015.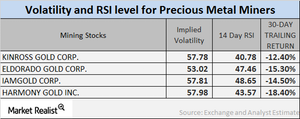
Reading Mining Companies’ Volatilities and RSI Levels
Mining companies’ volatilities are significant to the buying process. The mining shares we’ve selected in this article are Kinross Gold, Eldorado Gold, IAMGOLD, and Harmony Gold.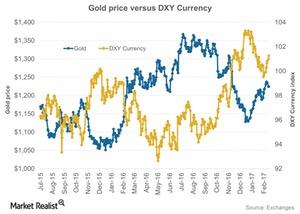
Why Gold and the US Dollar Are Moving in Opposite Directions
Gold prices tumbled on Tuesday, February 14, as the US dollar rose after the US Federal Reserve chair, Janet Yellen, seemed optimistic about raising interest rates.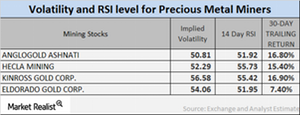
What the Latest Volatility and RSI Numbers Indicate
It’s important to monitor the implied volatilities of large mining stocks as well as their RSI levels, particularly after changes in precious metal prices.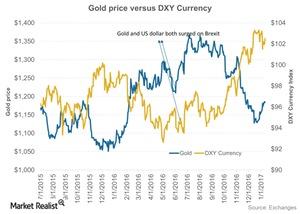
How GDP Numbers Impacted Gold and the Dollar
The reason behind the fall of the dollar on Friday, January 27, 2017, was lower-than-expected GDP numbers. The DXY ended the day 0.10% higher.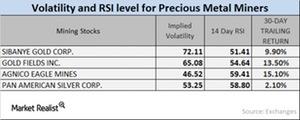
Why Mining Stocks Are Seeing Rising RSI Levels
In this part, we’ll look at the implied volatilities of large mining stocks and their RSI levels in the wake of precious metal prices.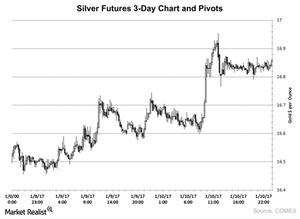
Analyzing Silver’s January Technicals
Among the other precious metals trading on the COMEX, silver shares for March expiration maintained an almost flat end to the day on January 11, 2017.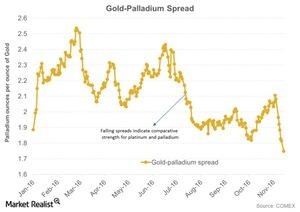
How Palladium Outperformed Gold: The Gold-Palladium Spread
Palladium has seen a year-to-date rise of a whopping 32.5%, which is higher than the rise in platinum, silver, and gold. Earlier, palladium was underperforming its precious metal peers.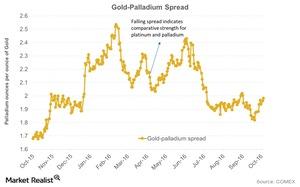
What’s Affecting the Gold-Palladium Spread?
Palladium has seen a year-to-date rise of 24.9%, which is higher than the increase in platinum, silver, and gold.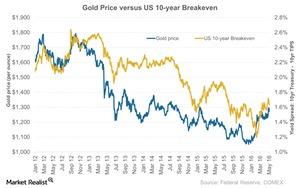
Are Inflation Concerns Likely to Boost Gold’s Performance?
The difference between yields on ten-year US notes and similar-maturity TIPS, a gauge of price expectations, expanded to as much as 1.7% last Tuesday.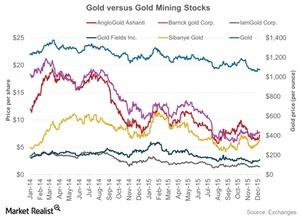
How the Gold Price Is Influencing Pure Gold Miners
In the precious metals mining industry, there are some stocks that to an extent follow the price and market sentiment of the precious metals.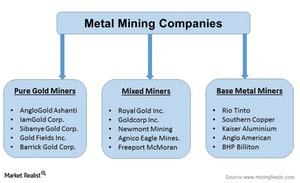
2015 Has Been Hard on Mining Companies
2015 has been tough for miners, especially due to the price rout in the commodities market. The commodities market has fallen about 24.3% since the start of the year.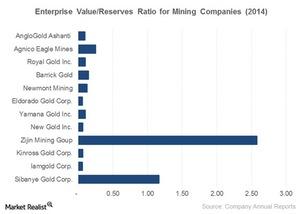
Analyzing the EV-to-Reserves Ratio for Tracking Miners
The EV-to-reserves ratio is good for the mining industry. “Enterprise value” reflects the company’s total value. “Reserves” refers to geologic reserves that the business owns.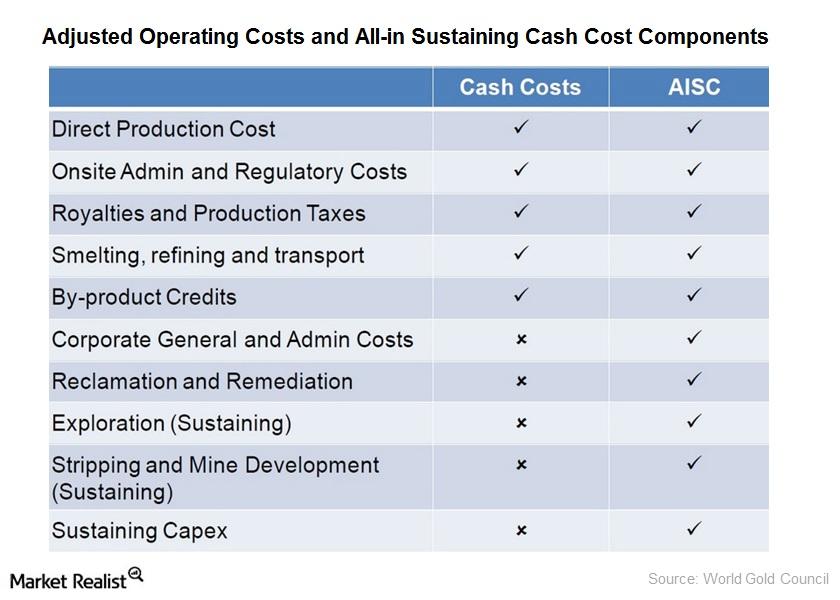
Key for Investors: Understanding Mining Cost Structures
The cash cost has been the dominant measure of the gold mining cost structure. It represents what the mine costs are for each ounce of gold.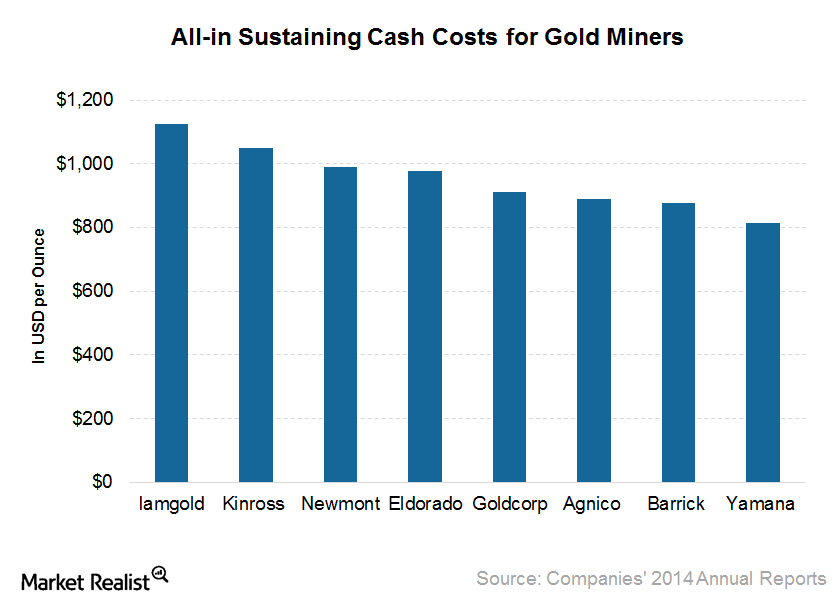
At What Cost Are Gold Miners Digging Out Gold This Year?
The average AISC for eight significant gold miners for 2015, as guided, is $950 per ounce compared to $900 per ounce for 1Q15.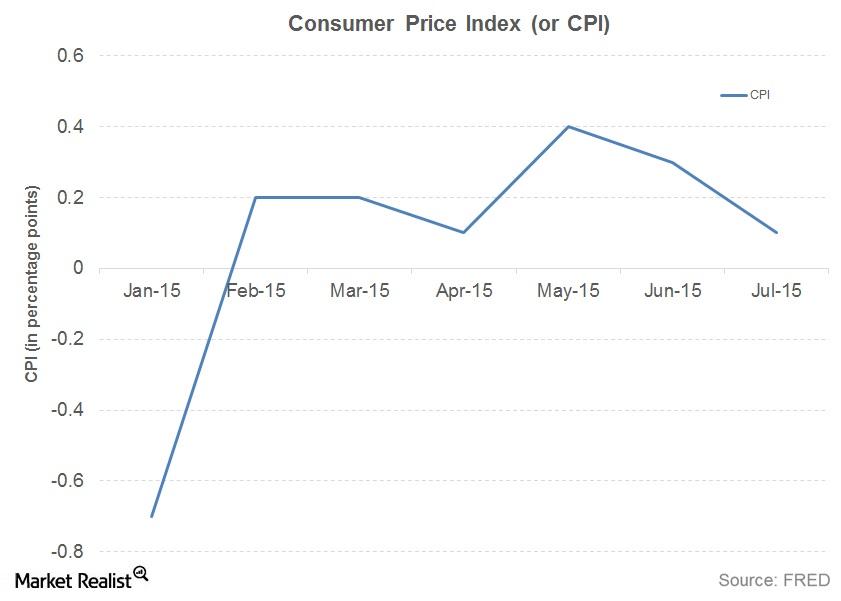
Inflation Rates: How They’re Related to Precious Metals
With the looming fears of inflation reaching its target 2% level, the Fed is likely waiting for assertions from the economy.
