Concho Resources Inc
Latest Concho Resources Inc News and Updates
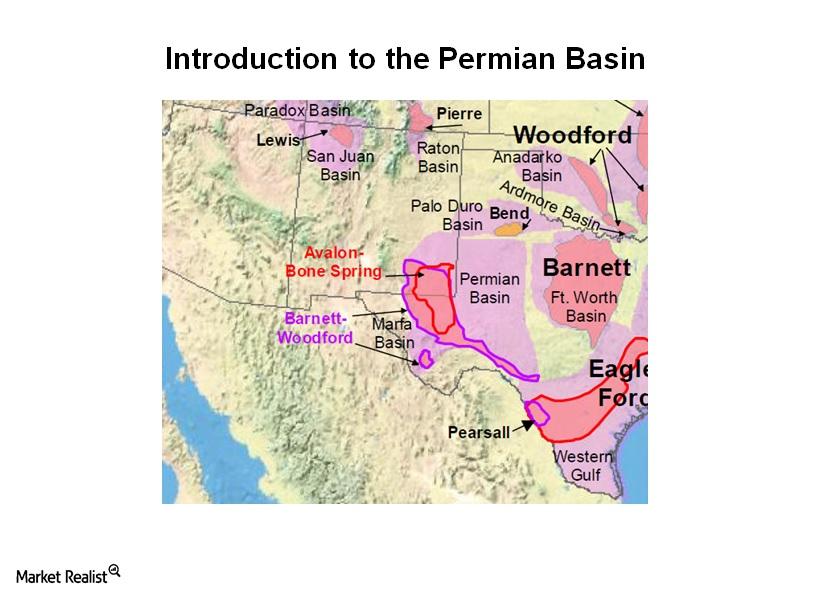
Introduction to the Permian Basin — Part 2: Geography of the Permian Basin
The Permian Basin is one of the US’s primary drivers of oil production growth. Market Realist provides an overview of this prolific hydrocarbon asset with a primer piece: “Introduction to the Permian Basin”.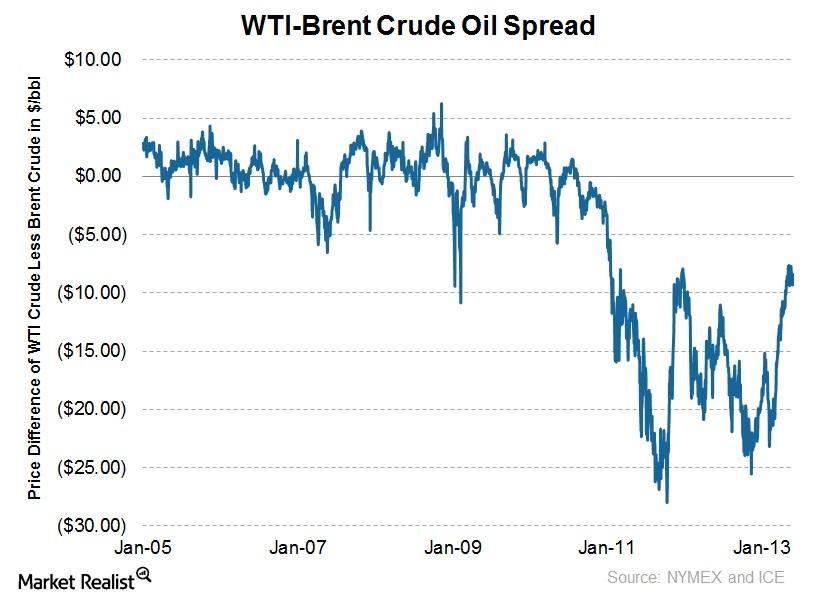
Spread between WTI crude oil and Brent oil has closed in significantly since YE2012
The WTI-Brent spread remained relatively unchanged last week, but has closed in significantly since year-end 2012.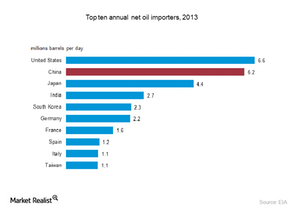
Who will drive crude oil consumption?
Current lower oil prices and growth from China, India, the United States and Asia Pacific countries will drive crude oil consumption in the long term.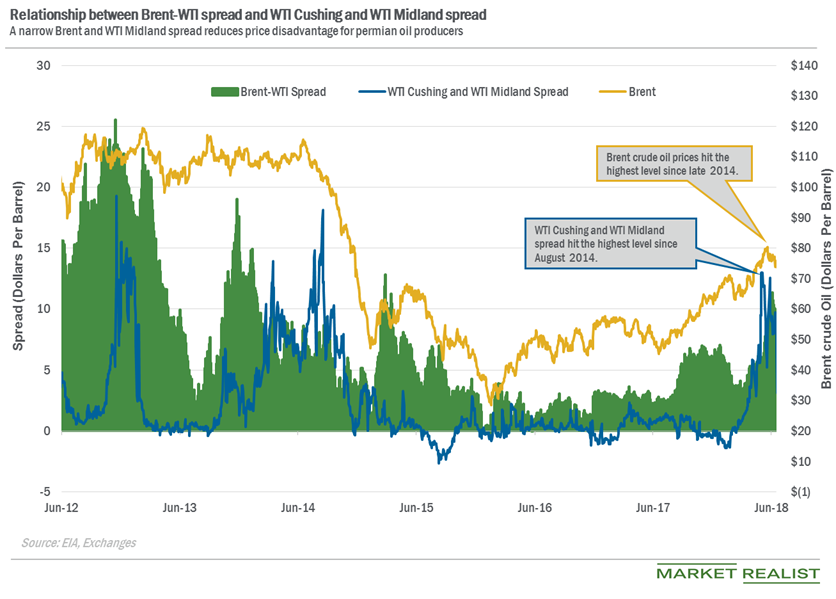
Why Did the WTI Cushing-WTI Midland Spread Drop?
The WTI Cushing-WTI Midland spread was at $4.12 per barrel on June 25—compared to $9.7 per barrel on June 18. The spread fell 58% on June 18–25.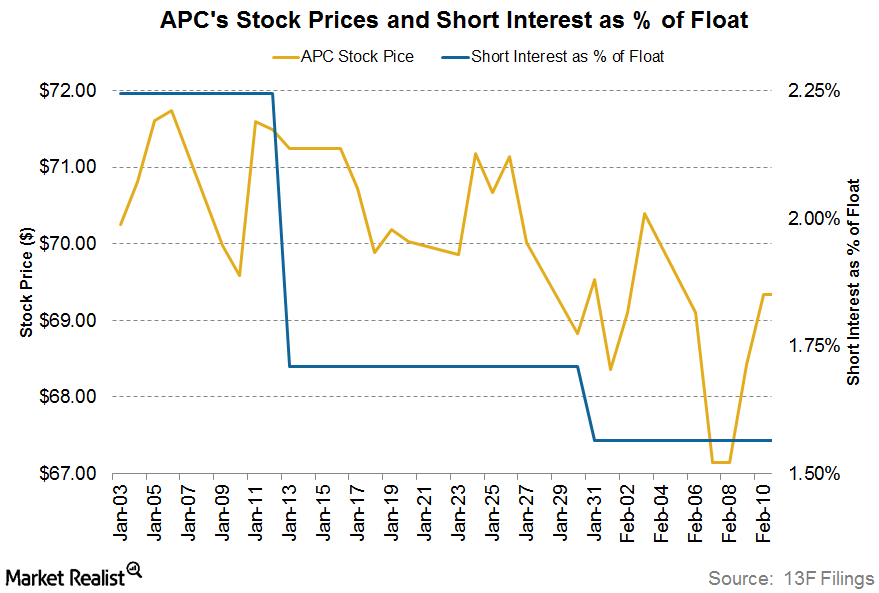
Anadarko Petroleum: Key Short Interest Trends
Anadarko Petroleum’s (APC) short interest ratio on February 10, 2017, was ~1.6%. At the beginning of the year, its short interest ratio was ~2.2%.Energy & Utilities What are the advantages of technical analysis?
Entry and exit strategy is recommended for short and long-term trading in technical analysis. Fundamental analysis is used for the long-term entry and exit point.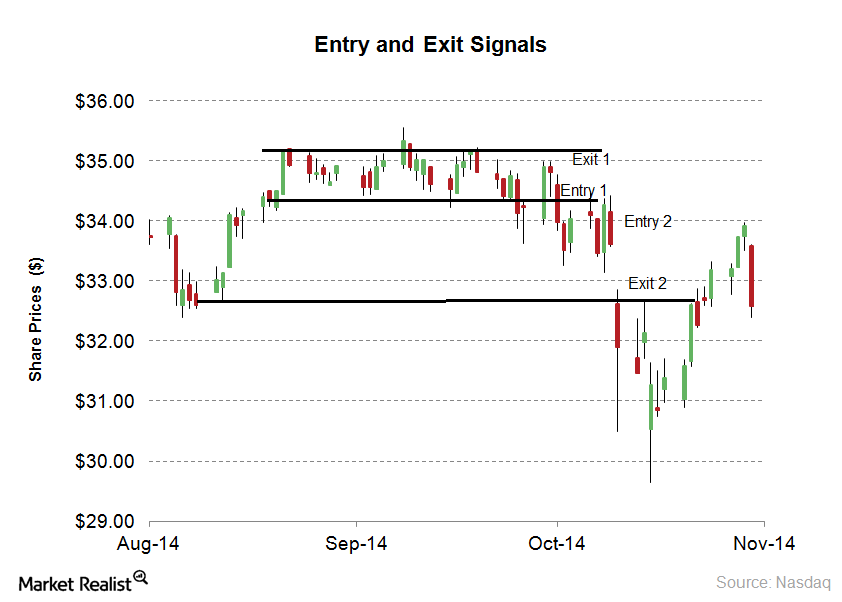
What are the disadvantages of technical analysis?
Technical analysis is used to forecast stocks. All of the technical indicators give possible entry and exit points. The forecasting accuracy isn’t 100%. This is one of disadvantages of technical analysis.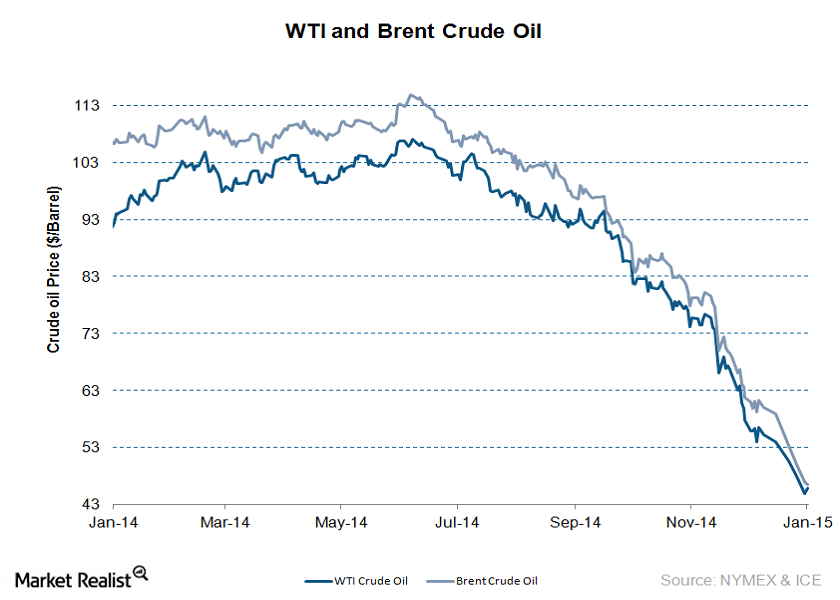
The crude oil market: An overview
Crude oil prices have been on a roller coaster ride in 2014. This series will help crude oil investors recognize key factors that are impacting oil prices.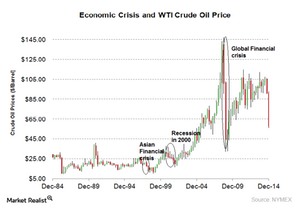
How an economic crisis affects the price of crude oil
The common factor during an economic crisis is that economic growth slows down. Demand declines, which has a negative impact on oil prices.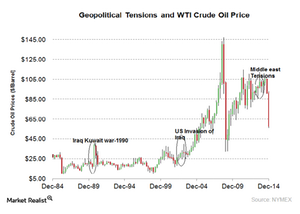
Must know: Geopolitical tensions impact oil prices
A glut in crude oil supply could mean that political tensions in the near term may not impact oil prices.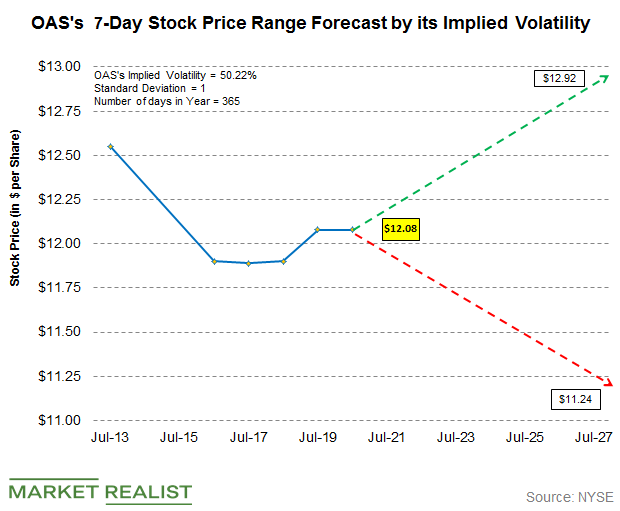
Using Implied Volatility to Forecast Oasis’s Stock Price Range
Oasis Petroleum (OAS) stock’s current implied volatility is ~ 50.22%, which is ~2.08% higher than its 15-day average of 49.19%.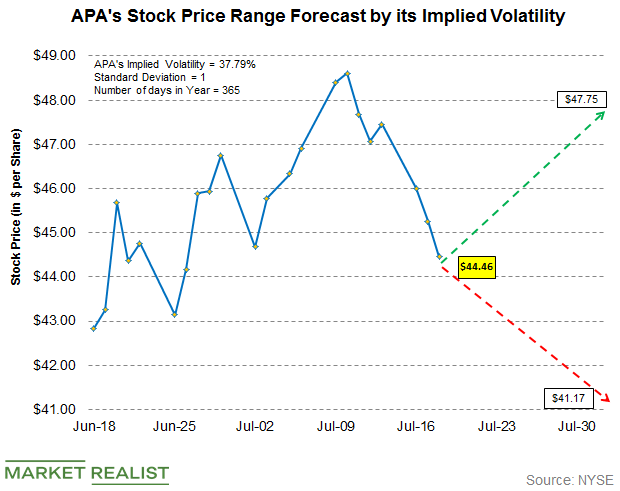
Forecasting Apache’s Stock Price Range
The current implied volatility in Apache’s stock (APA) is ~37.79%. In comparison, the Energy Select Sector SPDR ETF (XLE) has an implied volatility of 17.8%.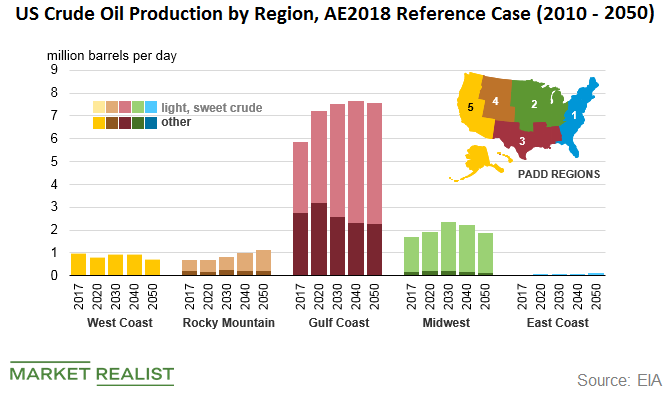
Light Sweet Crude Oil Drives US Crude Oil Production Growth
According to the EIA (U.S. Energy Information Administration), recent growth in US crude oil production has been driven primarily by light, sweet crude oil.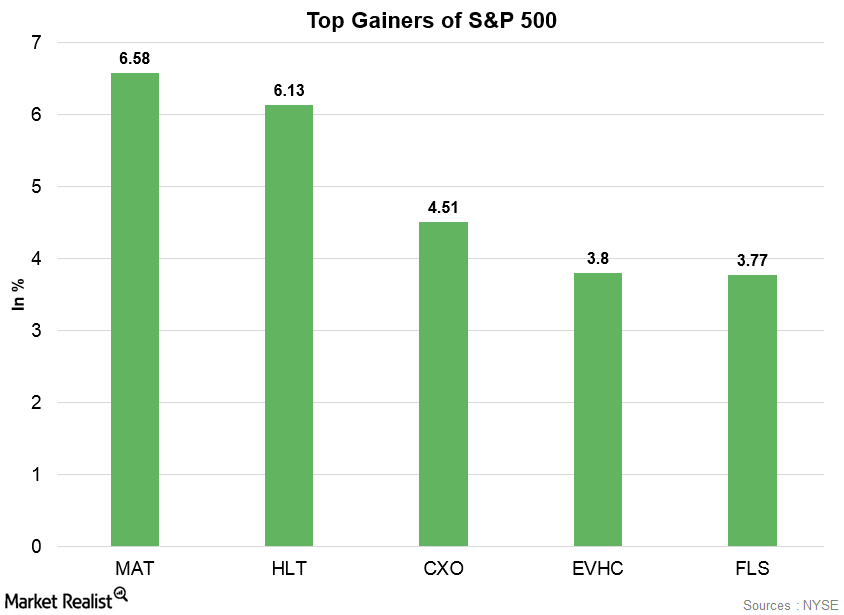
Mattel: S&P 500’s Top Gainer on April 11
Mattel, which is an American multinational toy manufacturing company, was the S&P 500’s top gainer on Wednesday.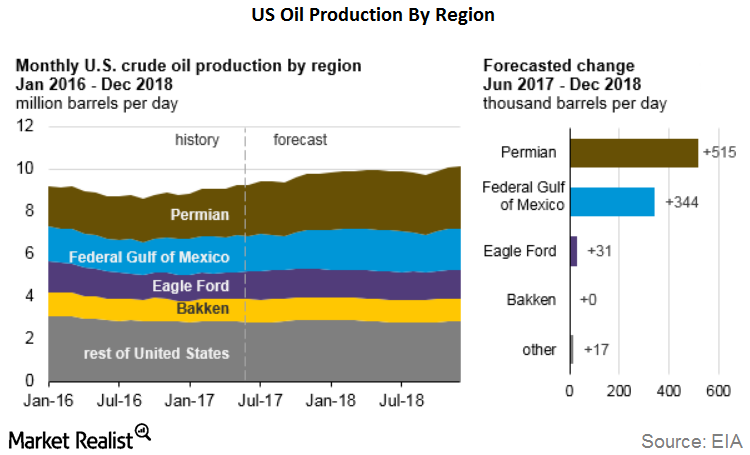
Could Permian Basin Drive Growth in US Crude Oil Production?
In its November Short-Term Energy Outlook (or STEO) report, the EIA forecast that US crude oil production in 2017 would average 9.2 million barrels per day.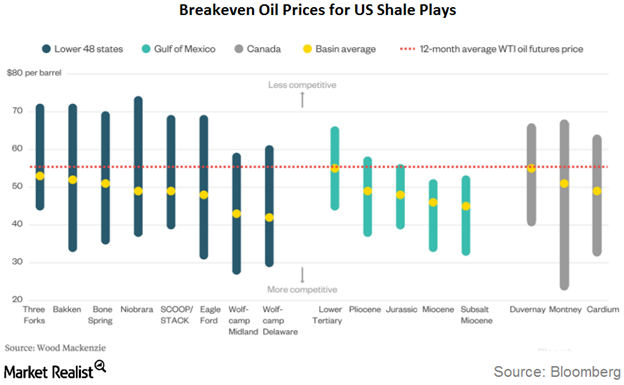
Behind the Break-Even Price Trends for the Permian and Top US Shale Plays
The Midland and Delaware Basins, which are sub-basins of the Permian Basin, had the lowest break-even prices.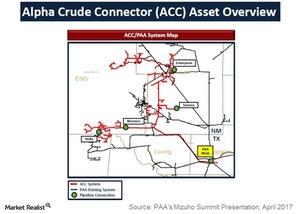
How Recent Acquisitions Have Enhanced PAA’s Permian Footprint
In February 2017, Plains All American Pipeline (PAA) closed the acquisition of a Permian Basin crude oil gathering system for $1.2 billion.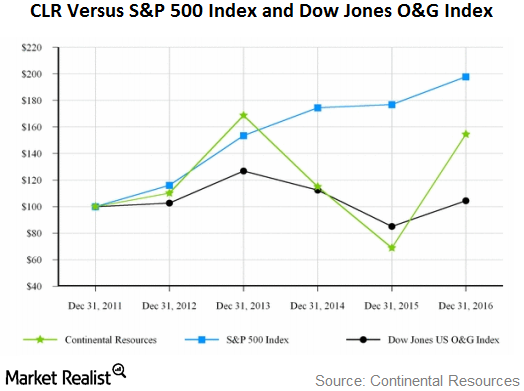
How Has CLR Performed Compared to S&P 500 and Dow Jones?
Let’s take a look at Continental Resources’ (CLR) stock performance in comparison to the performances of the S&P 500 Index and the Dow Jones Oil & Gas Index since 2011.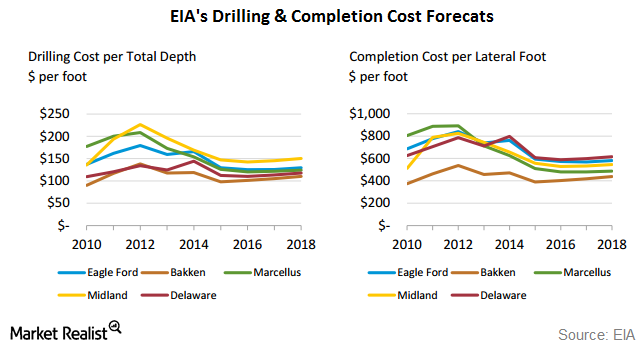
Well Cost Trends in the Permian Basin
The EIA and IHS Global have revealed that the average well-drilling and completion costs in major US regions, including the Permian, will likely decline.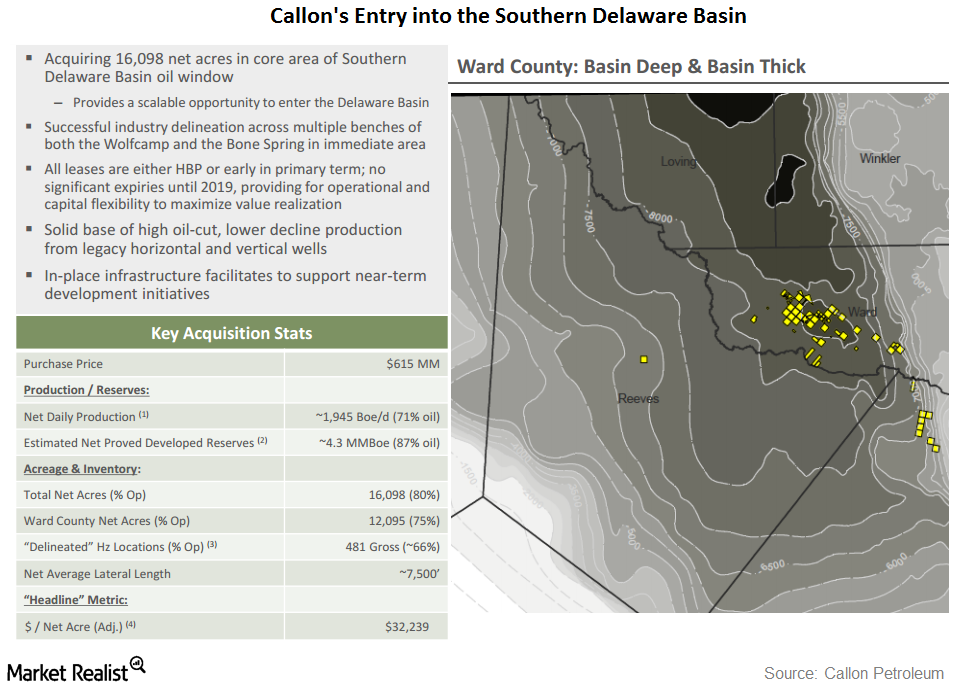
Callon Petroleum Makes Its First Delaware Basin Acquisition
On December 13, Callon Petroleum announced that it had agreed to acquire certain acreage positions and oil- and gas-producing properties from Ameredev.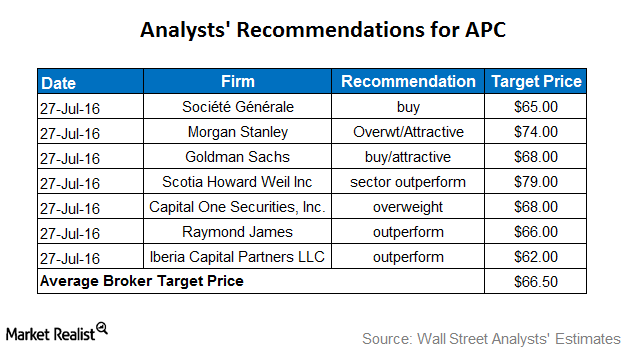
What Do Analysts Recommend for Anadarko after Its 2Q16 Earnings?
Approximately 73% of analysts rate Anadarko a “buy,” whereas 22% rate it a “hold,” and 5% rate it a “sell.” The average broker target price is $66.50.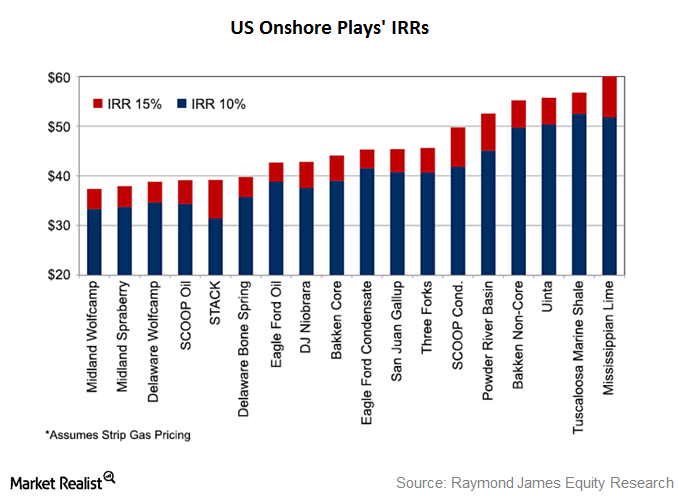
Permian Basin: Is It a Sweet Spot for Apache and US Producers?
The Midland and Delaware basins, which are sub-basins of the Permian, had IRRs of 15% even at sub-$40 oil prices. Apache (APA) has significant operations in both of these basins.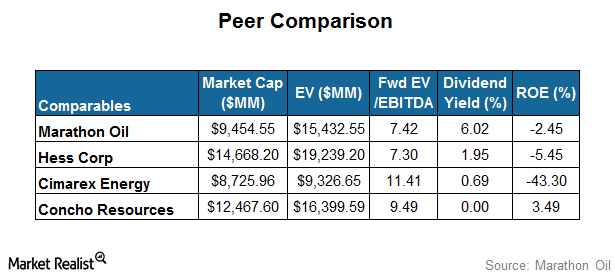
Marathon Oil’s Relative Valuation: A Comparison with Its Peers
In this part of the series, we’ll look at Marathon Oil’s (MRO) relative valuation against its peers’ multiples.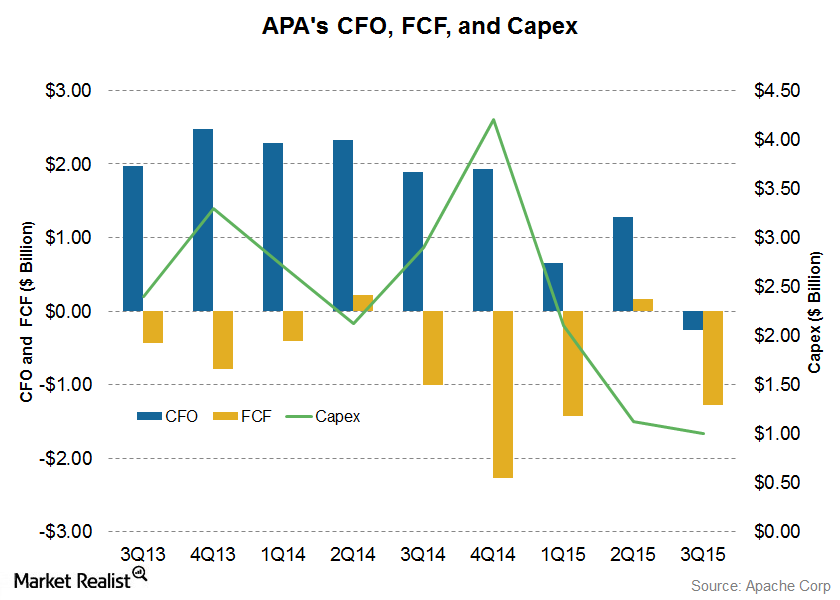
An Analysis of Apache’s Free Cash Flow Trends
Apache’s free cash flow has been mostly negative in the past nine quarters. In 2Q15, it reported FCF of $157 million despite weakness in commodity prices.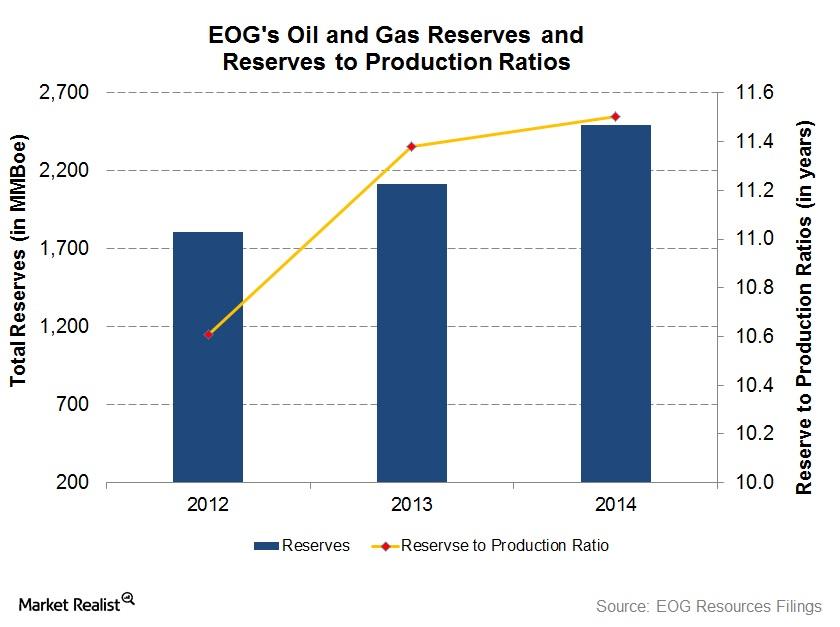
Growth in EOG Reserves Outpaces Production
EOG’s reserves-to-production ratio, or reserve life, increased from 10.6x in 2012 to 11.5x in 2014. It would take EOG 11.5 years to deplete its proved reserves at its 2014 production rate.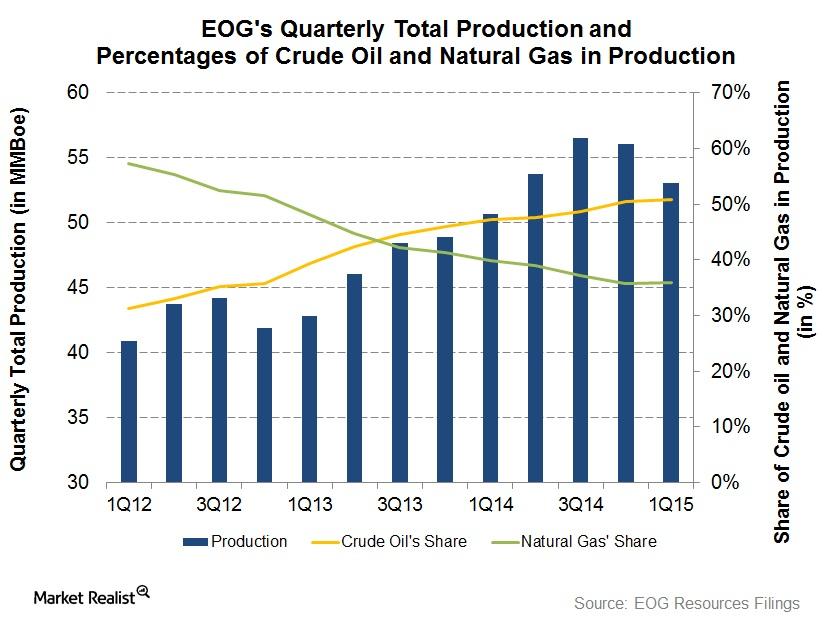
EOG Production Adjusts to Weak Energy Prices
On the heels of weak energy prices, EOG Resources wants to maintain steady production. This may result in flat production growth in 2015.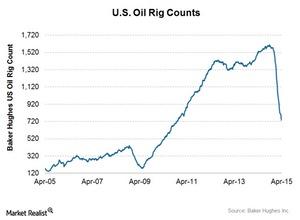
US Crude Oil Rig Count Down for 19 Straight Weeks
US crude oil rig count decreased by 26 for the week ended April 17 down from 760 to 734. The number of oil rigs is now at its lowest level since December 3, 2010.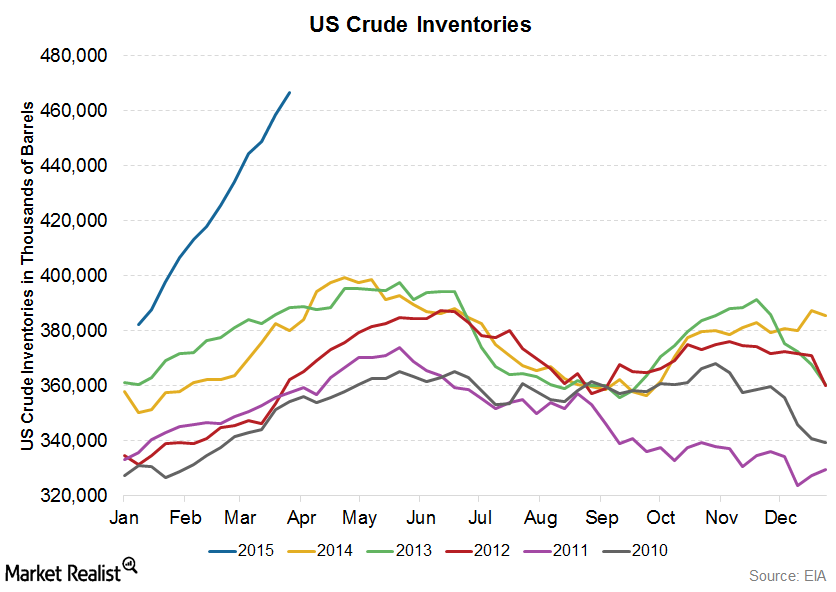
EIA Crude Oil Inventory Report: Essentials for Energy Investors
Crude oil inventory levels change based on demand and supply trends. Demand comes primarily from refineries that process this crude into refined products.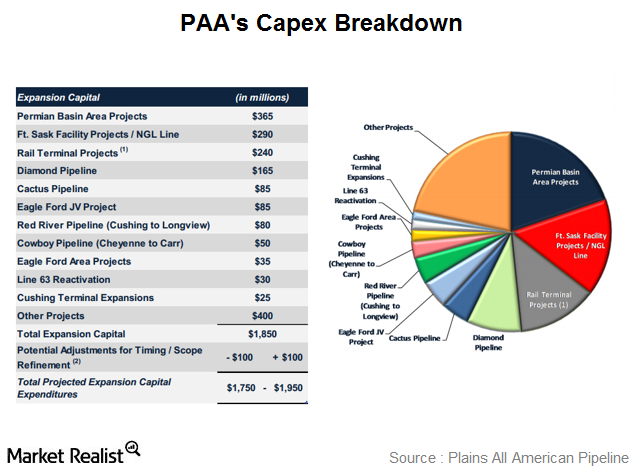
Plains All American Pipeline’s capex plan for 2015
Plains All American Pipeline expects to spend $1.85 in capex in 2015, highlighted by several projects in multiple geographic regions or resource plays.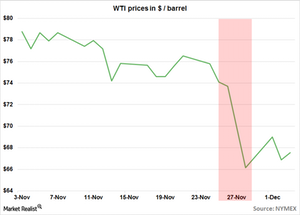
Why the bottom fell out of crude oil
Oil markets had been watching what OPEC would do in its November 27 meeting. Crude oil fell ~30% since June. It decided to stay production levels. Crude oil dropped ~10% after the news.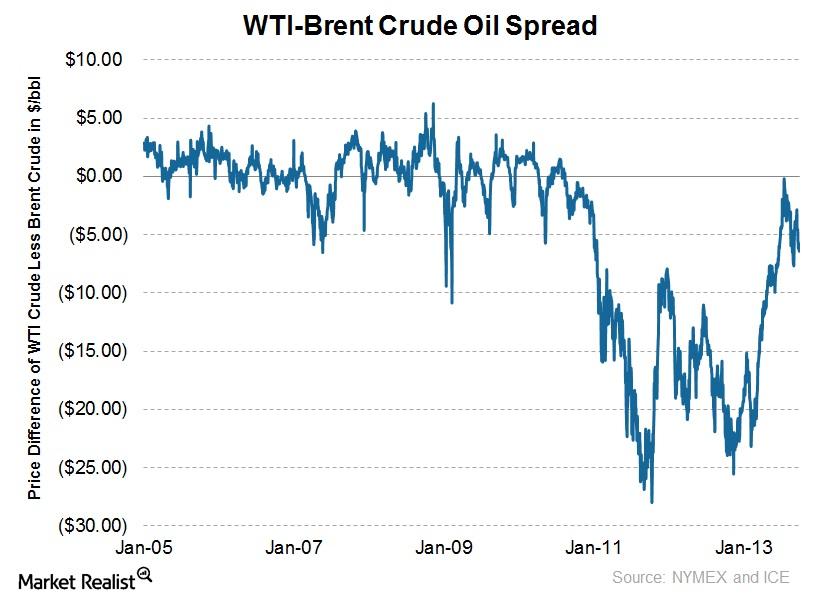
Why the spread between WTI and Brent oil drifted wider
The spread between WTI and Brent closed through most of 2013, but it has experienced some volatility in recent months, given events in Libya and Syria.
