
Amanda Lawrence
Disclosure: I am in full compliance with all ethics and other policies for Market Realist research analysts. I am not invested in securities that I cover on Market Realist.
More From Amanda Lawrence
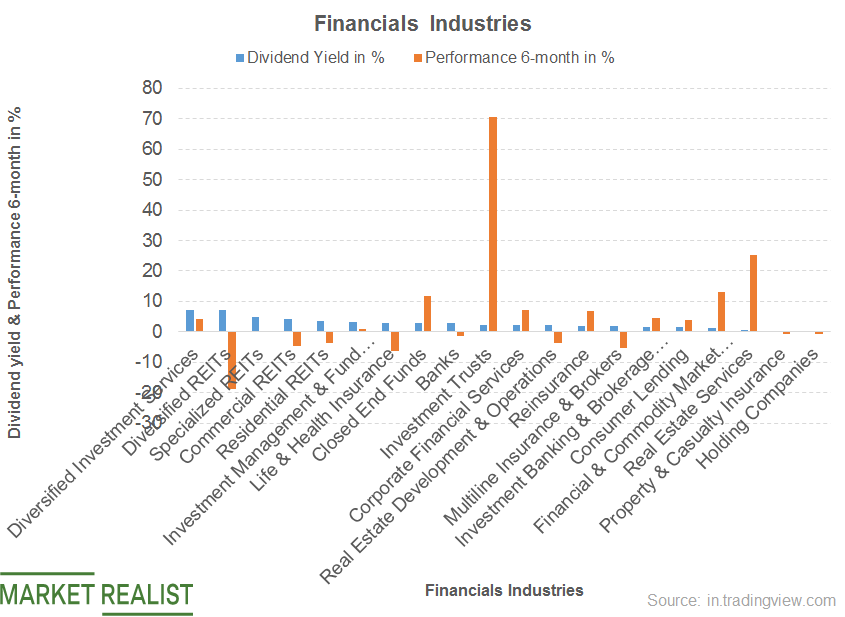
A Look at the Financials Sector’s Dividend Yield: Part One
Financials and basic materials have dividend yields of 2.5% and 2.4%, respectively.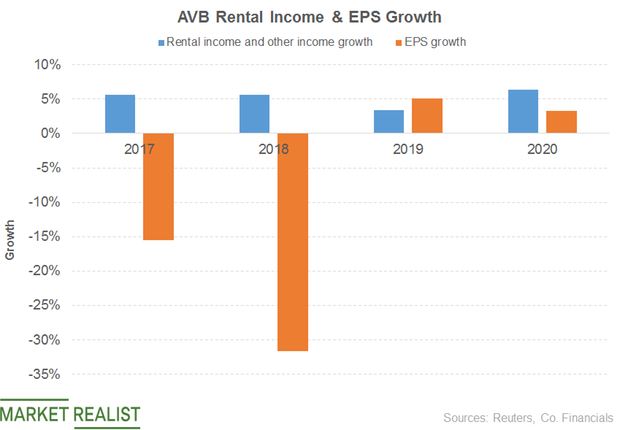
AvalonBay: What’s Driving the Dividend and Valuations?
AvalonBay’s revenue grew 7% in the first quarter, driven by rental and other income.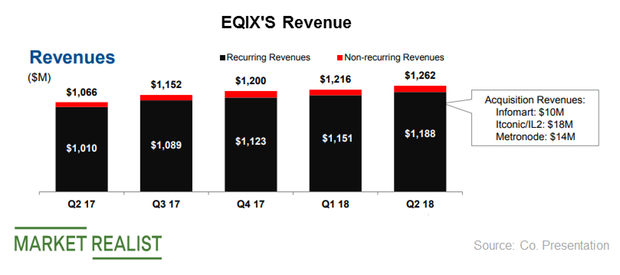
Equinix’s Latest Performance and Future Projections
Equinix’s (EQIX) revenue rose at a four-year CAGR (compound annual growth rate) of 19% to $4.4 billion in 2017.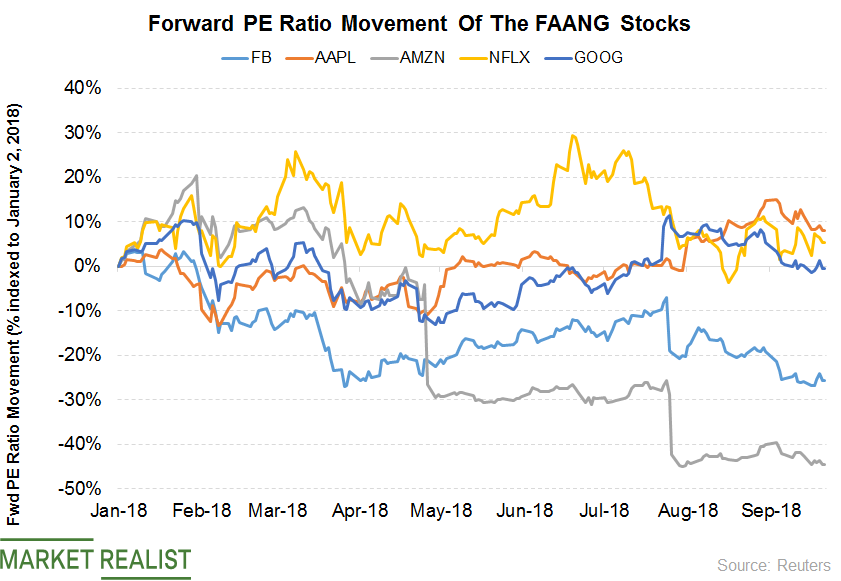
Comparing the Valuations of the FAANG Stocks
Amazon has gained 68.5.0% YTD in stock value. Amazon last traded at a discount of 4.0% to its 52-week high price.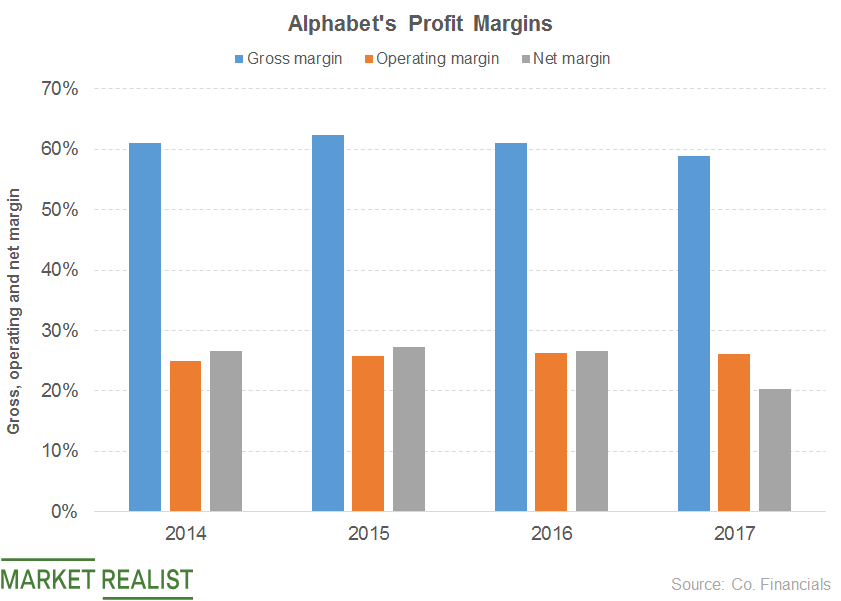
The Gap between Alphabet’s Gross and Other Profit Margins
Alphabet’s EPS grew at a three-year CAGR of 8.0% to $32.30 in 2017.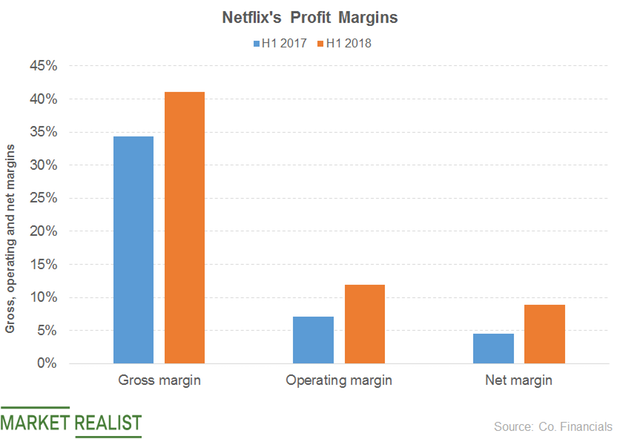
What Caused the Gap in Netflix’s Gross and Other Profit Margins?
Netflix’s income from operations totaled $0.9 billion in the first half of 2018.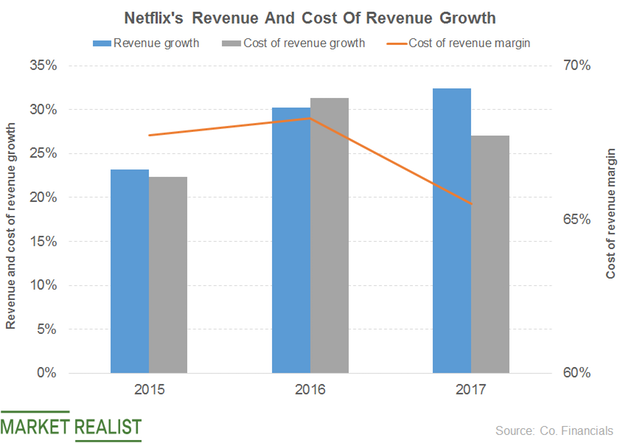
The Major Factors Driving Netflix’s Cost of Revenues
Netflix’s (NFLX) revenues grew at a three-year CAGR of 29.0% to $11.7 billion in 2017.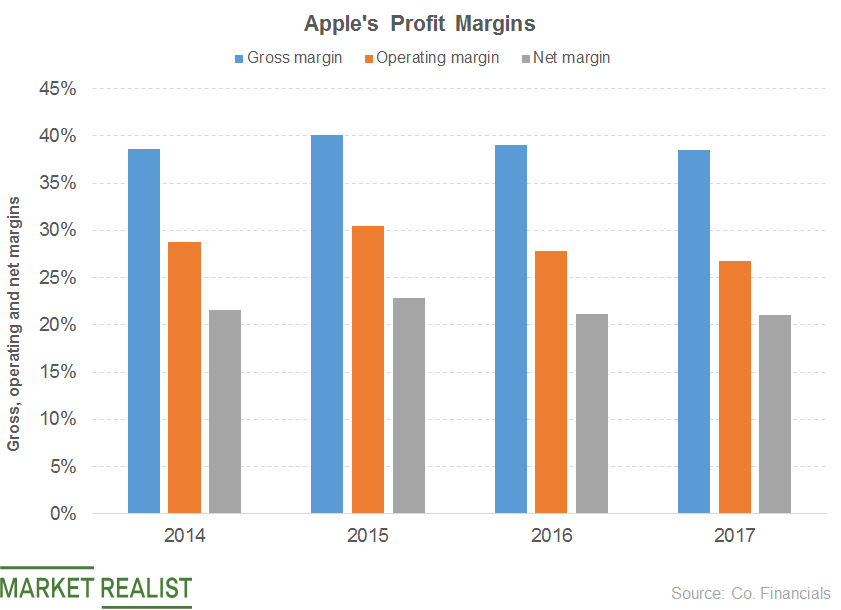
How Have Apple’s Profit Margins Improved since 2015?
Apple’s operating expenses increased at a three-year CAGR of 14.0% to $26.8 billion in 2017.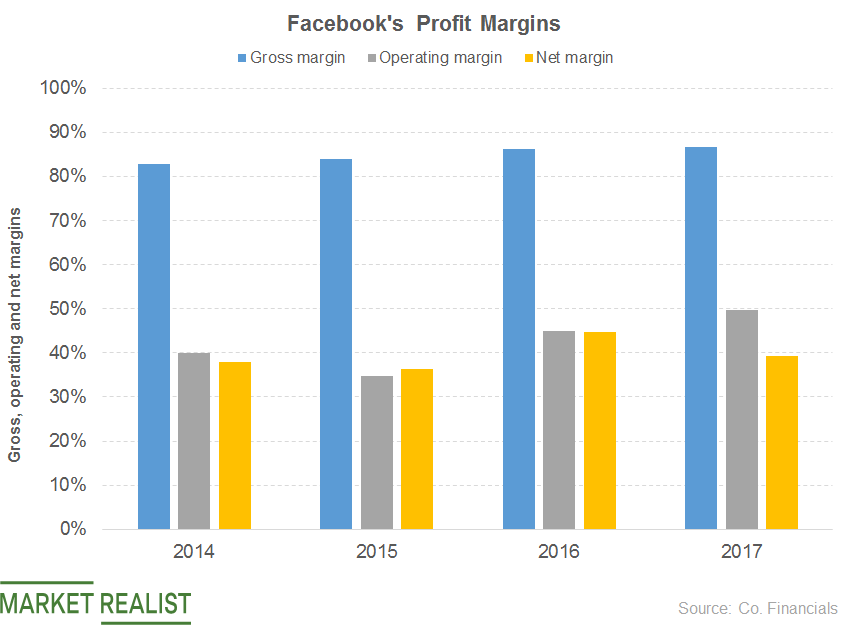
A Look at Facebook’s Profit Margin Growth since 2015
Apple’s (AAPL) operating expenses totaled $26.8 billion in 2017, and Amazon’s (AMZN) operating expenses totaled $61.8 billion in 2017.
What’s Driving Facebook’s Revenue Growth?
In this series, we’ll compare the stock performance and margins of the FAANG stocks—Facebook, Apple, Amazon, Netflix, and Google.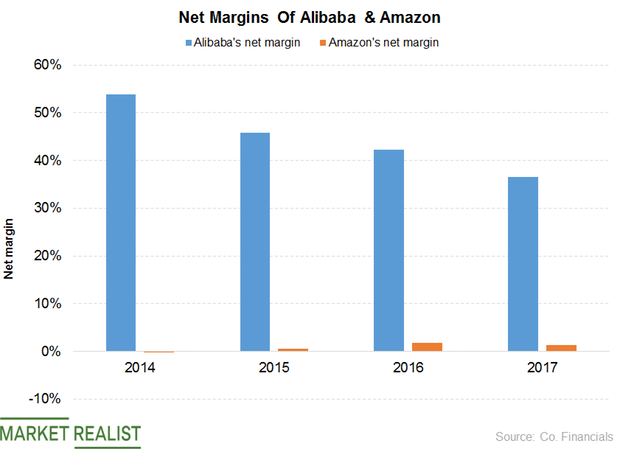
Net Margins for Alibaba and Amazon: A Comparison
Alibaba’s net income remained at 20.1 billion yuan in the quarter ended June 30, 2018, just like the quarter ended in June 2017.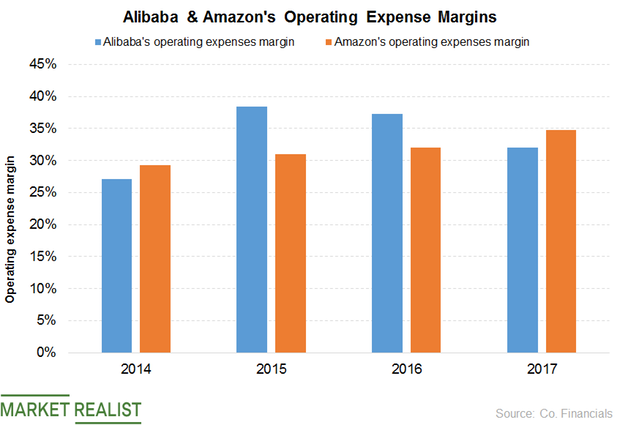
How Alibaba’s and Amazon’s Operating Costs Have Grown
Alibaba’s operating expenses increased 92% to 29.2 billion yuan ($4.4 billion) in the quarter ended June 30, 2018.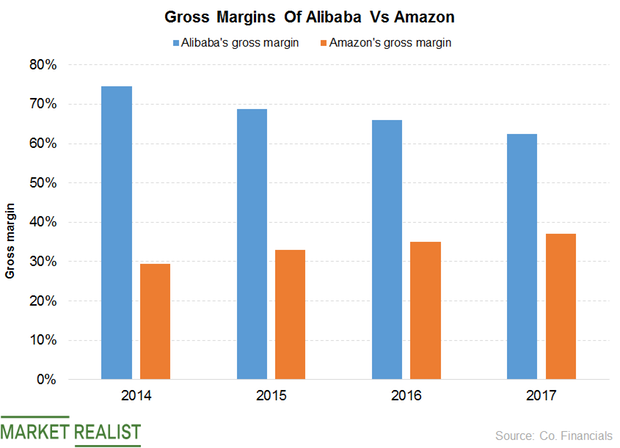
Who Has Higher Gross Margins: Alibaba or Amazon?
Alibaba’s gross profit improved 14% to 37.2 billion yuan ($5.6 billion) in the quarter ended June 30, 2018.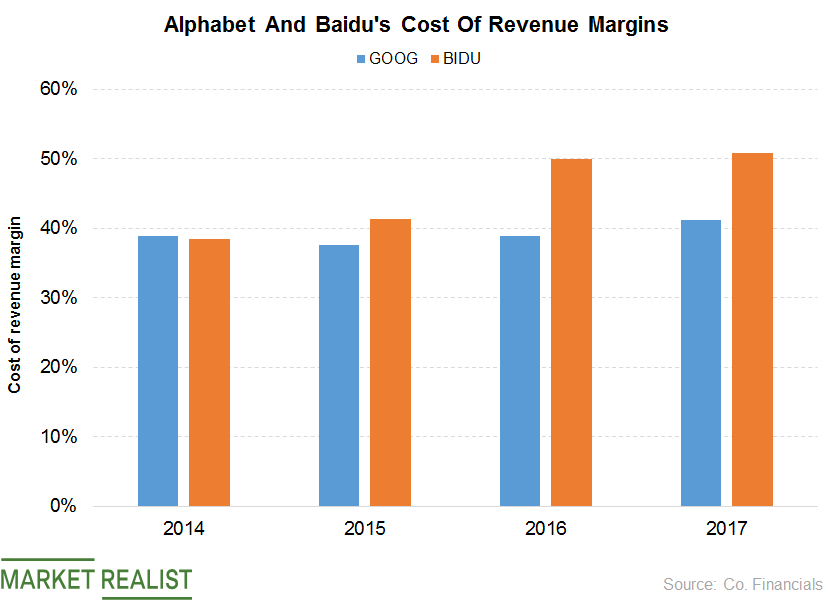
Here’s What Drove Cost of Revenue for Alphabet and Baidu
Alphabet’s (GOOG) cost of revenue rose at a three-year CAGR (compound annual growth rate) of 21% to $45.6 billion in 2017.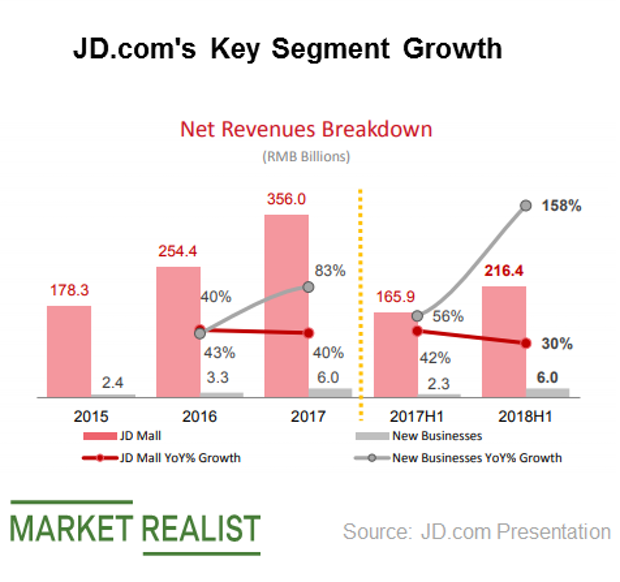
How JD.com’s Segments Have Performed
JD.com’s (JD) essential reportable segments are the JD Mall and New Businesses segments.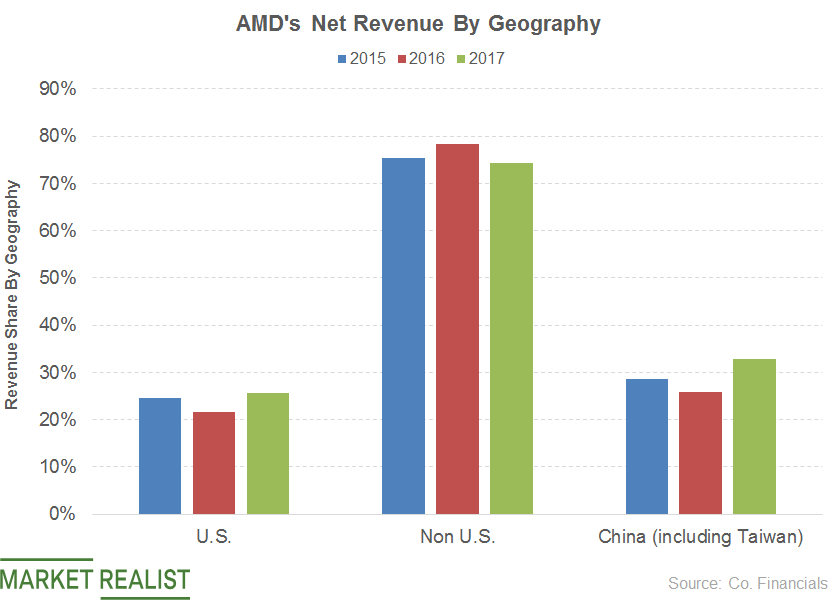
Analyzing AMD’s Revenue Dependency on Geographies
AMD and China’s leading retailer, JD.com (JD), partnered in January to expand the availability of AMD Ryzen processors and desktops in China.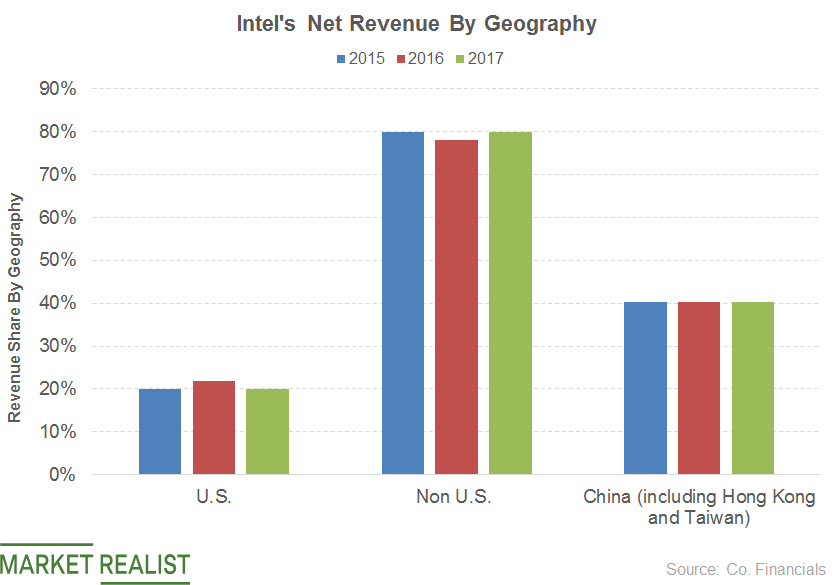
Understanding How Intel and China Depend on Each Other
Intel announced $72.0 million in investments in 12 tech startups to drive its AI, cloud, IoT, and silicon technologies.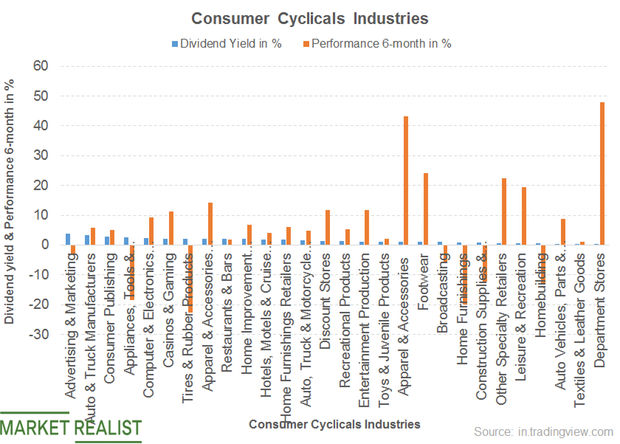
Analyzing the Consumer Cyclical Sector’s Dividend Yield: Part One
The consumer cyclical sector has an average dividend yield of 1.4%.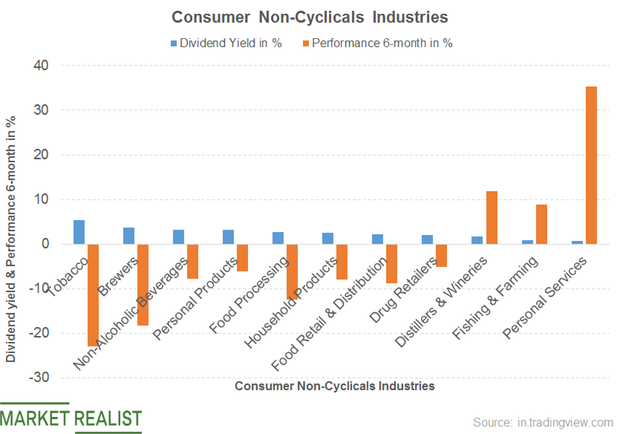
What’s the Dividend Yield of the Consumer Non-Cyclical Sector?
The consumer non-cyclical segment recorded a dividend yield of 3%.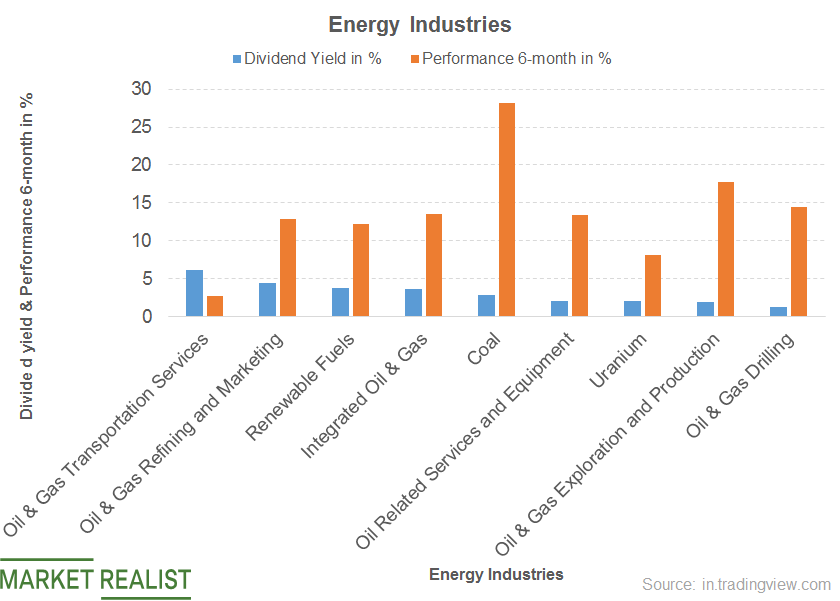
What’s the Energy Sector’s Dividend Yield?
Of all the energy segments, the oil and gas transportation services segment noted the highest dividend yield.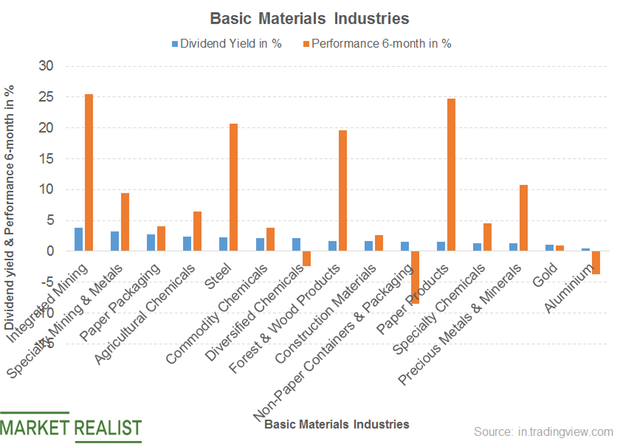
A Look at the Basic Materials Sector’s Dividend Yield
Of the various industries in the basic materials sector, integrated mining noted the highest dividend yield.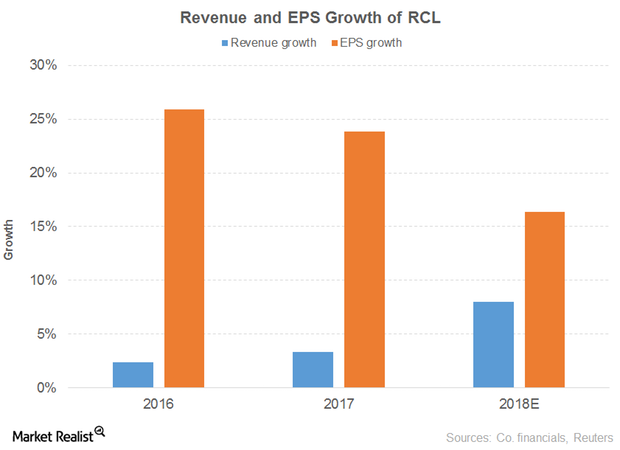
What Will Drive RCL’s Dividends?
Royal Caribbean Cruises (RCL) has five-year dividend growth of 39%.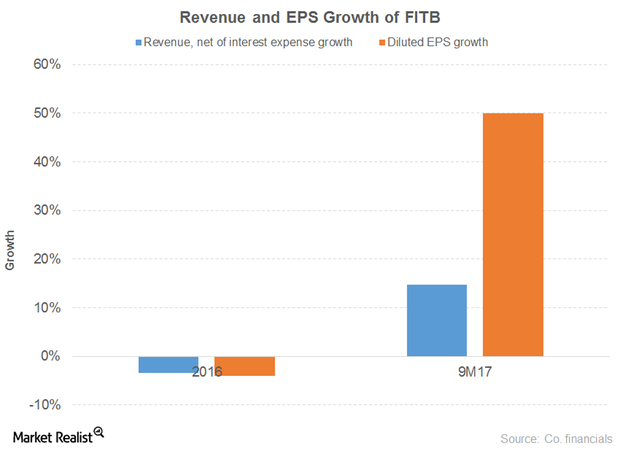
How Fifth Third Bancorp Has Performed Recently
Fifth Third Bancorp has an impressive free cash flow position.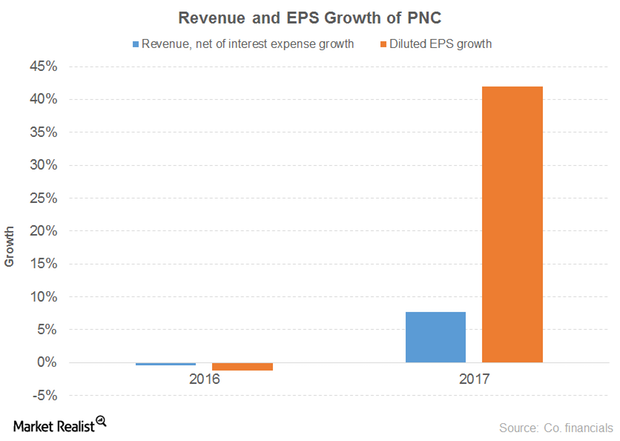
What’s Driving PNC Financial Services?
The PNC Financial Services Group’s (PNC) revenue net of interest expense remained flat in 2016 and grew 8% in 2017.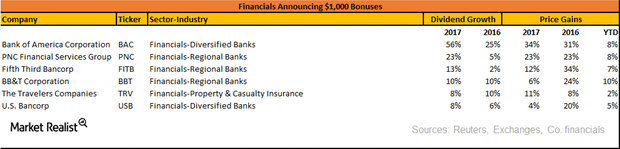
A Look at Bank of America’s Key Growth Drivers
Bank of America’s dividend yield of 1.5% and PE of 20.6x compares to a sector average dividend yield of 2% and PE of 20.7x.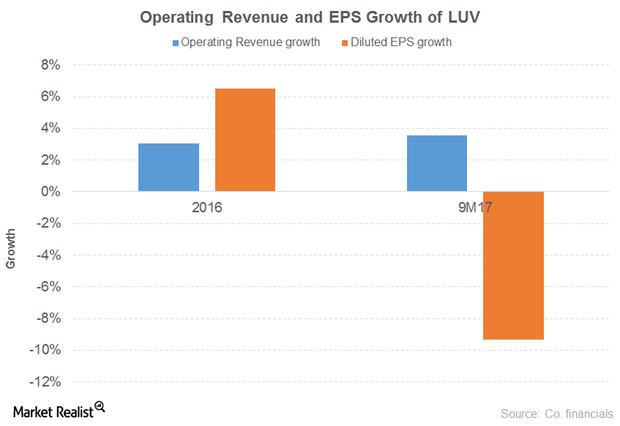
How Is Southwest Airlines Doing?
Southwest Airlines’ (LUV) operating revenue grew 3% and 4% in 2016 and 9M17, respectively. The holiday season was included in 2016.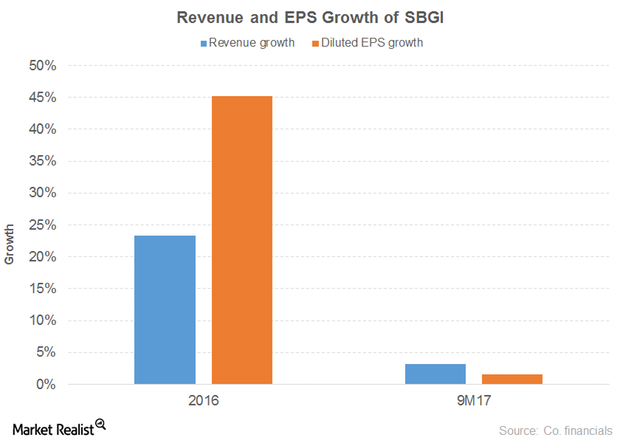
How Sinclair Broadcast Intends to Move Forward
Sinclair Broadcast Group’s (SBGI) revenue grew 23% in 2016 and 3% in 9M17. In 2016, it acquired several television stations and the Tennis Channel.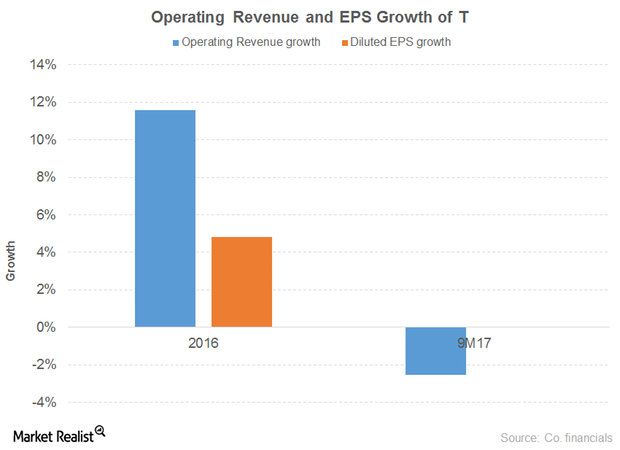
How AT&T Is Preparing for the Price War
AT&T’s cost of revenue rose 15% in 2016 before decreasing 1% in 9M17. That led to a 9% growth in gross profit for 2016 before falling 4% in 9M17.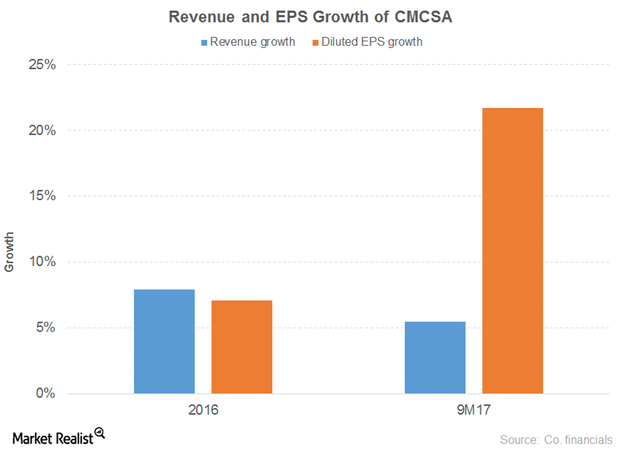
A Look at Comcast’s Strategy
Comcast’s (CMCSA) revenue grew 8% and 5% in 2016 and 9M17, respectively. The broadcast of the Rio Olympics in 3Q16 drove the 2016 numbers.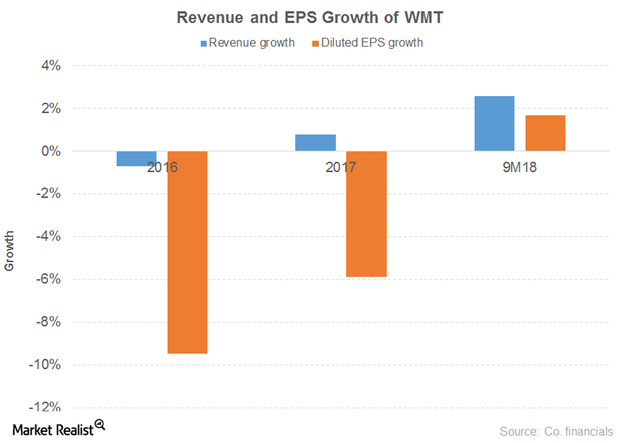
How Walmart Looks Going Forward
Walmart’s (WMT) revenue grew 3% in the first nine months of fiscal 2018. Walmart U.S. and Sam’s Club drove sales, offset by Walmart International.
Which Stocks Have Announced $1,000 Bonuses?
In this series, we’ll be taking a look at the companies that have announced $1,000 dollar bonuses, pay raises, increased dividends, and buybacks in the last two months.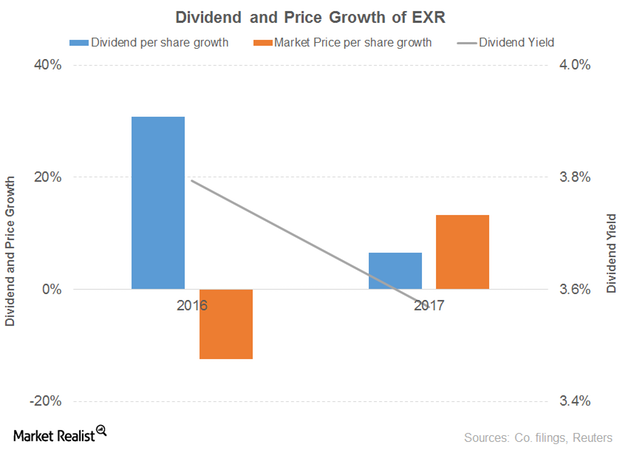
What’s the Outlook for Extra Space Storage?
Extra Space Storage’s (EXR) revenue grew 27% and 13% in 2016 and 9M17, respectively.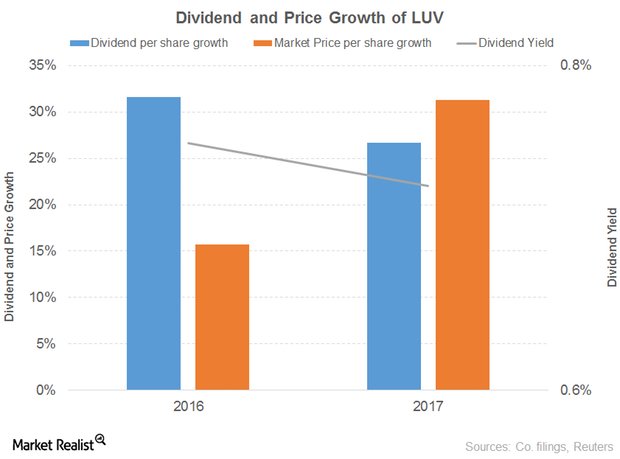
Here’s What Influenced the Outlook for Southwest Airlines
Southwest Airlines’ (LUV) operating revenue grew 3% and 4% in 2016 and 9M17, respectively.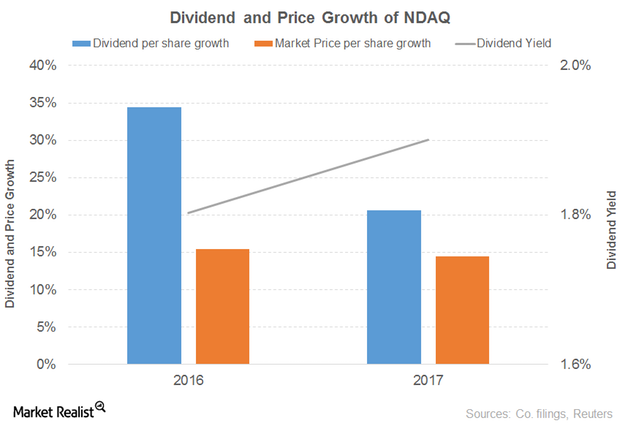
What’s behind the Outlook for Nasdaq?
Nasdaq (NDAQ) revenue rose 9% and 8% in 2016 and 9M17, respectively.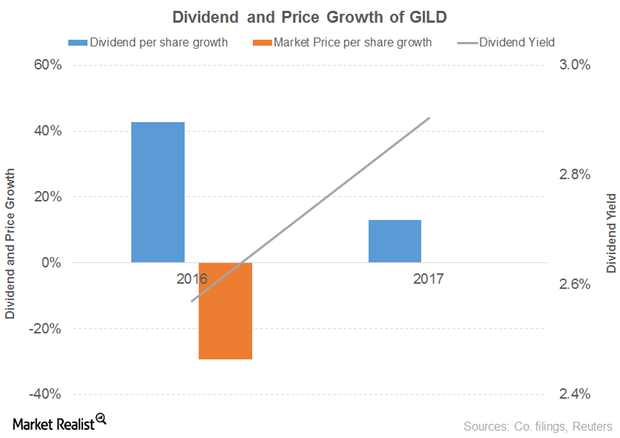
These Factors Are Contributing to Gilead Sciences’ Weak Outlook
Gilead Sciences’ (GILD) revenue fell 7% and 13% in 2016 and 9M17, respectively. The fall was due to lower product sales. Both antiviral products and other products recorded declines in both the periods.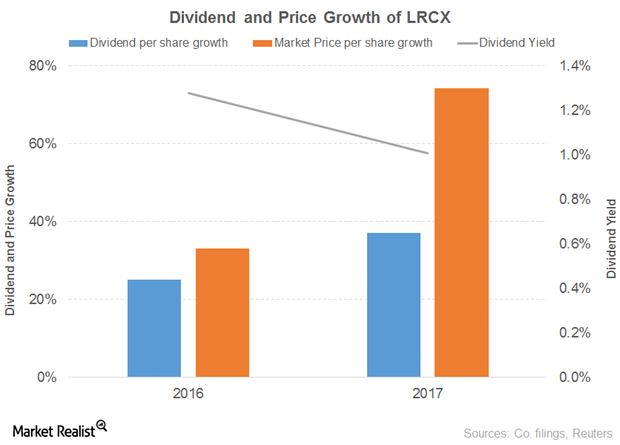
What’s Contributing to Promising Outlook for Lam Research?
Lam Research’s (LRCX) revenue rose 12% and 36% in 2016 and 2017, respectively. It rose 52% in 1Q18.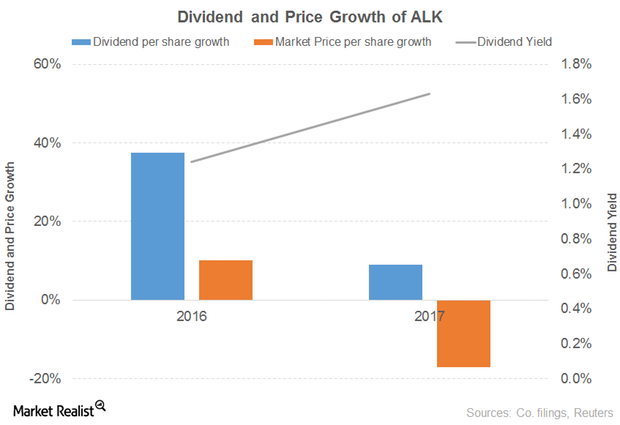
What’s the Outlook for Alaska Air Group?
Alaska Air Group’s (ALK) operating revenue rose 6% and 35% in 2016 and 9M17, respectively.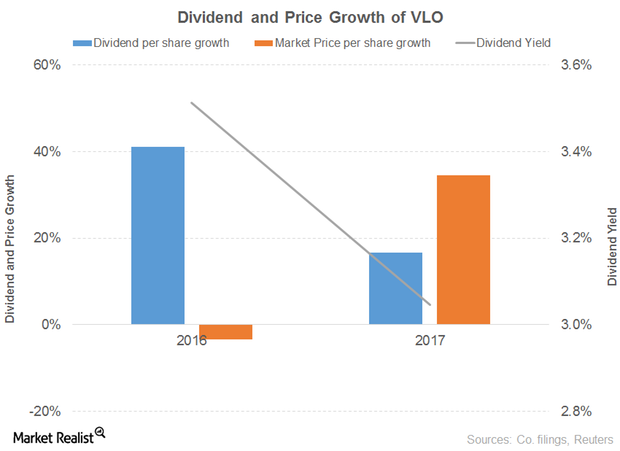
What Has Influenced the Outlook for Valero Energy?
Valero Energy’s operating revenue fell 14% in 2016 before rising 23% in 9M17. Refining revenues drove the decline in 2016, offset by ethanol revenues.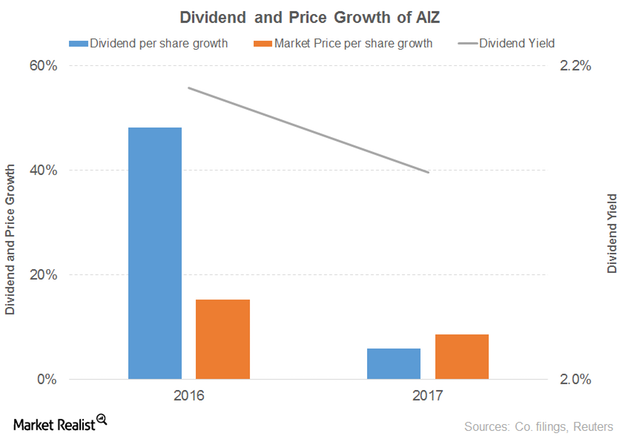
Why Assurant Has a Positive Outlook despite a Weak 2017
Assurant’s (AIZ) revenue fell 27% and 18% in 2016 and 9M17, respectively.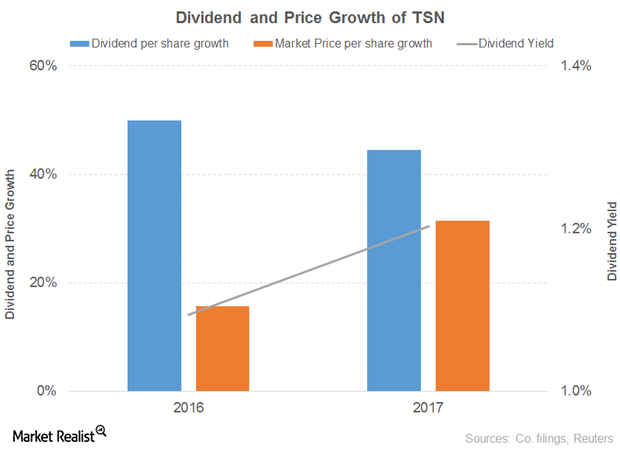
What’s the Outlook for Tyson?
Tyson Foods’ (TSN) sales dropped 11% in 2016 before gaining 4% in 2017.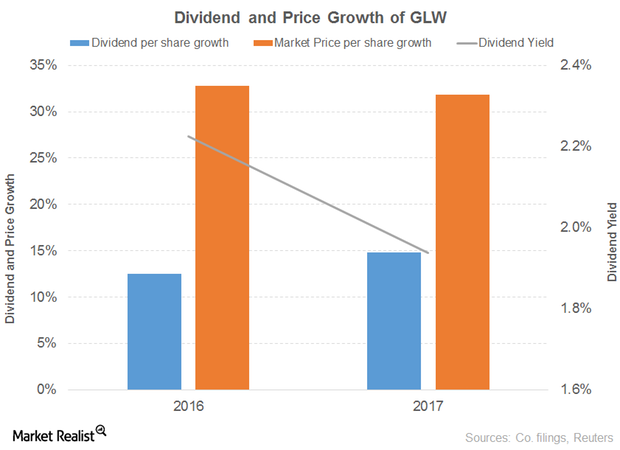
What Are Corning’s Key Growth Drivers?
Corning’s gross margin grew 3% and 9% in 2016 and 9M17, respectively.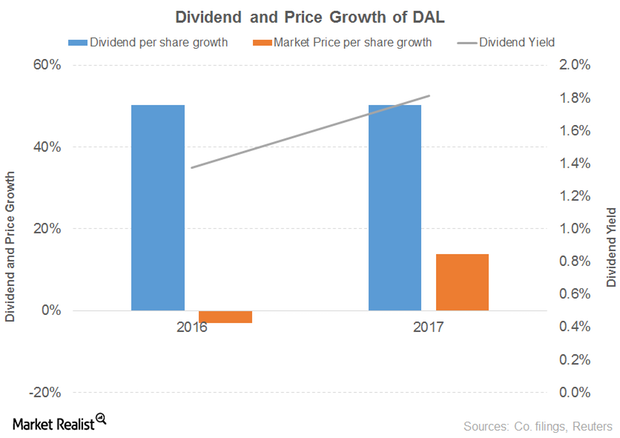
What to Expect from Delta Air Lines
Delta Air Lines’ (DAL) operating revenue fell 3% in 2016 before gaining 3% in 9M17 (or the first nine months of 2017).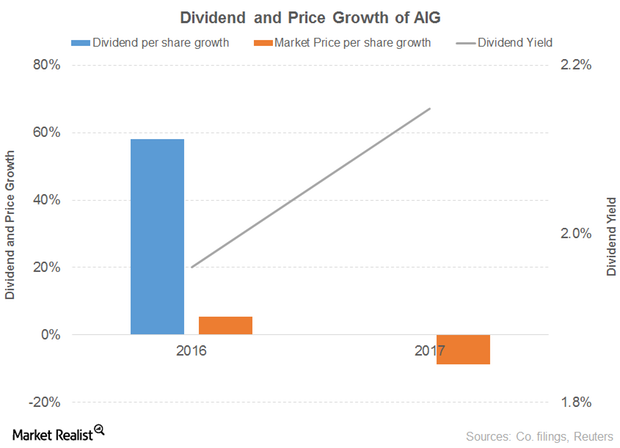
What’s the Outlook for American International Group?
American International Group’s dividend per share rose 58% in 2016 and was flat in 2017.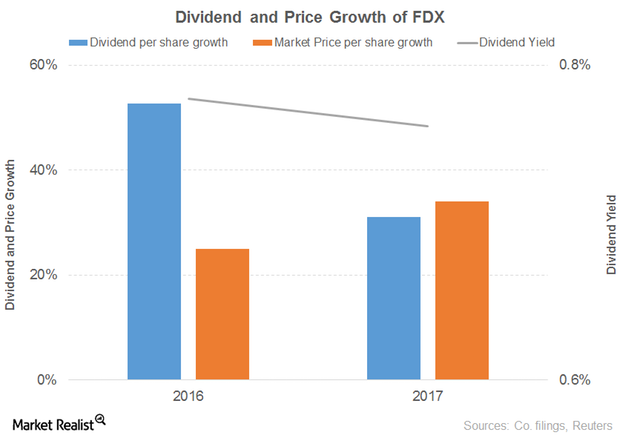
How FedEx’s Performance Influenced Its Outlook
FedEx’s (FDX) revenue grew 6% and 20% in 2016 and 2017, respectively. The FedEx Ground, FedEx Freight, and FedEx Services segments drove the 2016 growth, offset by the FedEx Express segment.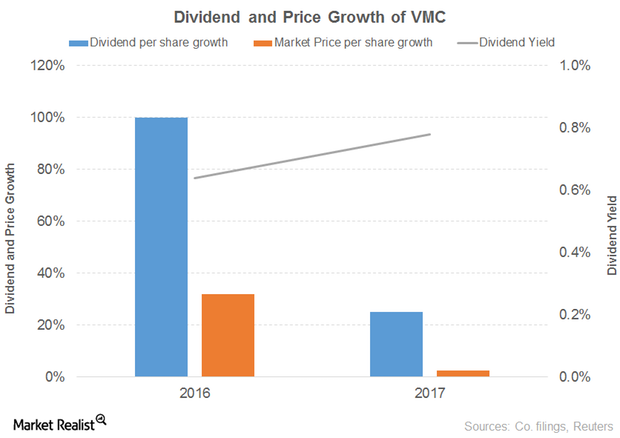
The Outlook for the Vulcan Materials Company
The Vulcan Materials Company’s (VMC) revenue grew 5% and 7% in 2016 and 9M17, respectively. Aggregates, concrete, and calcium drove the growth in 2016, offset by asphalt mix.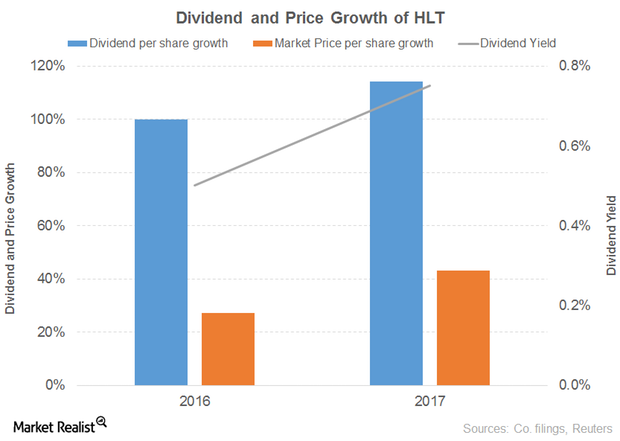
Hilton Worldwide Holdings Looks Promising despite a Tough 2017
Hilton Worldwide Holdings’ (HLT) revenue grew 3% in 2016. Management and franchise fees, timeshare, and other revenues from managed and franchised properties drove the growth in 2016, offset by owned and leased hotels.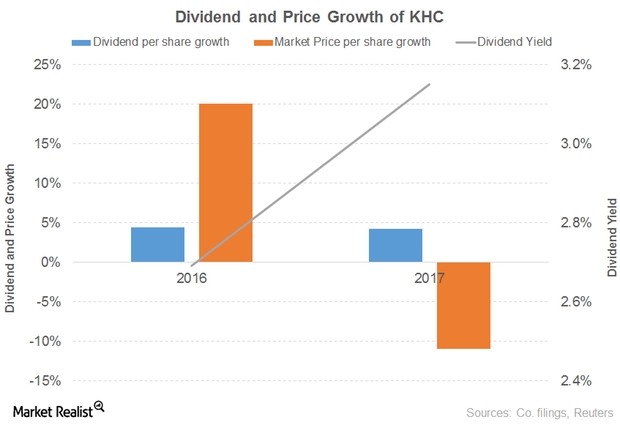
Why The Kraft Heinz Company’s Outlook Still Seems Promising
The Kraft Heinz Company’s (KHC) net sales grew 44% in 2016 before falling 1% in 9M17. Every product category drove the growth in 2016, offset by a decline in the infant and nutrition segments.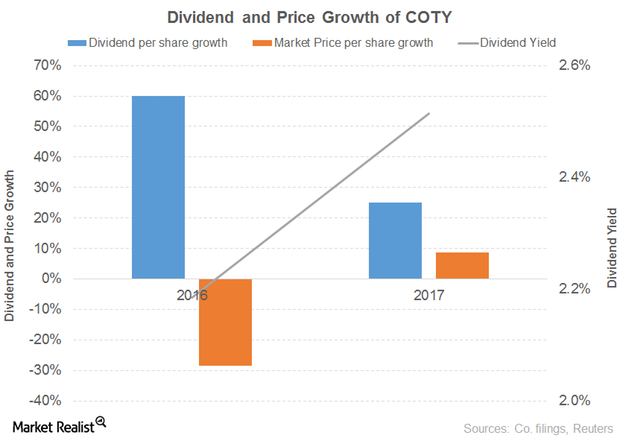
How Coty’s Performance Affected Its Outlook
Coty (COTY) net revenue fell 1% in 2016 before climbing 76% in 2017. The Consumer Beauty segment drove the growth in both years.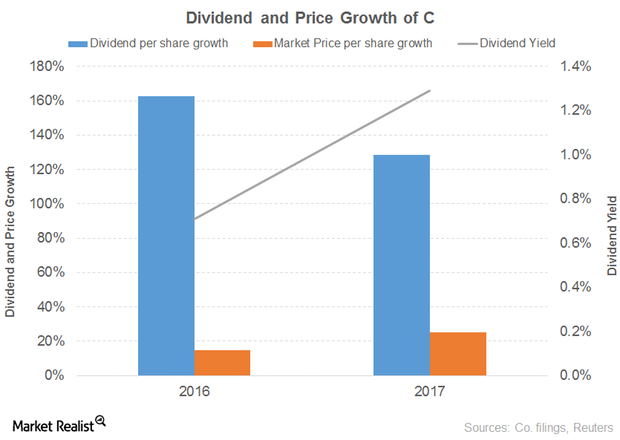
Why Citigroup’s Outlook Seems Promising
Citigroup is projected to grow its revenue 2% and 4% in 2017 and 2018, respectively. The 2017 and 2018 diluted EPS are projected to grow 12% and 14%, respectively.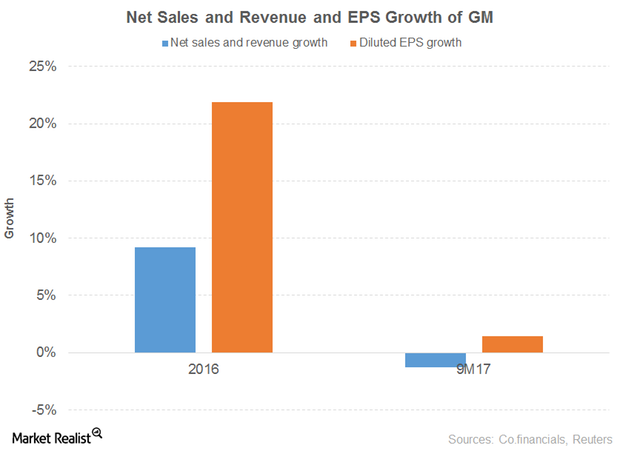
A Look at GM’s Stock Performance
In this part of our focus on the top 18 cheap S&P 500 stocks, we’ll discuss another six stocks: General Motors (GM), Ford Motor (F), Owens-Illinois (OI), The Goodyear Tire & Rubber Company (GT), Navient (NAVI), and Brighthouse Financial (BHF).