How AT&T Is Preparing for the Price War
AT&T’s cost of revenue rose 15% in 2016 before decreasing 1% in 9M17. That led to a 9% growth in gross profit for 2016 before falling 4% in 9M17.
Jan. 26 2018, Updated 7:35 a.m. ET

How did AT&T’s revenue fare?
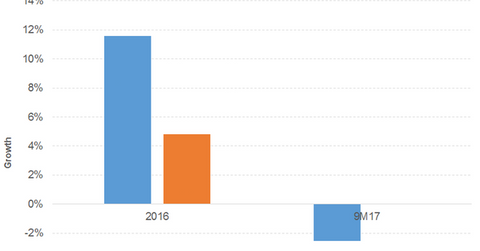
AT&T’s (T) operating revenue grew 12% in 2016 before falling 3% in 9M17. Wireless net additions of close to 3 million in North America as well as DirecTV NOW, IP (Internet Protocol) services, and video drove growth in 2016.
The decline in 9M17 was attributable to a slowdown in legacy wireline services and consumer mobility. The hurricanes and earthquakes in 3Q17 also affected the numbers.
Diluted EPS performance
Cost of revenue rose 15% in 2016 before decreasing 1% in 9M17. That led to a 9% growth in gross profit for 2016 before falling 4% in 9M17. Operating expenses increased 14% in 2016 before decreasing 6% in 9M17. Operating income declined 2% in 2016 before gaining 2% in 9M17. Interest expenses also increased during those years, partially offset by growth in other income. As a result, diluted EPS (earnings per share) rose 5% in 2016 and remained flat in 9M17. Share buybacks enhanced the EPS numbers.
Dividend yield and price performance
Uniform growth in dividends per share and a fall in price have contributed to AT&T’s rising dividend yield since 2016. The company has an impressive free cash flow position.
AT&T’s dividend yield of 5.4% and PE (price-to-earnings) ratio of 17.7x compare to a sector average dividend yield of 4.9% and a PE ratio of 33.7x. The company gained 24% in 2016 and fell 9% in 2017 and 4% YTD (year-to-date).
Company versus the broad indexes
The S&P 500 (SPX-INDEX) (SPY) offers a dividend yield of 2.2% and a PE ratio of 24.6x. It rose 10%, 19%, and 5% in 2016, 2017, and YTD, respectively.
The Dow Jones Industrial Average (DJIA-INDEX) (DIA) has a dividend yield of 2.1% and a PE ratio of 24.9x. It rose 13%, 25%, and 5% in 2016, 2017, and YTD, respectively.
The NASDAQ Composite (COMP-INDEX) (ONEQ) has a PE ratio of 25.4x. It rose 8%, 28%, and 6% in 2016, 2017, and YTD, respectively.
Going forward
AT&T intends to acquire Time Warner and introduce FirstNet network and 5G (fifth generation) in the United States. They are being targeted to drive the bundled video, mobile, and broadband services of AT&T.
ETFs
The Fidelity MSCI Telecommunication Services ETF (FCOM) has a PE ratio of 18.4x and a dividend yield of 2.8%. The iShares Global Telecom (IXP) has a PE ratio of 14.8x and a dividend yield of 3.4%.
