Here’s What Drove Cost of Revenue for Alphabet and Baidu
Alphabet’s (GOOG) cost of revenue rose at a three-year CAGR (compound annual growth rate) of 21% to $45.6 billion in 2017.
Sept. 24 2018, Updated 10:05 a.m. ET

The primary cost driver for Alphabet
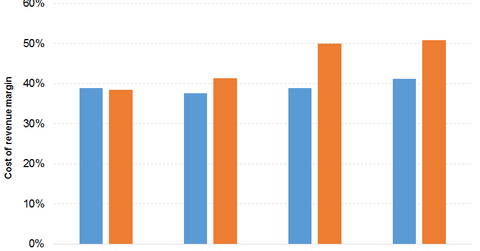
Alphabet’s (GOOG) cost of revenue rose at a three-year CAGR (compound annual growth rate) of 21% to $45.6 billion in 2017. Costs climbed 10%, 25%, and 30% in 2015, 2016, and 2017, respectively. Traffic acquisition costs (or TACs) of the Google segment and mobile search drove its cost of revenue. Its cost of revenue margin has increased from 38%–39% to 41% between 2014 and 2017. TACs as a percentage of advertising revenue rose from 21%–22% to 23% between 2014 and 2017.
Therefore, gross profit improved at a three-year CAGR of 17% to $6.3 billion in 2017. Its gross profit grew 16% in 2015 and 18% in both 2016 and 2017. Its gross margin decreased from 61%–62% between 2014 and 2016 to 59% in 2017.
What drove Baidu’s costs over the years?
Baidu’s (BIDU) cost of revenue has increased at a three-year CAGR of 32% to 43.1 billion yuan ($6.6 billion) in 2017. Its cost of revenue increased 45%, 28%, and 22% in 2015, 2016, and 2017, respectively. Content costs, TACs, and bandwidth costs drove cost of revenue.
Content costs consumed 3.8% of revenue in 2014 compared to 15.9% in 2017. TACs used up 12.9% of revenue in 2014 compared to 11.4% in 2017. The bandwidth cost margin rose from 5.8% in 2014 to 6.6% in 2017. The cost of revenue margin rose from 38% in 2014 to 51% in 2017.
Thus, Baidu’s gross profit increased at a three-year CAGR of 11% to 41.7 billion yuan (or $6.4 billion) in 2017. Its gross profit increased 29% in 2015 before falling 9% in 2016. The decline in 2016 was due to slow revenue growth and rising cost of revenue. Its gross profit improved 18% in 2017. Thus, its gross margin declined from 62% in 2014 to 49% in 2017.
How much have costs increased for peers?
Microsoft’s (MSFT) cost of revenue increased $4.1 billion in the fiscal year ended June 30, 2018, partly due to traffic acquisition costs related to search advertising. Verizon’s (VZ) cost of services rose $223 million in the fiscal year ended December 31, 2017, due to higher content costs associated with the acquisition of Yahoo.
We’ll analyze Alphabet’s and Baidu’s operating margins in the next part.
