Is US Natural Gas Production Bearish for Natural Gas?
US dry natural gas production will likely average ~73.6 Bcf/d in 2017. It will likely rise by 4.9 Bcf/d or 6.6% to 78.5 Bcf/d in 2018.
Oct. 20 2017, Updated 12:06 p.m. ET

Weekly estimates: US natural gas production
US natural gas production rose by 1.3 Bcf/d (billion cubic feet per day) or 1.8% to 73.7 Bcf/d on October 12–18, 2017. Production rose by 3.5 Bcf/d or 4.9% from the same period in 2016.
High US gas production is bearish for natural gas (BOIL) (FCG) prices. Volatility in natural gas prices impacts gas producers (VDE) (IXC) like Exco Resources (XCO), Newfield Exploration (NFX), and EQT (EQT).
Weekly natural gas imports from Canada
PointLogic estimates that weekly natural gas imports from Canada fell 3.4% to 5.7 Bcf/d on October 12–18, 2017. However, imports rose 7.5% from the same period in 2016, which is bearish for natural gas (DGAZ) (UGAZ) (UNG) prices.
EIA’s monthly estimates
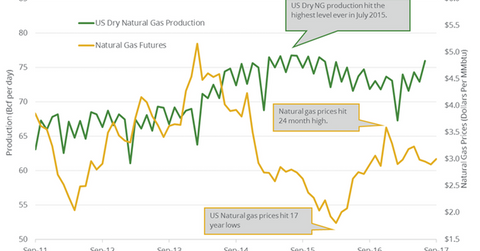
The EIA (U.S. Energy Information Administration) estimated that monthly US dry natural gas production was at 75.9 Bcf/d in July 2017—a 22-month high.
EIA’s annual production estimates
US dry natural gas production will likely average ~73.6 Bcf/d in 2017. It will likely rise by 4.9 Bcf/d or 6.6% to 78.5 Bcf/d in 2018. Gas production averaged 74.15 Bcf/d in 2015. It fell to 72.85 Bcf/d in 2016—the first fall in 11 years.
Impact
US natural gas supplies are expected to rise in 2018 due to high crude oil (USO) (SCO) and natural gas prices in 2018. Record US crude oil production in 2018 will likely increase the natural gas supplies. Natural gas is often the byproduct of crude oil production. High natural gas supplies could pressure natural gas (UNG) (GASL) prices.
In the next part, we’ll discuss US natural gas consumption.
