US Gasoline Demand Today: Bullish or Bearish for Crude?
The EIA estimates that weekly US gasoline demand fell 178,000 bpd (barrels per day) to 9.4 MMbpd between September 8 and September 15.
Sept. 27 2017, Updated 2:06 p.m. ET

US gasoline demand
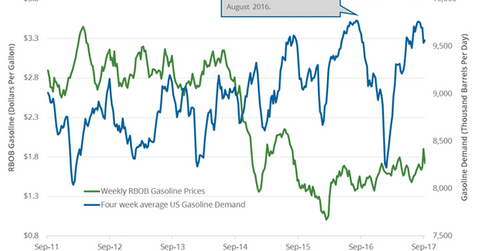
The EIA (US Energy Information Administration) estimates that weekly US gasoline demand fell 178,000 bpd (barrels per day) to 9.4 MMbpd (million barrels per day) between September 8, 2017, and September 15, 2017. Gasoline demand has fallen 209,000 bpd, or 2.2%, from the corresponding week in 2016.
The four-week average US gasoline demand fell 47,000 bpd to 9.5 MMbpd between September 8 and September 15. The four-week average gasoline demand has fallen 24,000 bpd, or 0.3%, from the corresponding week in 2016.
The fall in gasoline demand is bearish for gasoline (UGA) and crude oil (USO) (UWT) prices. Lower gasoline prices have a negative impact on US refining companies (CRAK) like Western Refining (WNR), Marathon Petroleum (MPC), and Phillips 66 (PSX).
Similarly, lower crude oil prices have a negative impact on oil producers (XOP) (VDE) (IEZ) like Denbury Resources (DNR), Warren Resources (WRES), and QEP Resources (QEP).
US gasoline demand: peaks and lows
US gasoline demand hit an all-time high of 9.8 MMbpd in July 2017. In contrast, gasoline demand was at 8.0 MMbpd in January 2017—the lowest level since February 2014.
For the week ending September 15, weekly US gasoline demand has risen 17.5% from the lows in January 2017, while US gasoline futures have risen 17% in the last 12 months.
US gasoline consumption estimates
The EIA estimates that US gasoline consumption will average 9.33 MMbpd in 2017. It could then rise to 9.37 MMbpd in 2018.
Gasoline consumption averaged 9.1 MMbpd in 2015 and 9.33 MMbpd in 2016. Consumption hit a record in 2016.
