iShares Russell 2000 Value
Latest iShares Russell 2000 Value News and Updates
MPC, TSO, VLO, PSX: Which Refining Stock Is Trading at a Premium?
Now, let’s look at the forward valuations of Marathon Petroleum (MPC), Tesoro (TSO), Valero Energy (VLO), and Phillips 66 (PSX).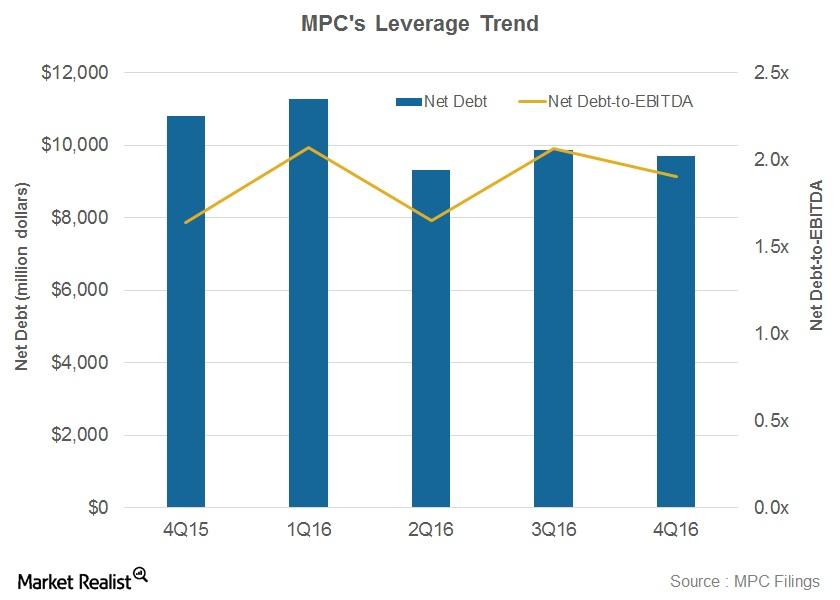
Marathon Petroleum’s Debt Is Lower than Industry Averages
Marathon Petroluem’s net debt-to-EBITDA ratio stood at 1.9x in 4Q16. It’s lower than the average industry ratio of 2.8x.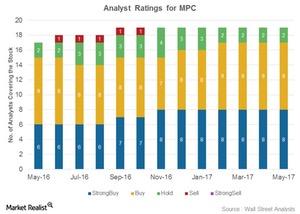
Why Most Analysts Are Calling Marathon Petroleum a ‘Buy’
Marathon Petroleum (MPC) has been rated by 19 Wall Street analysts. Seventeen analysts (or 89%) have rated it as a “buy” so far in May 2017.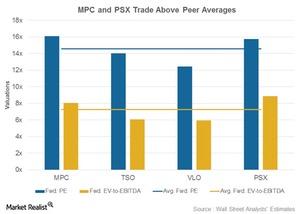
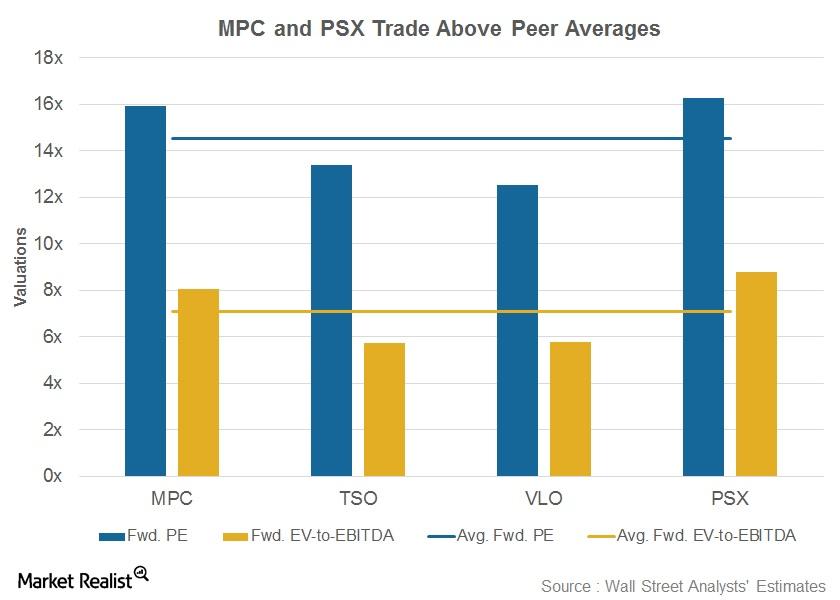
Comparing MPC’s, TSO’s, VLO’s, and PSX’s Valuation
Average valuation multiples Earlier, we discussed refining stocks’ performance in 1Q17 and compared their dividend yields. In this part, we’ll look at Marathon Petroleum’s (MPC), Tesoro’s (TSO), Valero Energy’s (VLO), and Phillips 66’s (PSX) forward valuation. The average forward EV-to-EBITDA (enterprise value to earnings before interest, tax, depreciation, and amortization) multiples and average forward PE […]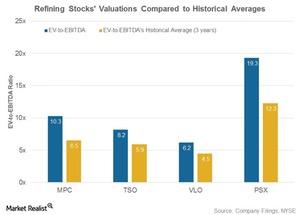
How Refining Stocks’ Historical Valuation Compares
Refining stocks’ valuation In this part, we’ll compare refining stocks’ EV-to-EBITDA (enterprise value to earnings before interest, tax, depreciation, and amortization) ratios with their three-year averages. Marathon Petroleum (MPC), Valero Energy (VLO), Phillips 66 (PSX), and Tesoro (TSO) are trading higher than their historical valuation. MPC was trading at a 10.3x EV-to-EBITDA ratio in 1Q17, compared […]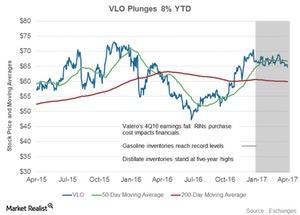
Understanding Valero’s Stock Performance Prior to the 1Q17 Results
Since February 2017, downstream stocks have been hit by volatile crack conditions and changing inventory levels. VLO has also witnessed volatility in its stock price.
How Refining Stocks’ Valuations Compare to Historical Averages
In this article, we’ll look at refining stocks’ EV-to-EBITDA (enterprise value to earnings before interest, tax, depreciation, and amortization) ratios compared to their three-year historical averages.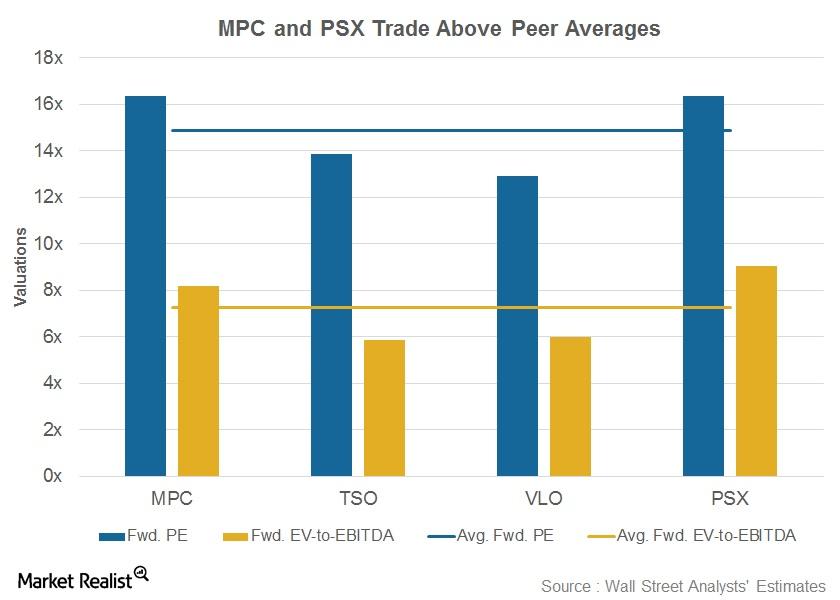
These Refining Stocks Are Trading at a Premium
PSX is trading at 9x its forward EV-to-EBITDA ratio and at 16.4x its forward PE ratio, which is above the peer averages.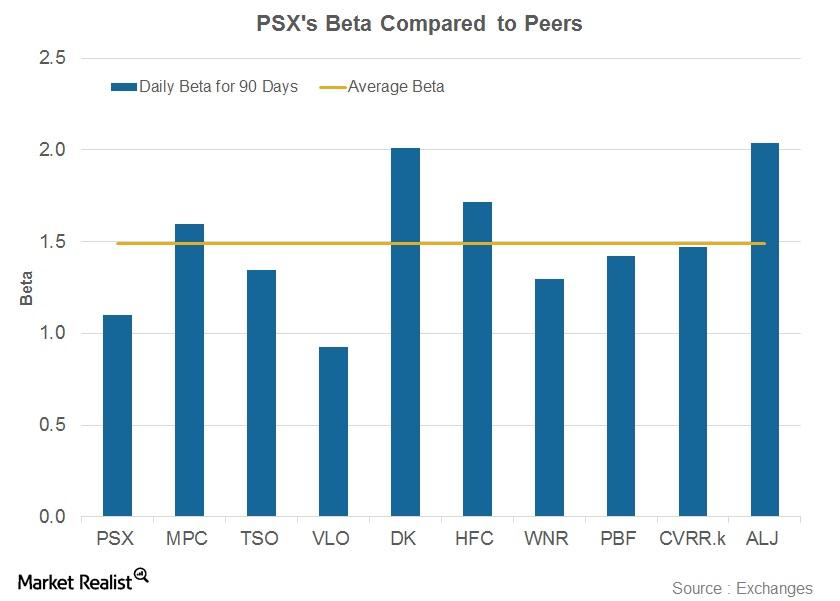
Phillips 66’s Beta: Does It Imply the Company Is Less Volatile?
Phillips 66’s 90-day daily beta stands at 1.1, which is below its peer average of 1.5.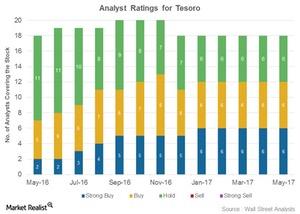
How Analysts Rated Tesoro on Its 1Q17 Earnings Day
Tesoro (TSO) has been rated by 18 analysts. Of those, 12 have assigned the stock a “buy” or “strong buy” rating.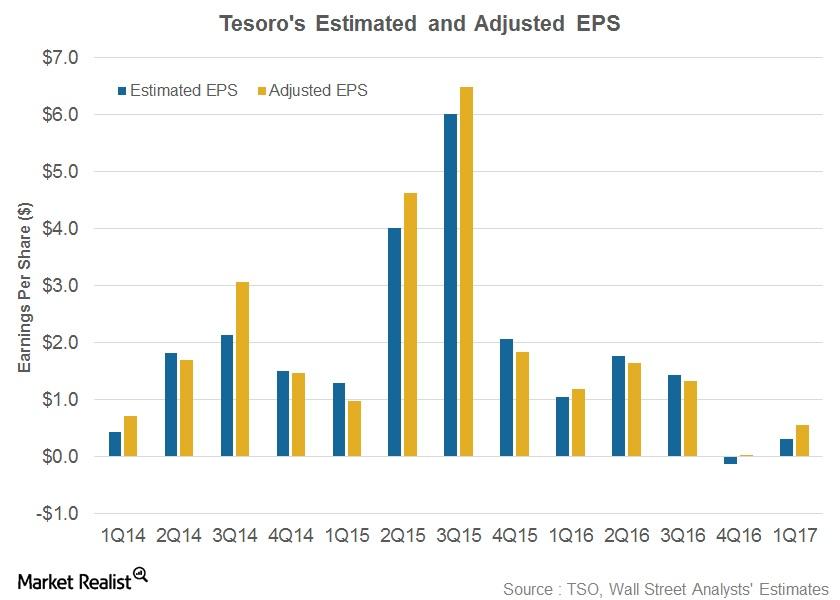
Tesoro Beats 1Q17 Earnings
Tesoro (TSO) posted its 1Q17 results on May 8, 2017. Revenues missed analysts’ estimate, but adjusted EPS of $0.55 surpassed the estimate of $0.31.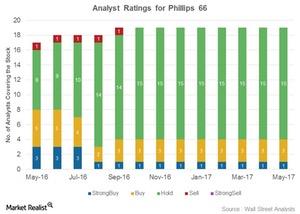
Analysts’ Ratings for Phillips 66 after Its 1Q17 Earnings
After its earnings, Phillips 66 was rated by 19 analysts. Four analysts gave it a “buy,” 15 gave it a “hold,” and no analysts gave it a “sell.”
Where Do Analysts Ratings for Tesoro Stand Pre-Earnings?
In this series, we’ve examined Tesoro’s (TSO) 1Q17 estimates, refining margin outlook, and stock performance ahead of its earnings release expected on May 8, 2017.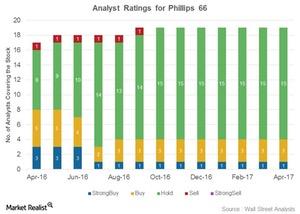
How Are Analysts Rating Phillips 66 before Its 1Q17 Earnings?
Phillips 66 has been rated by 19 analysts. Of those, four (or 21.0%) have given it a “buy” or “strong buy” rating.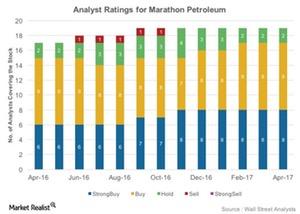
Marathon Petroleum on the Street: What’s Changed among Analysts?
Of the 19 analysts covering MPC, 17 (89%) analysts have assigned “buy” or “strong buy” ratings, while two (11%) have assigned “hold” ratings.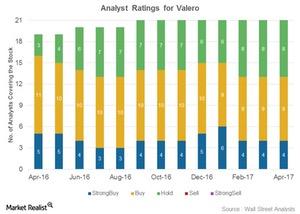
Analyst Ratings for Valero: Why the ‘Hold’ Ratings?
VLO’s mean price target of $72 per share implies around a 10% gain from its current level.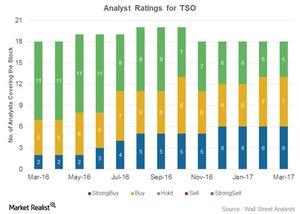
Why Most Analysts’ Ratings for Tesoro Are ‘Buys’
Thirteen out of the 18 analysts covering Tesoro (TSO) have rated it as a “buy” so far in March 2017. Another five analysts have rated TSO as a “hold.”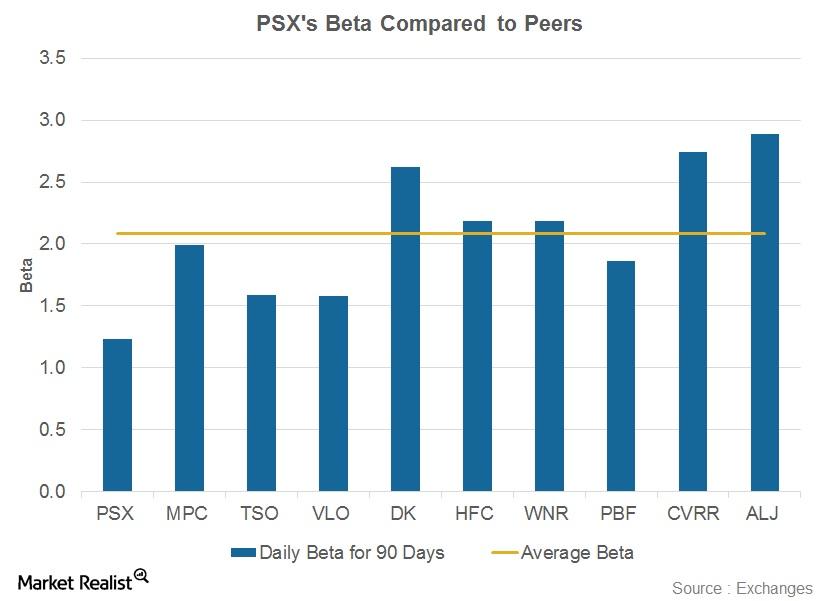
Phillips 66’s Beta: Does It Imply That PSX Is Less Volatile?
Phillips 66’s (PSX) 90-day beta stood at 1.2 on March 16, 2017, below its peer average of 2.1.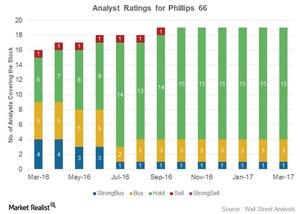
Why the Majority of Analysts Rate Phillips 66 as a ‘Hold’
Fifteen out of the 19 analysts covering Phillips 66 (PSX) rated it as a “hold” in March 2017. Another four analysts rated PSX as a “buy” or a “strong buy.”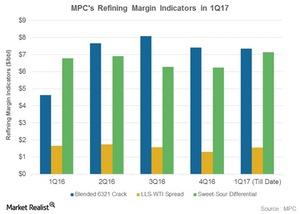
Could Marathon Petroleum’s Refining Earnings Rise in 1Q17?
Marathon Petroleum’s refining earnings are impacted by the blended LLS 6-3-2-1 crack, the sweet-sour differential, and the LLS-WTI spread.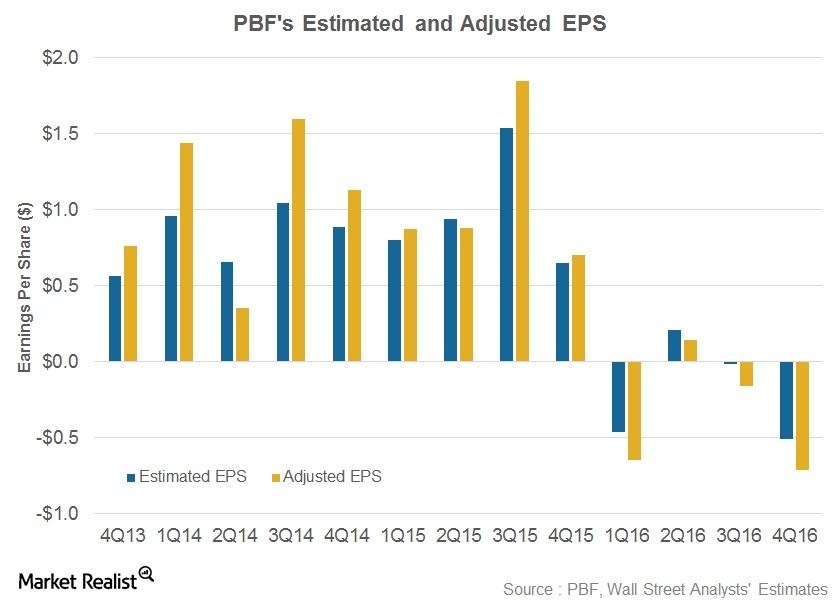
PBF Energy’s 4Q16 Results: Earnings Take a Nosedive
PBF Energy (PBF) released its 4Q16 results on February 16, 2017. The earnings results weren’t very encouraging for this petroleum refiner.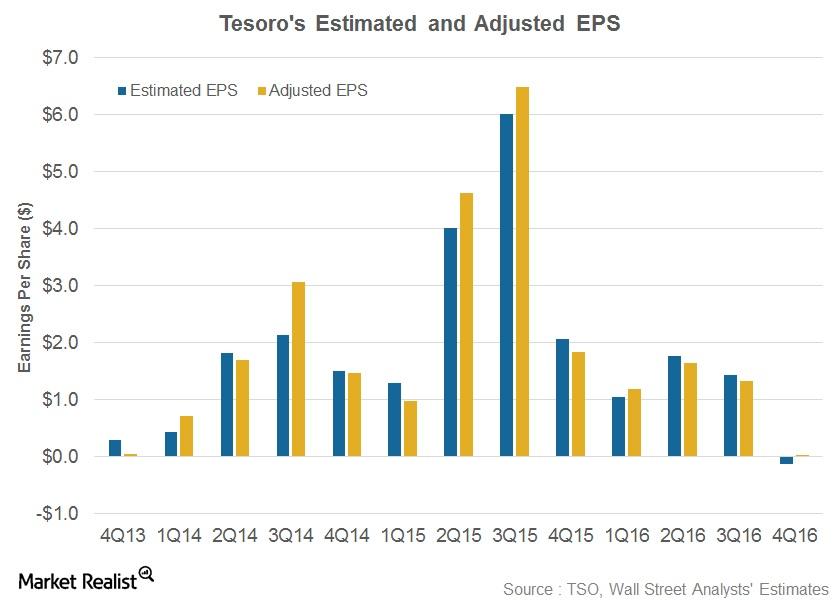
Tesoro Stayed Positive despite the Fall in Its 4Q16 Earnings
Tesoro (TSO) posted its 4Q16 results on February 6, 2017. It reported revenues of $6.6 billion, which missed Wall Street analysts’ estimates.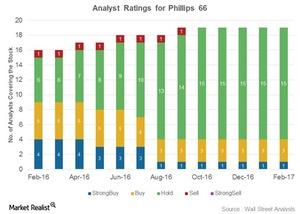
Phillips 66’s Recommendations: What the Analysts Are Saying Now
After its 4Q16 results, four of 19 analysts assigned “buy” or “strong buy” recommendations to Phillip’s 66 stock, while 15 assigned “holds.”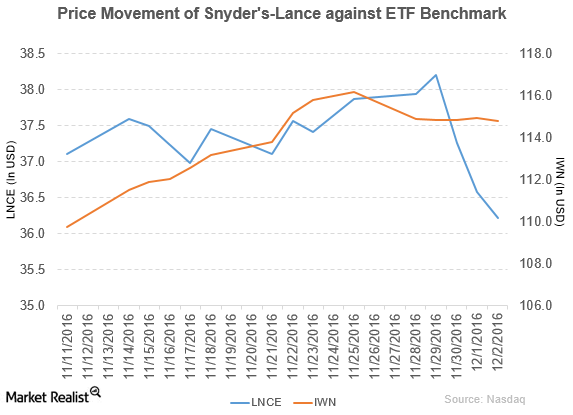
Snyder’s-Lance Plans to Sell Diamond of California
Snyder’s-Lance (LNCE) fell 4.4% to close at $36.22 per share during the fifth week of November 2016.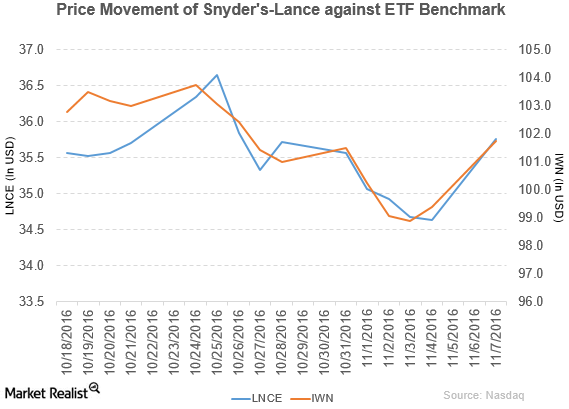
How Did Snyder’s-Lance Perform in 3Q16?
Price movement Snyder’s-Lance (LNCE) has a market cap of $3.5 billion. It rose 3.2% to close at $35.76 per share on November 7, 2016. The stock’s weekly, monthly, and year-to-date (or YTD) price movements were 0.53%, 4.4%, and 5.8%, respectively, on the same day. LNCE is trading 1.2% above its 20-day moving average, 3.1% above […]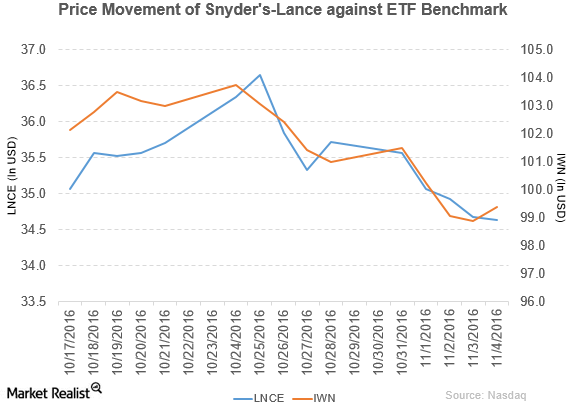
Snyder’s-Lance Declares Dividend of $0.16 per Share
Snyder’s-Lance (LNCE) has a market cap of $3.4 billion. It fell 0.12% to close at $34.64 per share on November 4, 2016.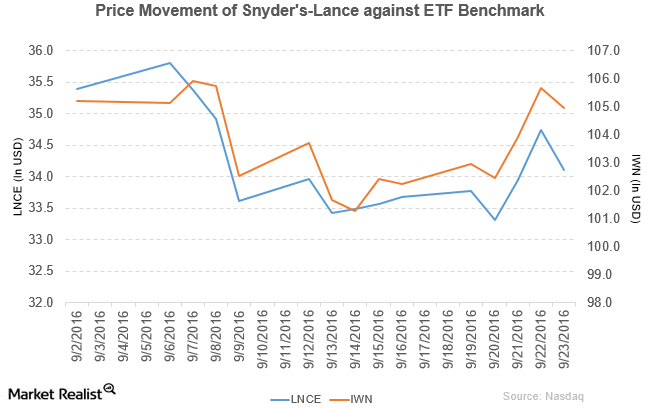
Snyder’s-Lance Appoints Pease as Executive Vice President
Price movement Snyder’s-Lance (LNCE) has a market cap of $3.3 billion. It fell 1.8% to close at $34.10 per share on September 23, 2016. The stock’s weekly, monthly, and year-to-date (or YTD) price movements were 1.3%, -3.3%, and 0.92%, respectively, on the same day. LNCE is trading 1.5% below its 20-day moving average, 1.8% below […]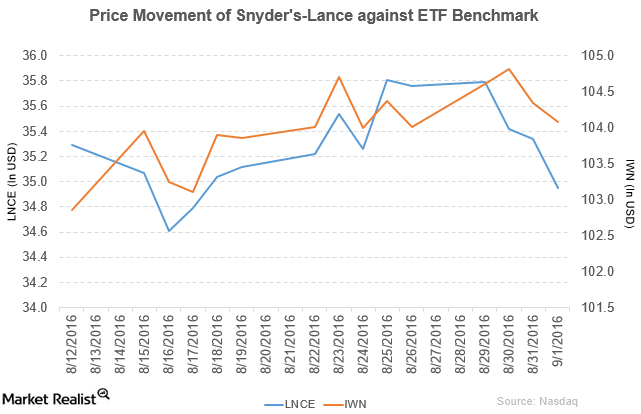
Snyder’s-Lance Acquired Metcalfe’s Skinny to Expand Its Business
Snyder’s-Lance fell by 1.1% to close at $34.95 per share on September 1, 2016. Its weekly, monthly, and YTD price movements were -2.4%, 2.2%, and 3.4%.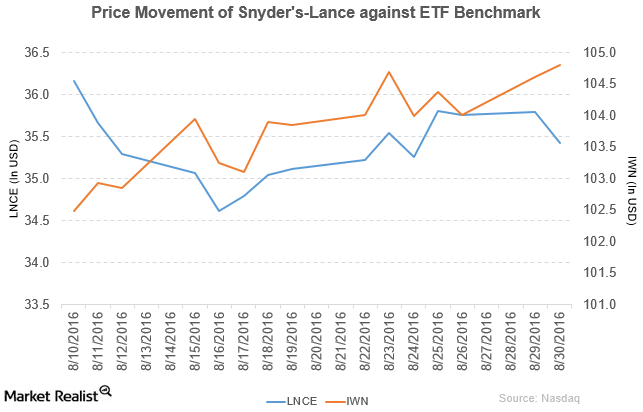
Why Did Snyder’s-Lance Recall Some of Its Products?
Snyder’s-Lance (LNCE) has a market cap of $3.4 billion. It fell by 1.0% to close at $35.42 per share on August 30, 2016.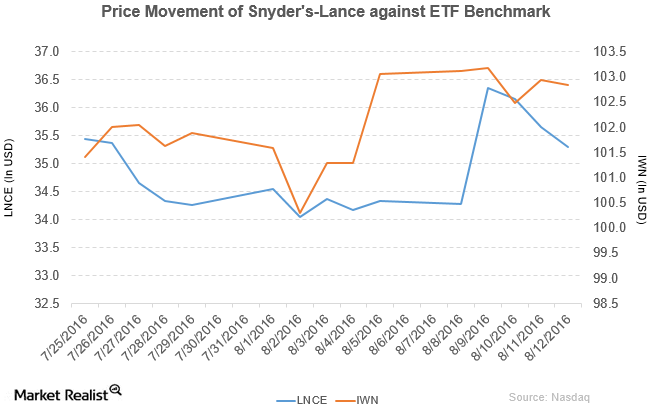
Analyzing Snyder’s-Lance Performance in 2Q16
Snyder’s-Lance rose by 2.8% and closed at $35.29 per share during the second week of August 2016. It reported fiscal 2Q16 net revenue of $609.5 million.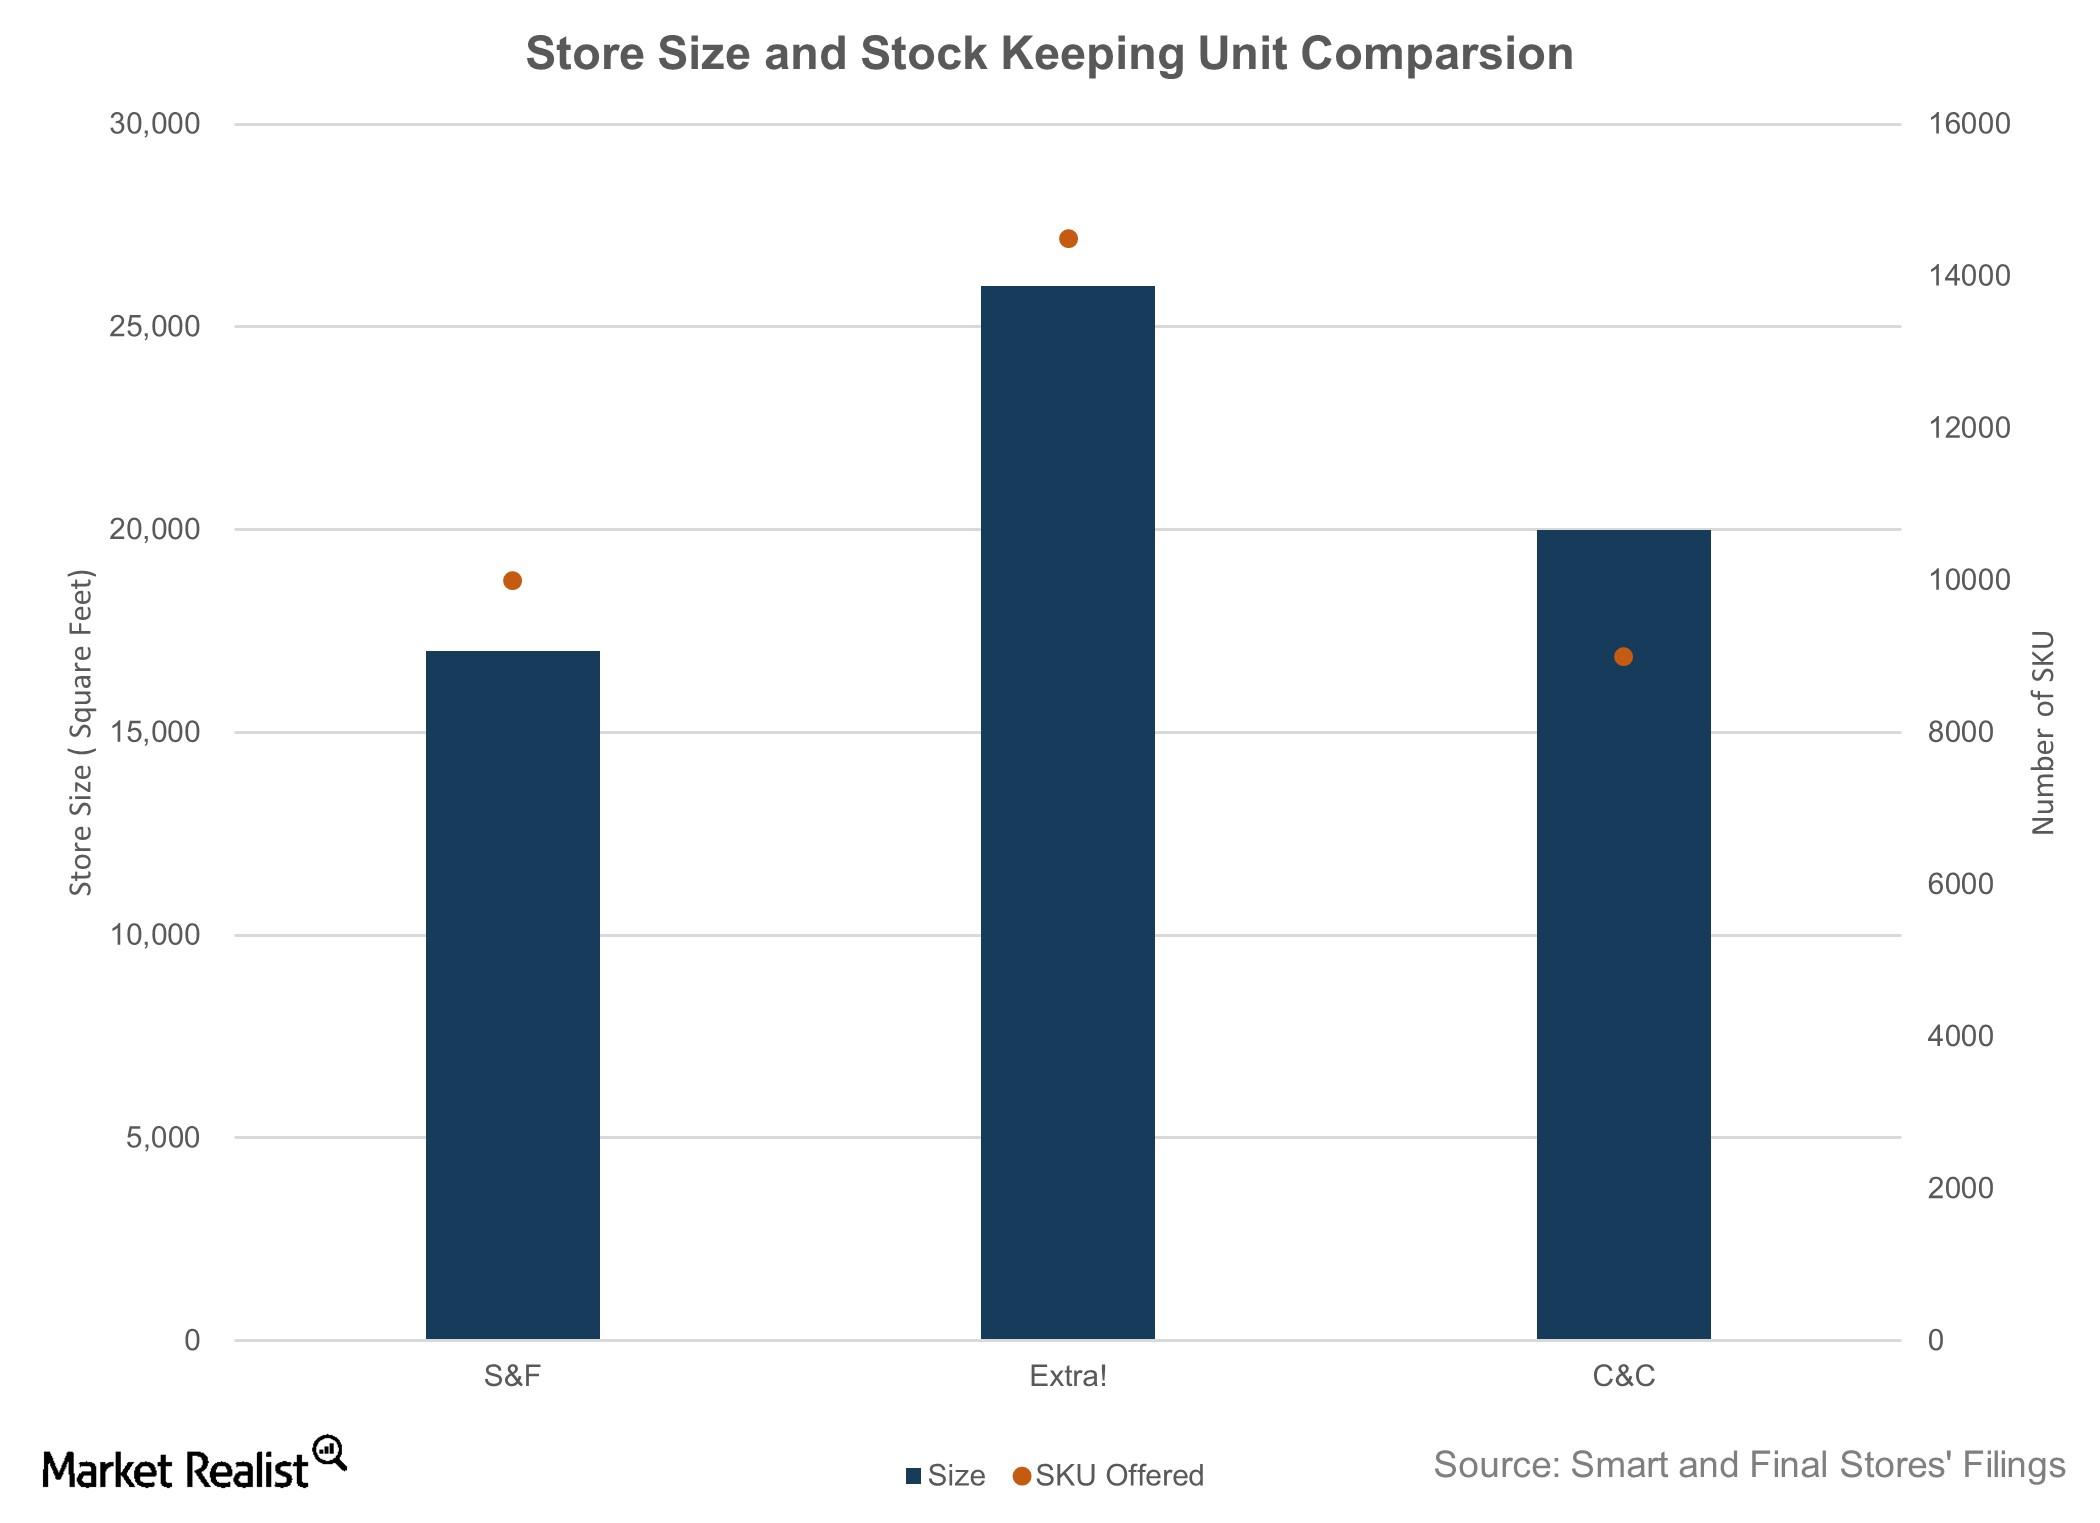
What Does a Typical Smart & Final Store Look Like?
Smart & Final stores have a smaller physical footprint than other warehouse clubs and grocery chains, but they offer a larger SKU selection.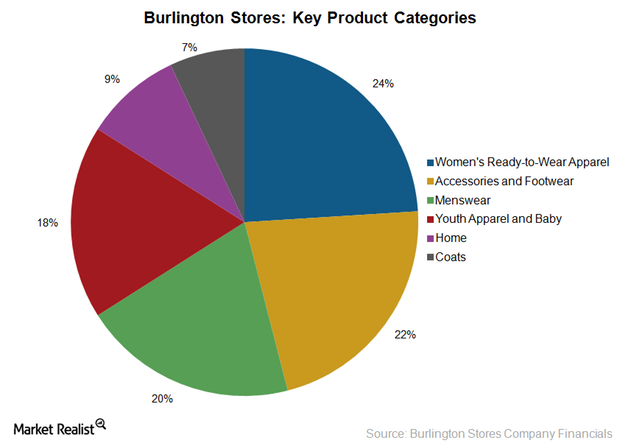
Understanding Burlington Stores’ Key Product Categories
Burlington Stores derives its revenue from the sale of value-priced apparel, coats, and family footwear, baby furniture, accessories, home décor, and gifts.