Marathon Petroleum’s Debt Is Lower than Industry Averages
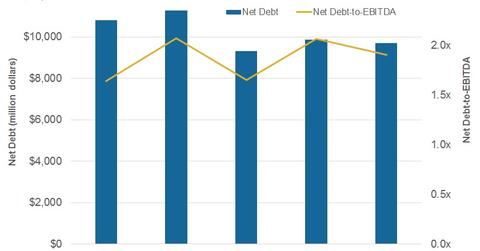
Marathon Petroluem’s net debt-to-EBITDA ratio stood at 1.9x in 4Q16. It’s lower than the average industry ratio of 2.8x.
Nov. 20 2020, Updated 4:57 p.m. ET

Marathon Petroleum’s debt
In this series, we discussed Marathon Petroleum’s (MPC) credit rating, segmental performance in terms of the earnings model and capex, refining margin trend, and refining yields. We also discussed the likely direction of Marathon Petroleum’s refining earnings in 1Q17 followed by the operational performances of Marathon Petroleum’s segments in 4Q16. In this part, we’ll examine the company’s leverage position.
Marathon Petroluem’s net debt-to-EBITDA (earnings before interest, tax, depreciation, and amortization) ratio stood at 1.9x in 4Q16. It’s lower than the average industry ratio of 2.8x. Usually, everything else being equal, a lower ratio signifies a healthier leverage position and better capacity to repay debt.
The industry average considers ten US refining companies including leading players Tesoro (TSO), Valero Energy (VLO), and Phillips 66 (PSX). The net debt-to-EBITDA ratio shows a firm’s leverage position as a multiple of its operating earnings.
The average also considers smaller refiners like Delek US Holdings (DK), Western Refining (WNR), and Alon USA Energy (ALJ) that have high leverage ratios. For exposure to small-cap stocks, you can consider the iShares Russell 2000 Value ETF (IWN) (RUT-INDEX). IWN has ~6% exposure to energy sector stocks, including Delek US Holdings, Western Refining, and Alon USA Energy.
In 4Q16, Marathon Petroleum’s total debt-to-capital ratio stood at 33%. It’s also below the industry average of 38%. The debt-to-capital ratio shows a firm’s leverage position and capital structure.
Net debt-to-EBITDA trend
Marathon Petroleum’s net debt-to-EBITDA ratio rose from 1.6x in 4Q15 to 1.9x in 4Q16. Before analyzing the rise in the ratio, let’s understand the net debt position.
Marathon Petroleum’s net debt fell from $10.8 billion in 4Q15 to $9.7 billion in 4Q16. It fell due to a steeper fall in total debt compared to the fall in cash reserves. In 4Q16, Marathon Petroleum’s total debt stood at $10.6 billion. Its cash and equivalents were at $0.9 billion.
The company’s EBITDA fell from 4Q15 to 4Q16 because of lower earnings from its core refining business. A steeper fall in EBITDA, compared to a fall in net debt, led to an increase in the net debt-to-EBITDA multiple in 4Q16—compared to 4Q15.
However, despite the rising net debt-to-EBITDA multiple, Marathon Petroleum’s leverage ratios stand below the industry averages. As a result, Marathon Petroleum (MPC) is in a relatively comfortable leverage position.
To learn more about how Marathon Petroleum’s market performance is shaping up, read Marathon Petroleum Stock: A Key Look at Recent Performance.
