Fidelity MSCI Energy Index ETF
Latest Fidelity MSCI Energy Index ETF News and Updates
Why Did Crude Oil Prices Rise?
On February 9, 2017, US crude oil futures contracts for March delivery closed at $53.00 per barrel—an ~1.3% rise compared to the previous trading session.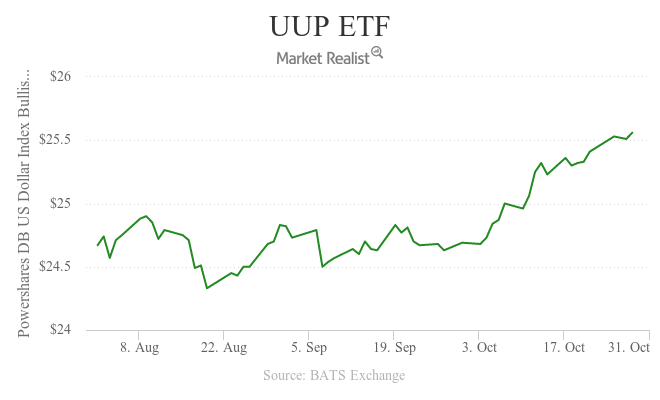
US Dollar Index Fell: How Will It Impact Crude Oil Prices?
The US Dollar Index fell 0.5% to 98.3 on October 28, 2016. It fell due to political uncertainty in the US. It had risen earlier in the morning on October 28.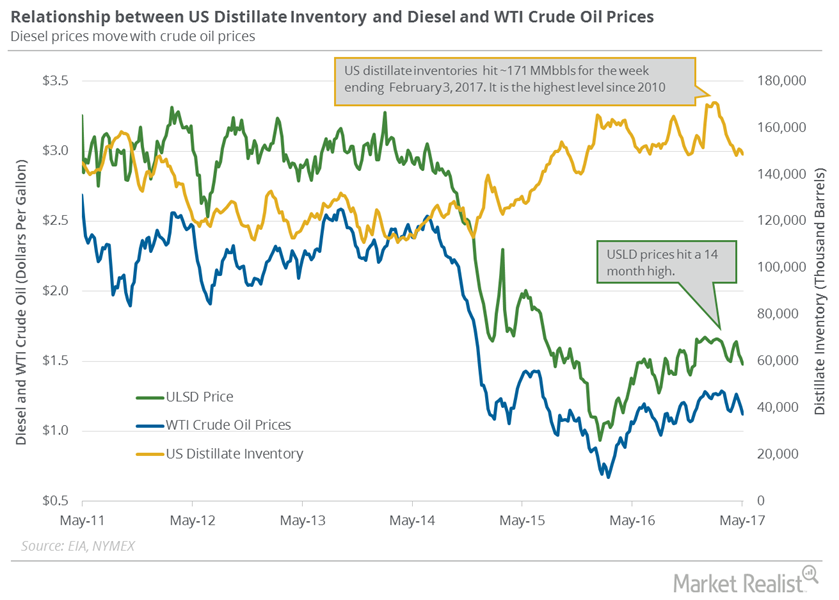
Why Did US Distillate Inventories Fall Again?
June diesel futures contracts rose 2.1% to $1.47 per gallon on May 10, 2017. Prices rose due to the larger-than-expected fall in distillate inventories.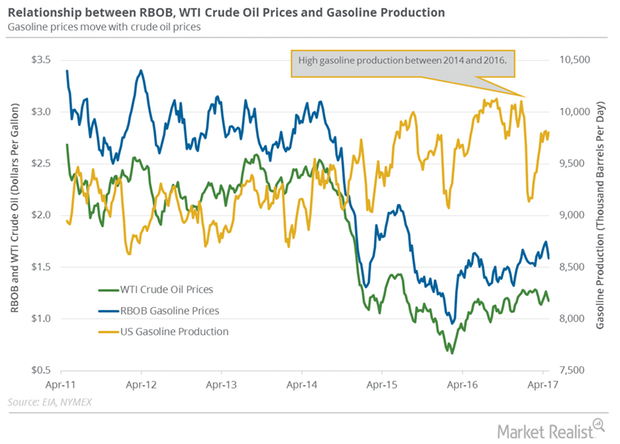
US Crude Oil and Gasoline Futures Moved Together
June gasoline futures contracts rose 1.3% to $1.53 per gallon on May 3, 2017. Prices rose due to the less-than-expected rise in US gasoline inventories.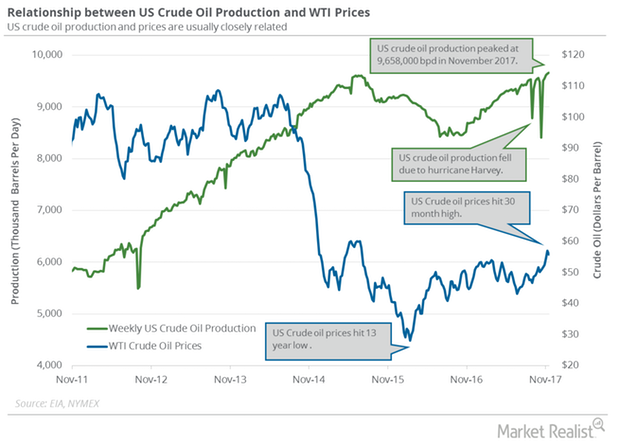
Why US Crude Oil Production Could Hit a Record High in 2018
US crude oil production According to the EIA (U.S. Energy Information Administration), US crude oil production rose 13,000 bpd (barrels per day) to 9,658,000 bpd between November 10 and 17, 2017. Production, which rose for the fifth straight week, has been pressuring oil (SCO) prices in the last few weeks. Production has risen 977,000 bpd (11.3%) year-over-year. Any […]
Hedge Funds’ Net Long Positions in US Crude Oil Rose Again
Hedge funds increased their net bullish positions in US crude oil futures and options rose by 36,834 contracts to 215,488 contracts on July 11–18, 2017.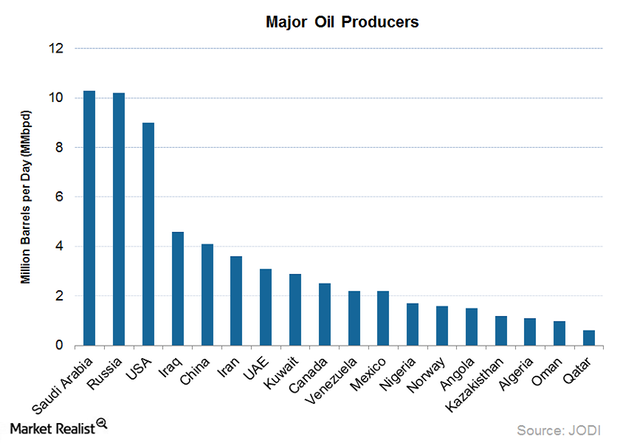
How OPEC and Non-OPEC Producers Affect Crude Oil Prices
Crude oil (BNO) (PXI) (USL) (USO) (UCO) prices were up ~4% between December 7, 2016, and December 19, 2016.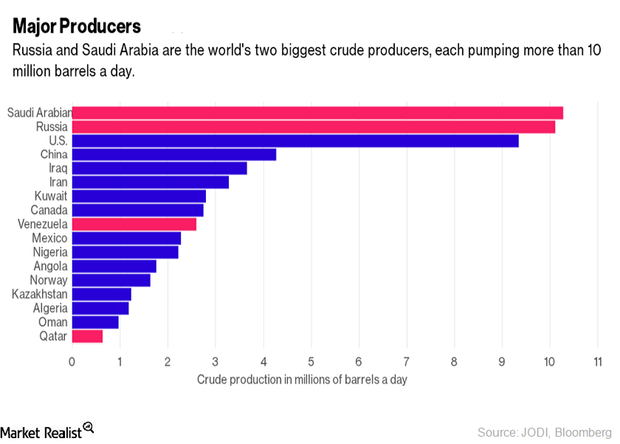
Decoding the Major Oil Producers’ Meeting in Algeria
OPEC producers’ meeting was held from September 26–28, 2016. Crude oil prices rose 12% in August 2016 due to speculation about the meeting’s outcome.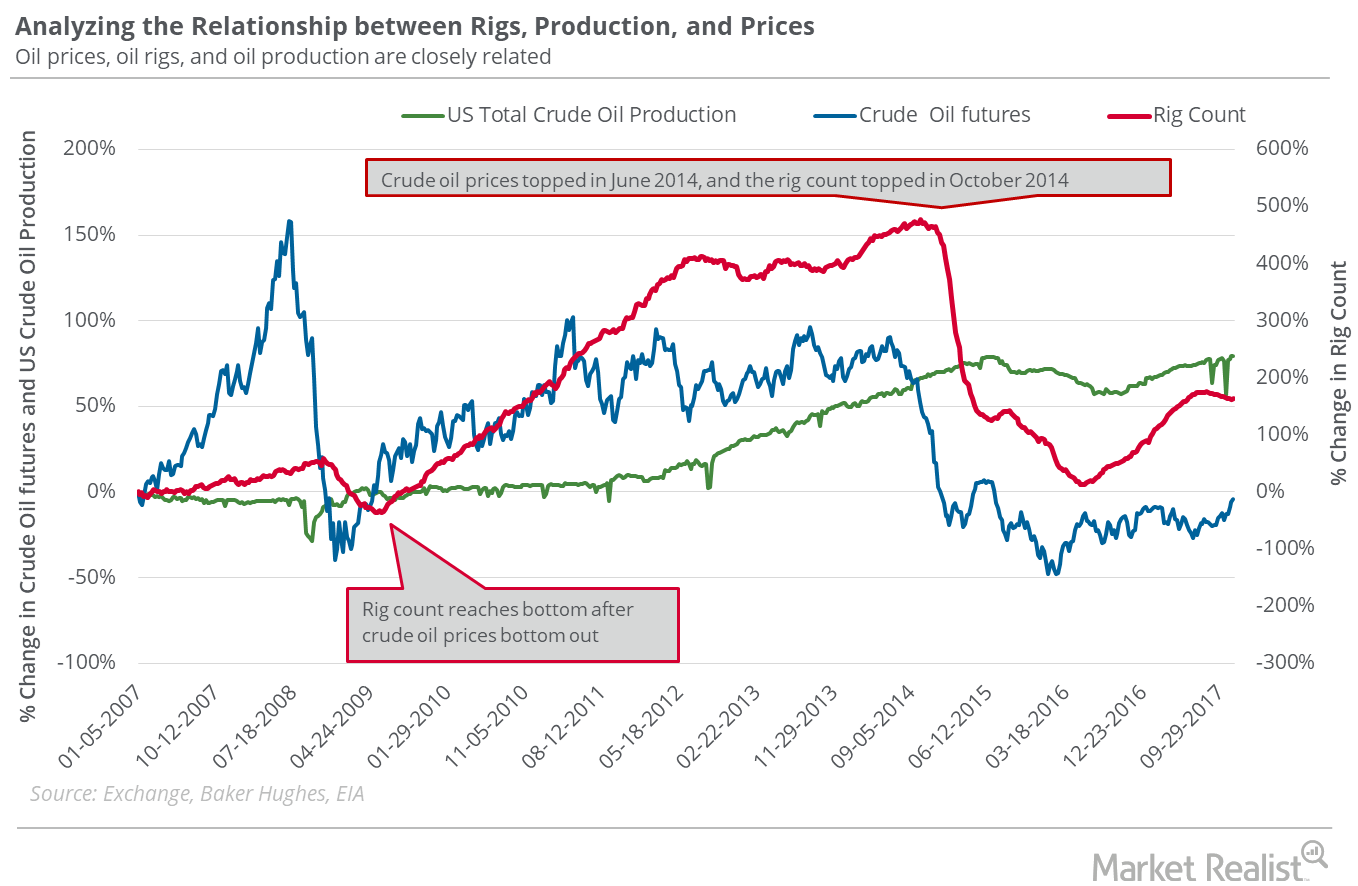
Bullish Oil Traders Must Count the Oil Rigs
On November 24, 2017, US crude oil settled at the highest closing price in 2017. The oil rig count could be at a three-year high by May 2018.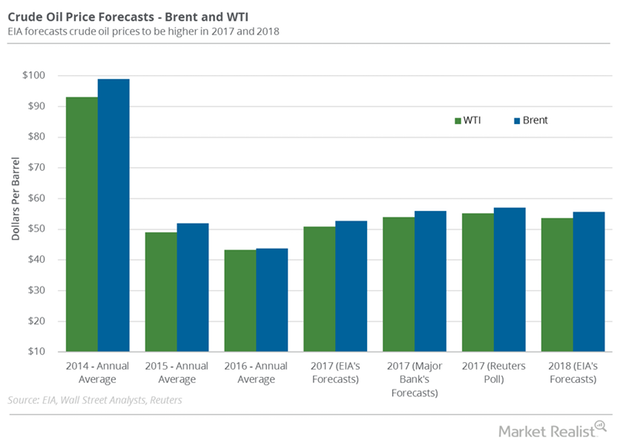
Hedge Funds’ Net Bullish Positions on US Crude Oil
Hedge funds reduced their net bullish positions in US crude oil futures and options by 1,136 contracts to 133,606 contracts on June 20–27, 2017.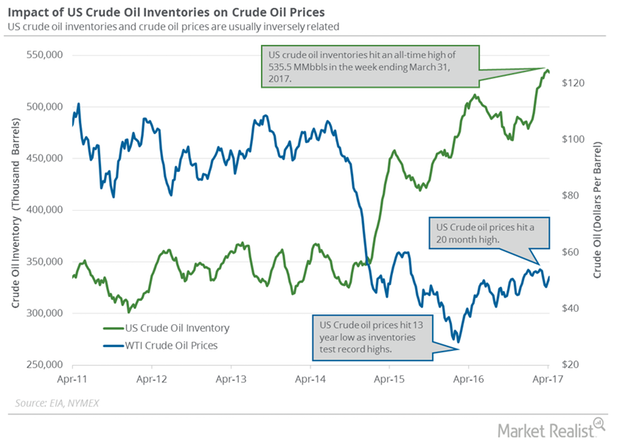
Will the EIA’s Crude Oil Inventories Support Crude Oil Bulls?
On April 18, 2017, the API released its weekly crude oil inventory report. It reported that US crude oil inventories fell by 0.84 MMbbls from April 7–14.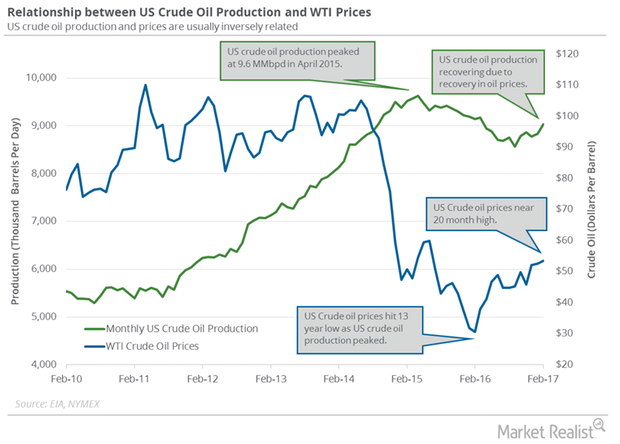
Could US Crude Oil Production Push Production Cut Deal Past 2017?
The EIA reported that monthly US crude oil production rose 196,000 bpd to 9.0 MMbpd in February 2017.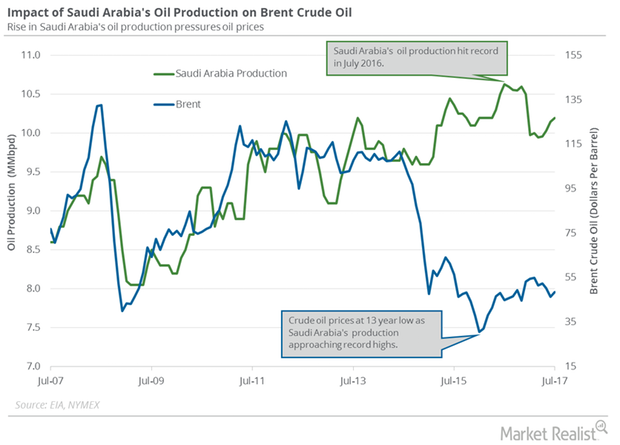
Will Saudi Arabia’s Production and Exports Support Crude Oil Futures?
The EIA (U.S. Energy Information Administration) estimates that Saudi Arabia’s crude oil production rose by 50,000 bpd (barrels per day) to 10.20 MMbpd (million barrels per day) in July 2017 compared to the previous month.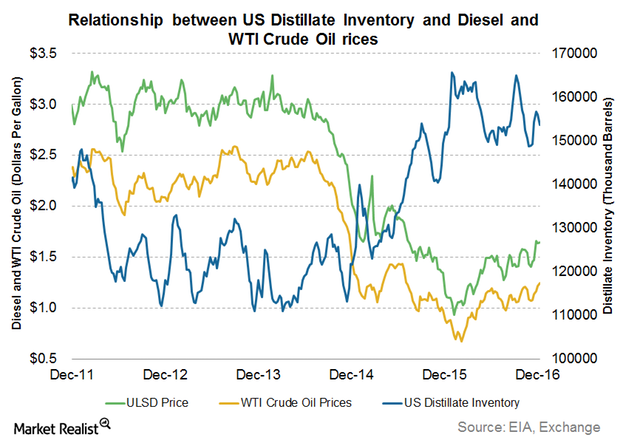
US Diesel Futures Follow Crude Oil Prices
February 2017 NY Harbor ULSD futures fell and settled at $1.66 per gallon on December 21. Diesel futures fell despite the fall in distillate inventories.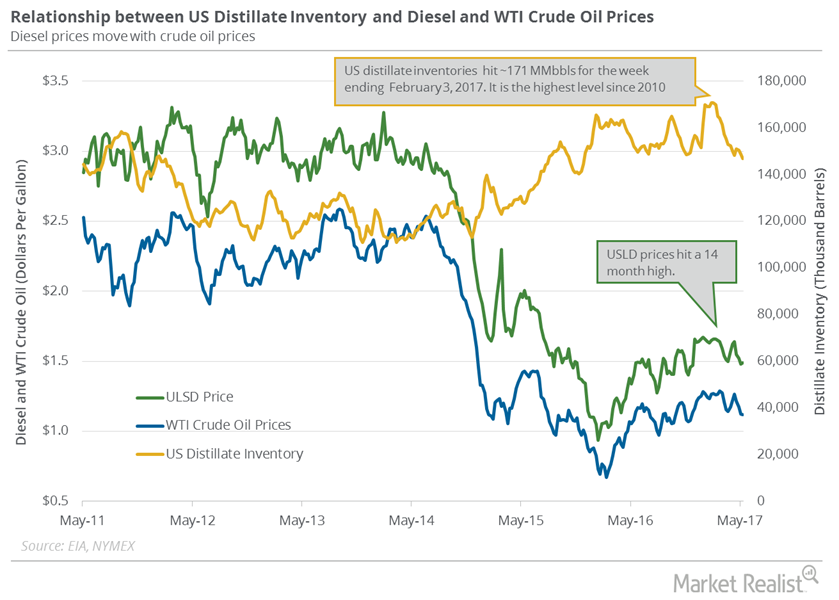
US Distillate Inventories Fell for the Third Straight Week
The EIA reported that US distillate inventories fell by 1.9 MMbbls (million barrels) to 146.8 MMbbls on May 5–12, 2017.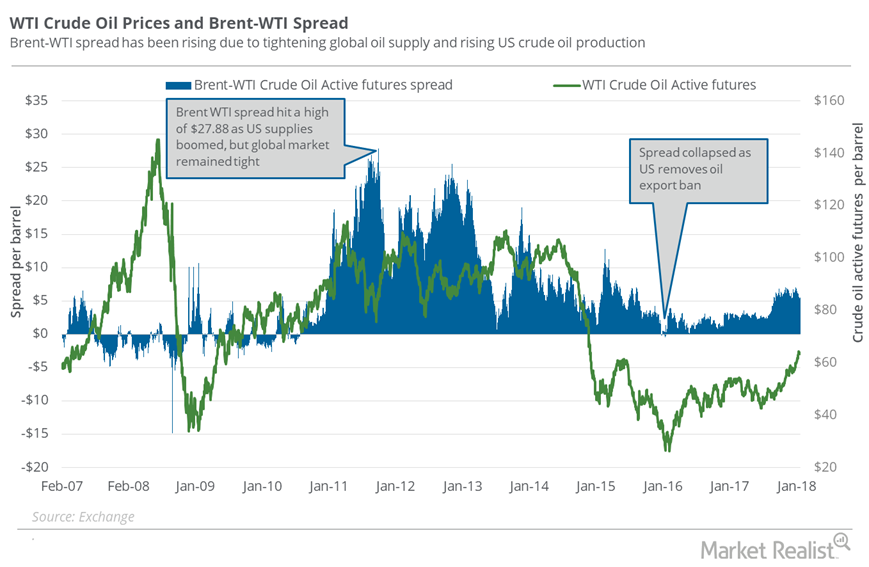
US Oil Exports Could Threaten International Oil Prices
In the week ending January 12, 2018, US crude oil exports were at ~1.25 MMbpd—234,000 barrels per day more than the previous week.
US Natural Gas Production and Consumption Could Impact Prices
According to PointLogic, US dry natural gas production increased by 0.3 Bcf (billion cubic feet) per day to 75.7 Bcf per day on January 11–17, 2018.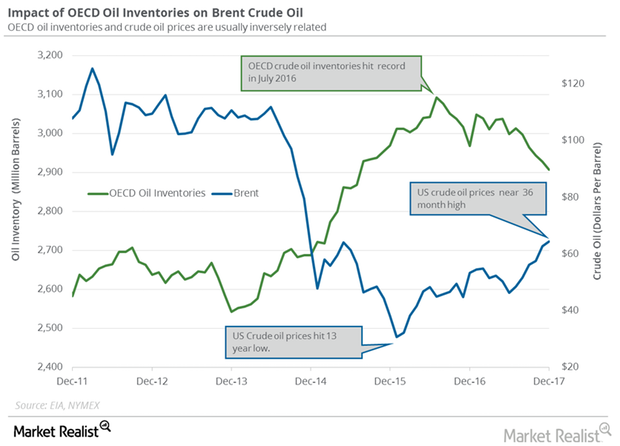
OECD’s Crude Oil Inventories: Trump Card for Crude Oil Bulls?
The EIA estimates that global crude oil inventories could rise in 2018 and 2019, which is bearish for oil prices.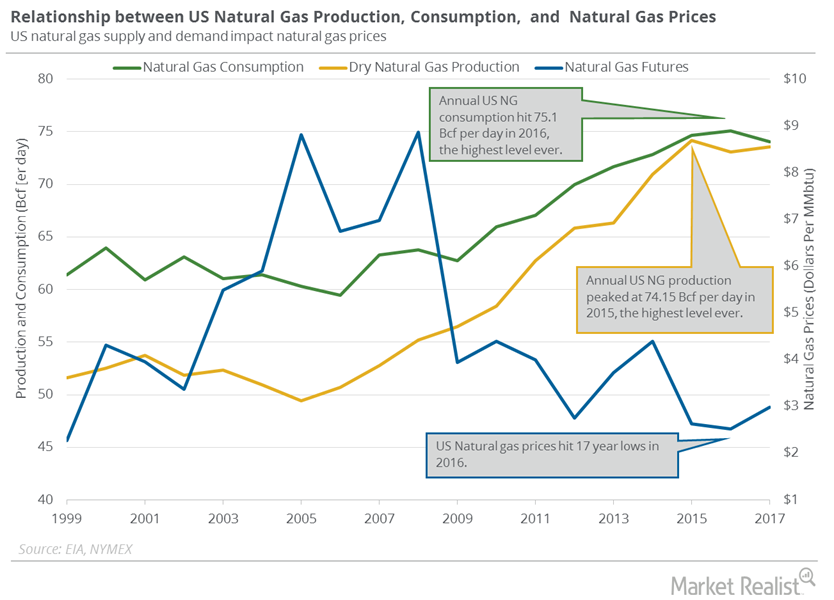
US Natural Gas Consumption Could Hit a Record in 2018 and 2019
US natural gas consumption fell 14.4% to 102.6 Bcf (billion cubic feet) per day on January 4–10, 2018, according to PointLogic.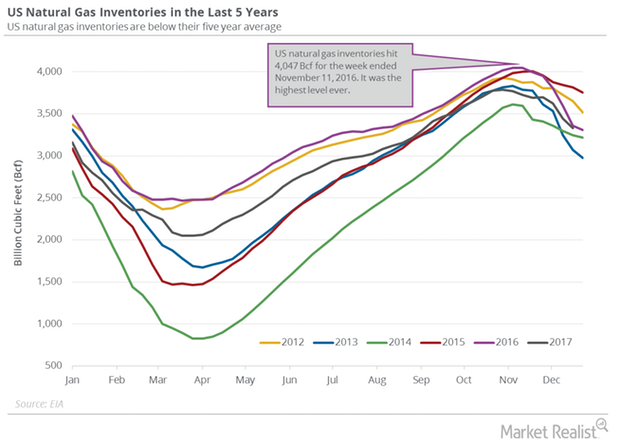
Natural Gas Inventories Could Help US Natural Gas Prices
A larger-than-expected withdrawal in US natural gas inventories compared to historical averages would help natural gas prices this week.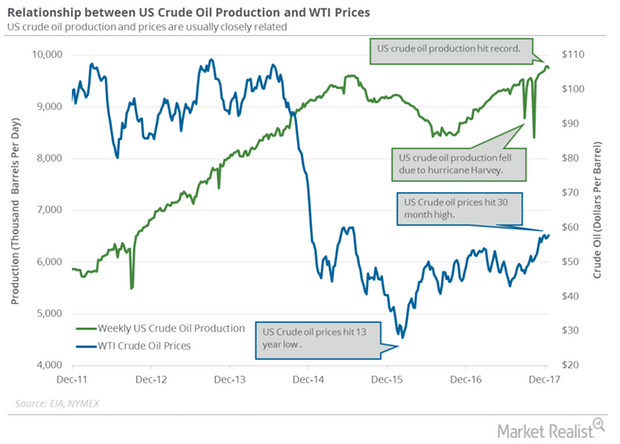
Weekly US Crude Oil Production Fell for the 1st Time since October
US crude oil production declined by 35,000 bpd (barrels per day) or 0.4% to 9,754,000 bpd from December 15 to 22, 2017, per the EIA.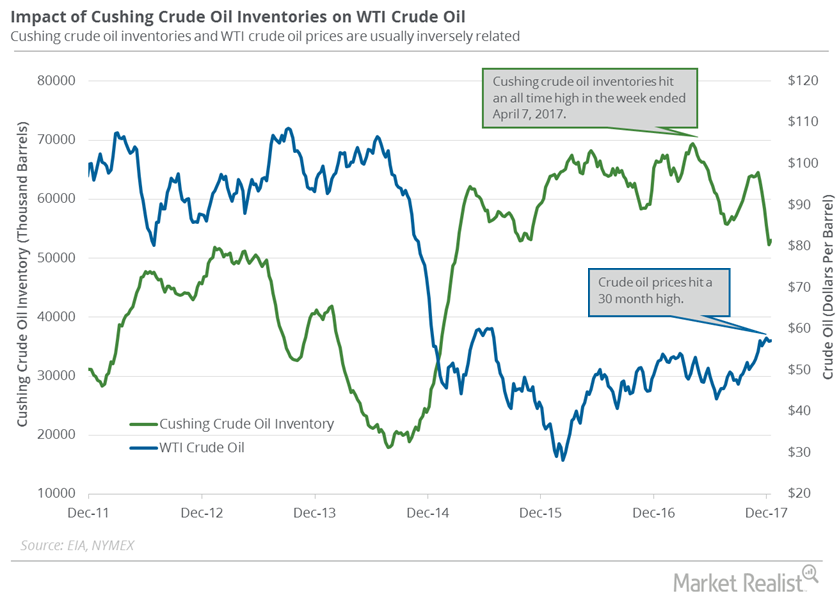
Cushing Inventories Rose for the First Time in Nearly 2 Months
Cushing inventories rose by 754,000 barrels or 1.4% to 52.9 MMbbls (million barrels) on December 8–15, 2017, according to the EIA.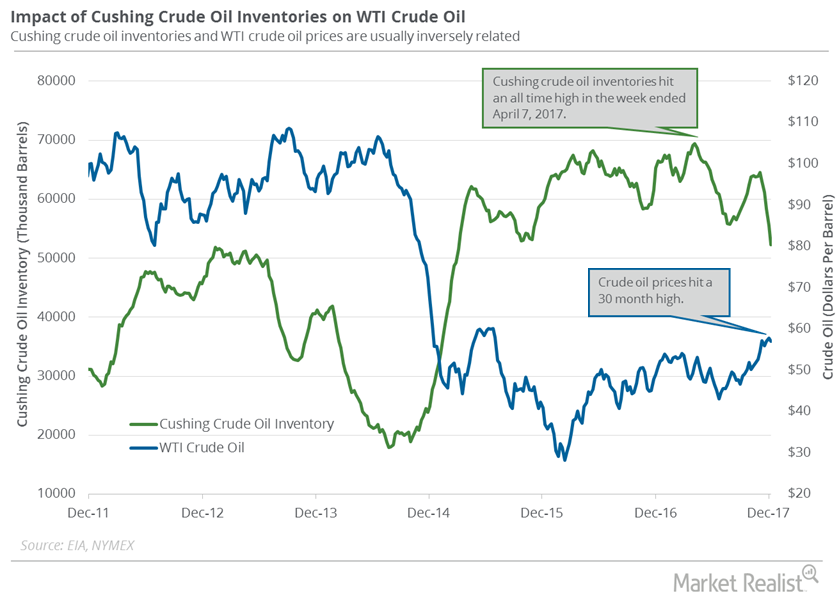
Cushing Inventories: Largest Weekly Fall since 2009
Cushing inventories fell by 3,317,000 barrels to 52.2 MMbbls (million barrels) on December 1–8, 2017, according to the EIA.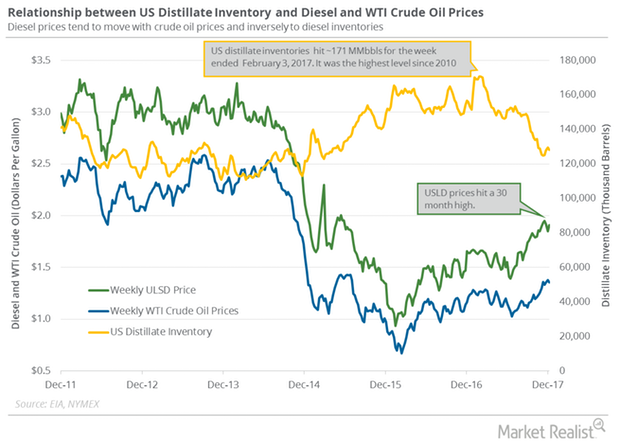
US Distillate Inventories Fell for the First Time in 4 Weeks
US distillate inventories fell by 1.3 MMbbls (million barrels) to 128.1 MMbbls on December 1–8, 2017, according to the EIA.
US Gasoline Inventories Add More Pain to Crude Oil Futures
According to the EIA, US gasoline inventories rose by 6,780,000 barrels to 220.8 MMbbls (million barrels) on November 24–December 1, 2017.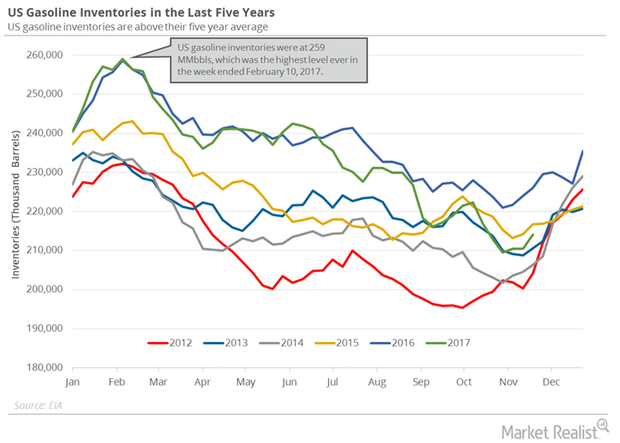
Analyzing US Gasoline Inventories and Demand
The API reported that US gasoline and distillate inventories rose by 9,200,000 barrels and 4,300,000 barrels on November 24–December 1, 2017.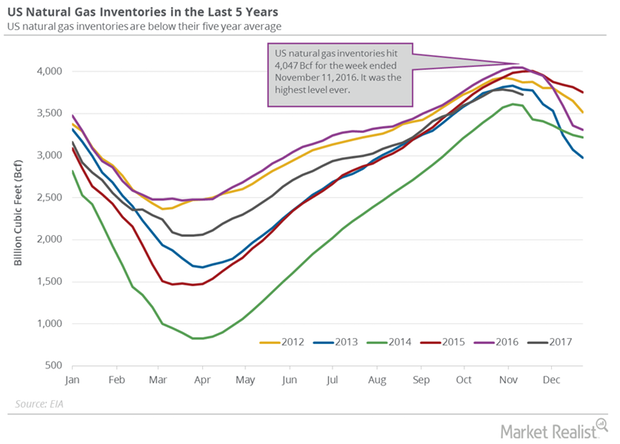
US Natural Gas Future Fell after the Natural Gas Inventory Report
The EIA released its natural gas inventory report on November 30, 2017. US natural gas inventories fell by 33 Bcf to 3,693 Bcf on November 17–24, 2017.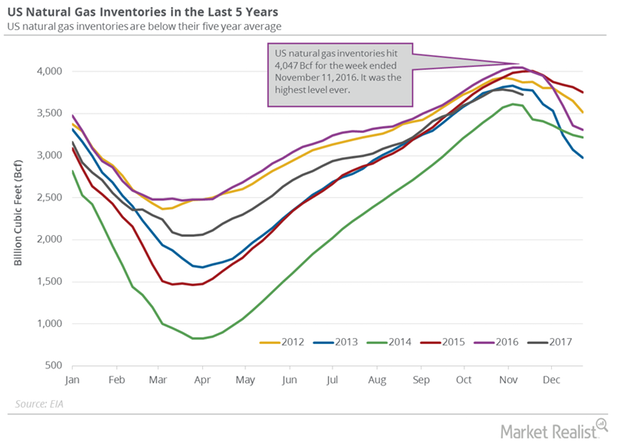
US Natural Gas Inventories Have Fallen 8% from Last Year
The EIA estimated that US natural gas inventories fell by 46 Bcf (billion cubic feet) or 1.2% to 3,726 Bcf on November 10–17, 2017.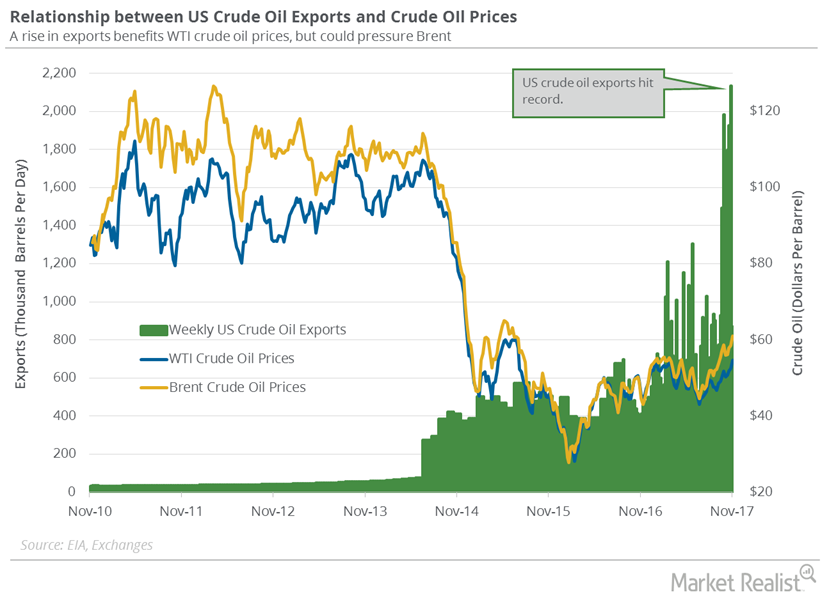
Russian and US Crude Oil Exports Are Important for Oil Bears
US crude oil exports fell by 1,264,000 bpd or 60% to 869,000 bpd on October 27–November 3, 2017. Exports rose by 459,000 bpd from the same period in 2016.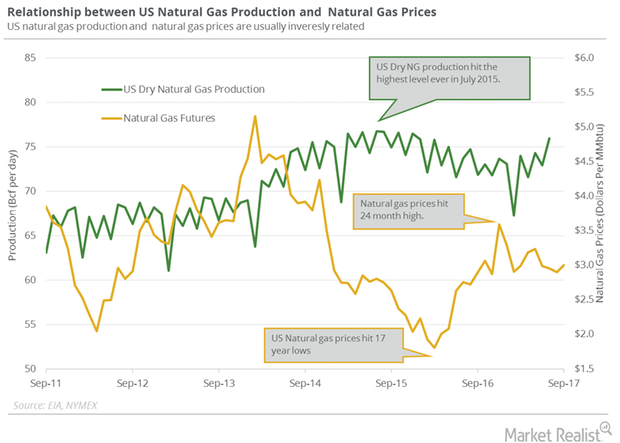
How Is US Natural Gas Production and Consumption Trending?
PointLogic estimates that weekly US dry natural gas production rose by 0.9 Bcf (billion cubic feet) per day to 74.6 Bcf per day between October 19 and October 25, 2017.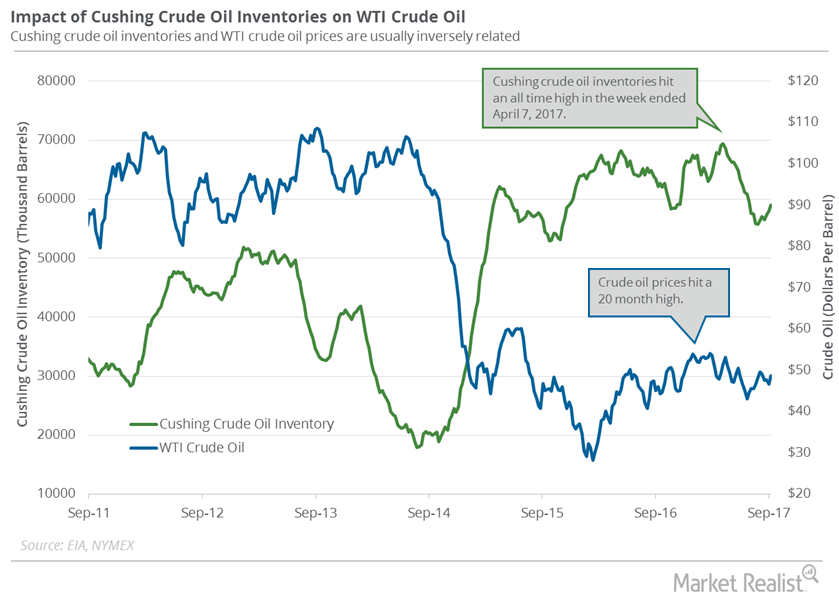
Cushing Inventories: Bullish or Bearish for Crude Oil Prices?
A market survey estimates that Cushing crude oil inventories has risen between September 8 and September 15.
Could the Oil Rig Count Threaten Bullish Bets on Oil Prices?
The US oil rig count rose by three to 768 for the week ended August 11, 2017.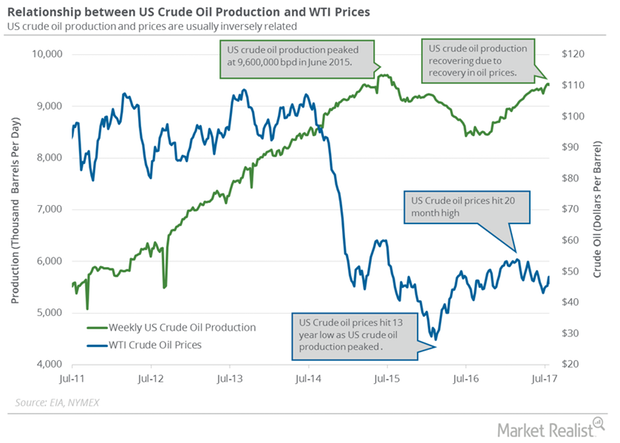
EIA Upgrades US Crude Oil Production Estimates for 2017 and 2018
The EIA released its Short-Term Energy Outlook report on August 8, 2017. It estimates that US crude oil production could average 9.35 MMbpd in 2017.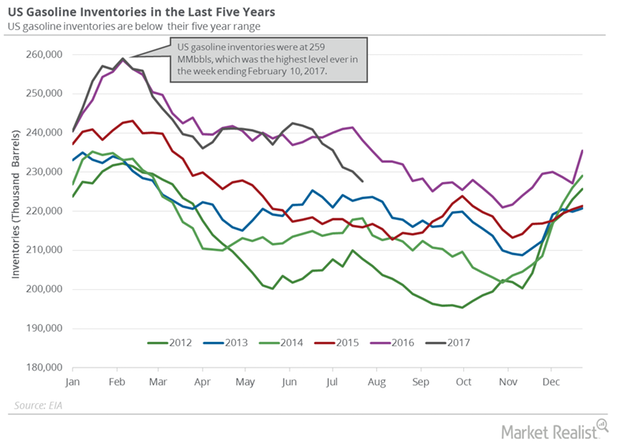
US Gasoline Inventories Fell, Supported Gasoline Oil Prices
The EIA reported that US gasoline inventories fell 1.1% or by 2.5 MMbbls (million barrels) to 227.7 MMbbls on July 21–28, 2017.
Oil Rigs: Oil Prices Could Make a U-Turn
The US oil rig count extended to 765 in the week ending July 14, 2017—a gain of two rigs compared to the previous week.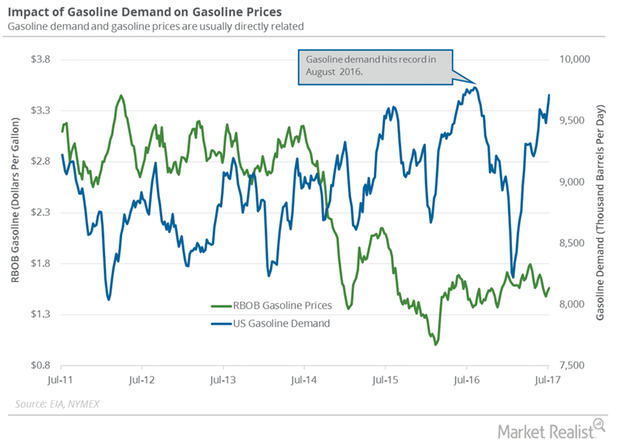
Near Record US Gasoline Demand: Are the Bulls Taking Control?
The EIA estimates that the four-week average for US gasoline demand rose 129,000 bpd (barrels per day) to 9.7 MMbpd (million barrels per day) from July 7 to 14, 2017.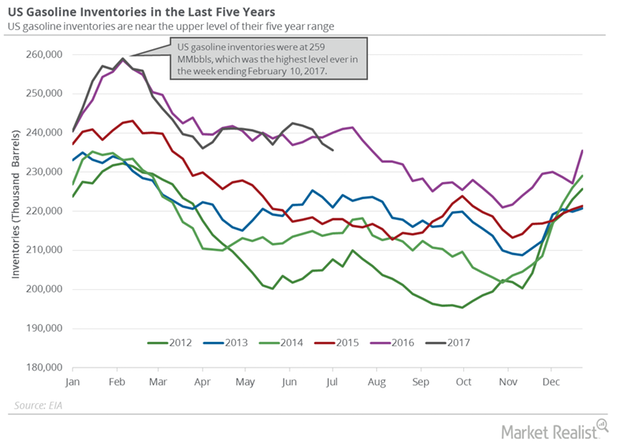
US Gasoline Inventories Support Gasoline, Crude Oil Futures
The EIA reported that US gasoline inventories fell 1.6 MMbbls (million barrels) to 235.6 MMbbls between June 30, 2017, and July 7, 2017.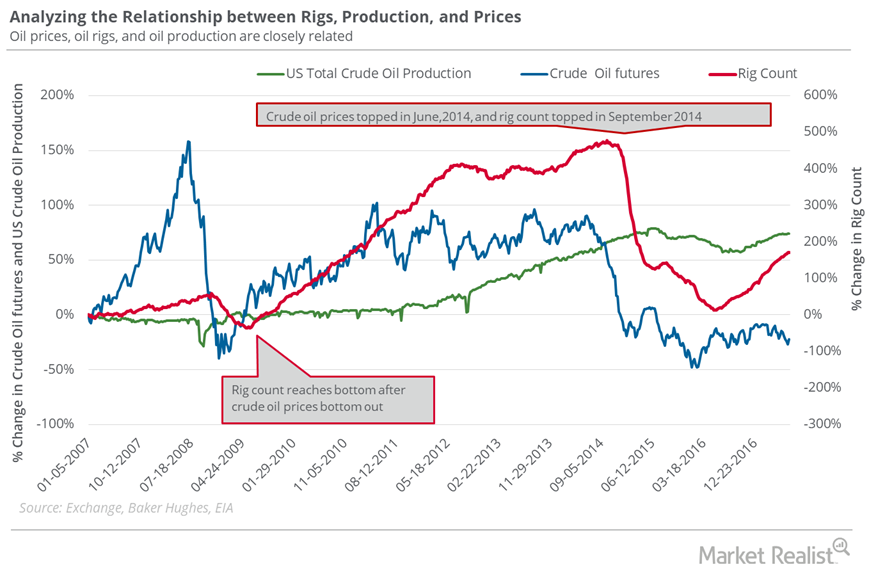
Why Oil Prices Could Plunge
The US oil rig count rose by seven to 763 in the week ended July 7, 2017. This was the rig count’s highest level since April 10, 2015.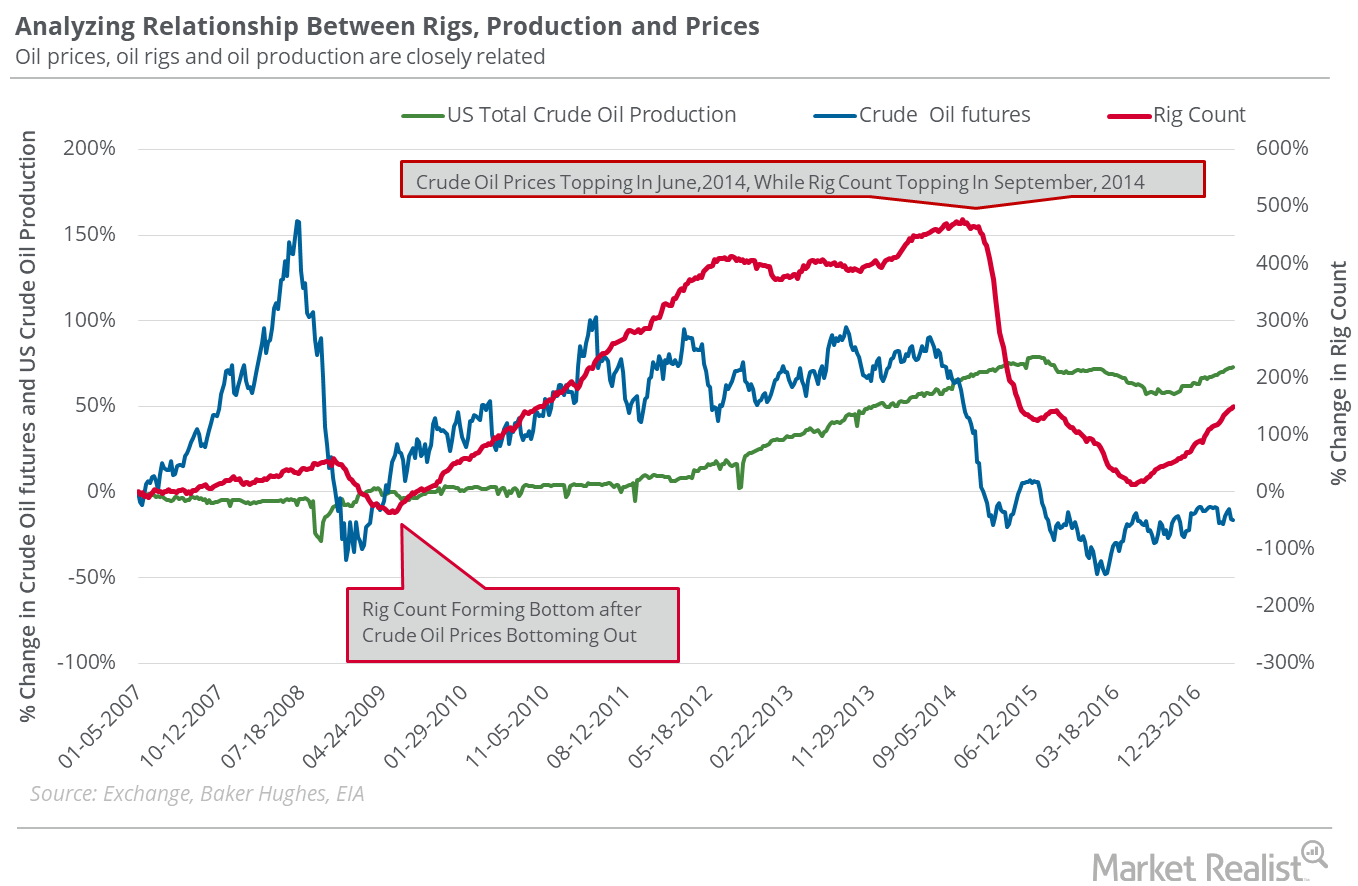
Oil Rigs: Will Oil Prices Rise More?
On June 23–June 30, the US oil rig count fell by two to 756. The fall was marginal, but it was the first fall after rising for 23 consecutive weeks.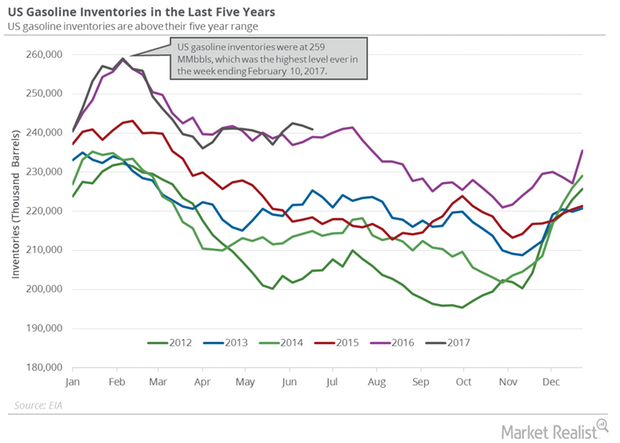
How Long Can US Gasoline Inventories Support Crude Oil Bulls?
The EIA (U.S. Energy Information Administration) reported that US gasoline inventories fell by 0.1 MMbbls to 241 MMbbls on June 16–23, 2017.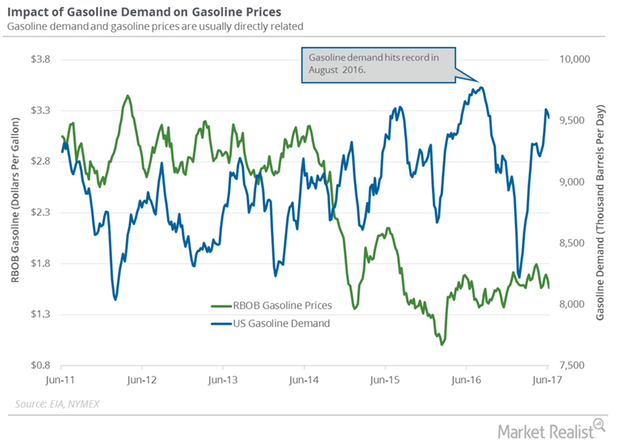
US Gasoline Demand: Positive or Negative for Crude Oil?
The EIA (U.S. Energy Information Administration) estimates that weekly US gasoline demand rose by 547,000 bpd or 6% to 9,816,000 bpd on June 9–16, 2017.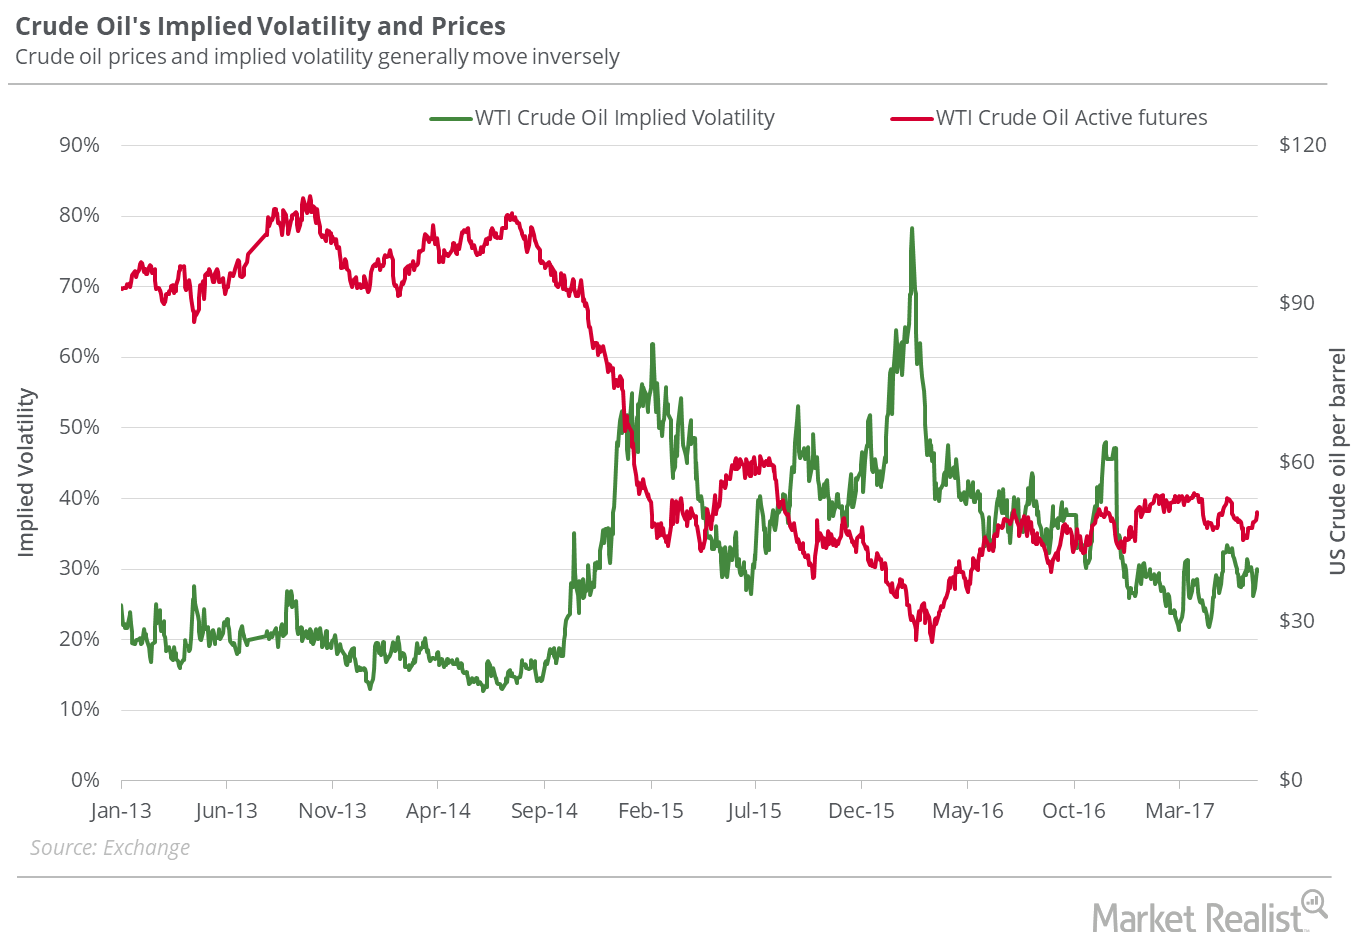
Will US Crude Oil Hit $40 Next Week?
On June 22, 2017, WTI crude oil (USO) (OIIL) active futures’ implied volatility was 29.7%, up 1.7% compared to its 15-day average.
Rising Oil Rigs: Oil Bears’ Friend, Oil Bulls’ Foe
In the week ended June 16, 2017, the US oil rig count was 747, its highest level since the week ended April 17, 2015.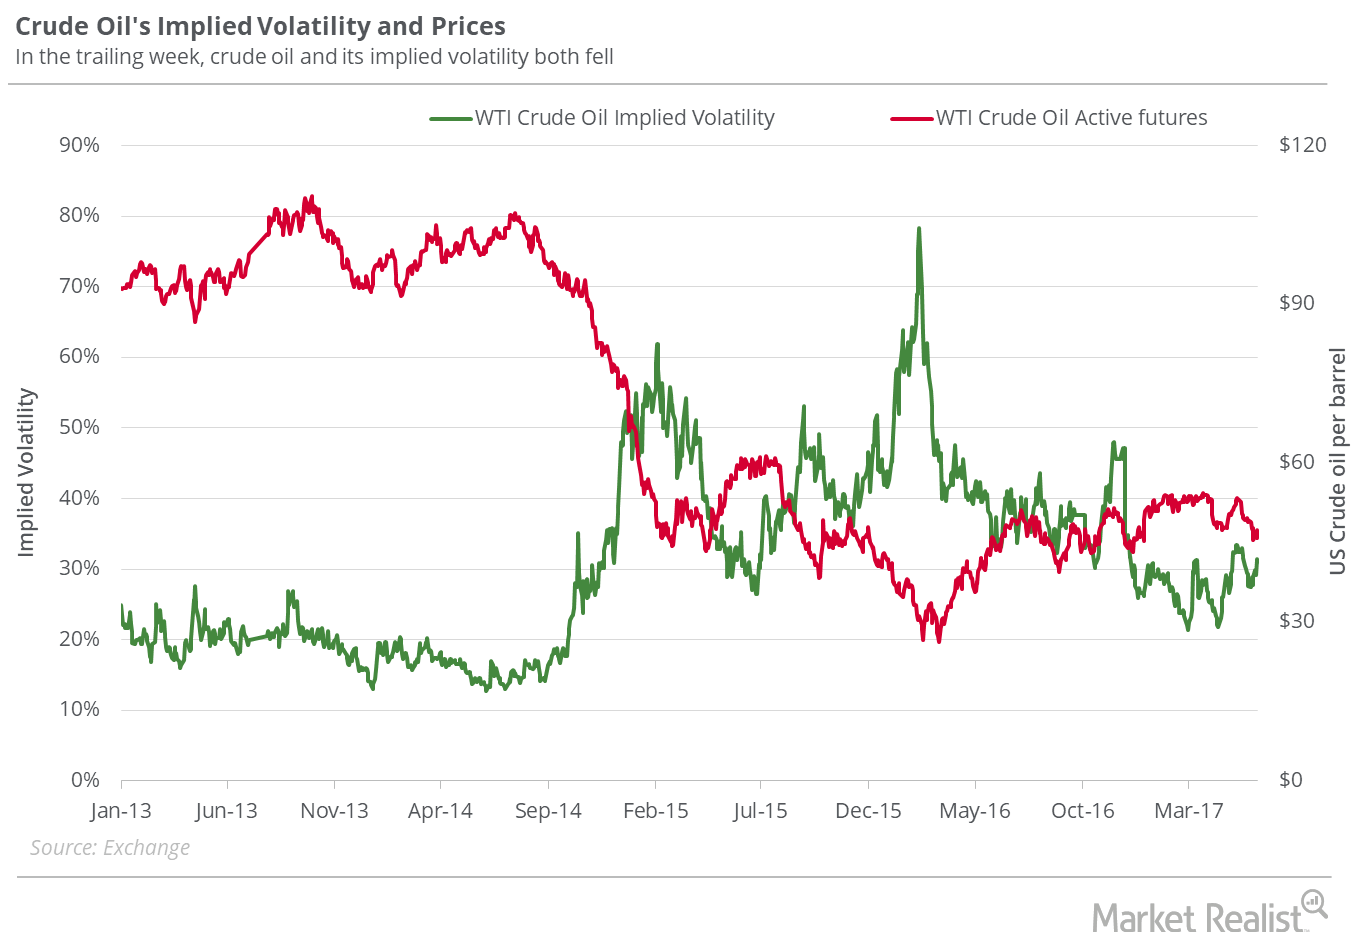
Where Will US Crude Prices Settle?
On June 15, 2017, US crude oil active futures’ implied volatility was 27.9%.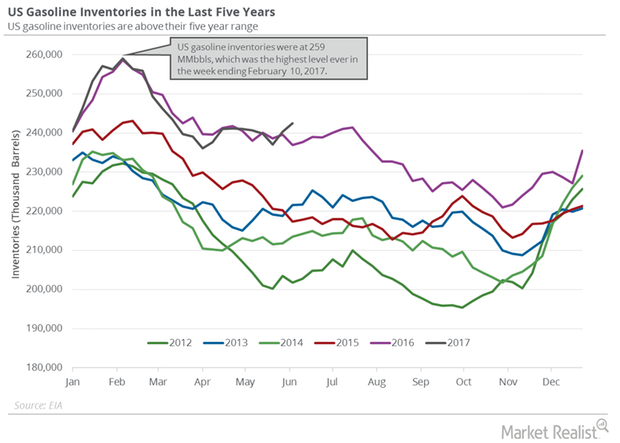
Analyzing US Gasoline Inventories and Gasoline Demand
US gasoline inventories rose by 2.1 MMbbls to 242.3 MMbbls on June 2–9, 2017. Inventories rose 0.9% week-over-week and 2.3% year-over-year.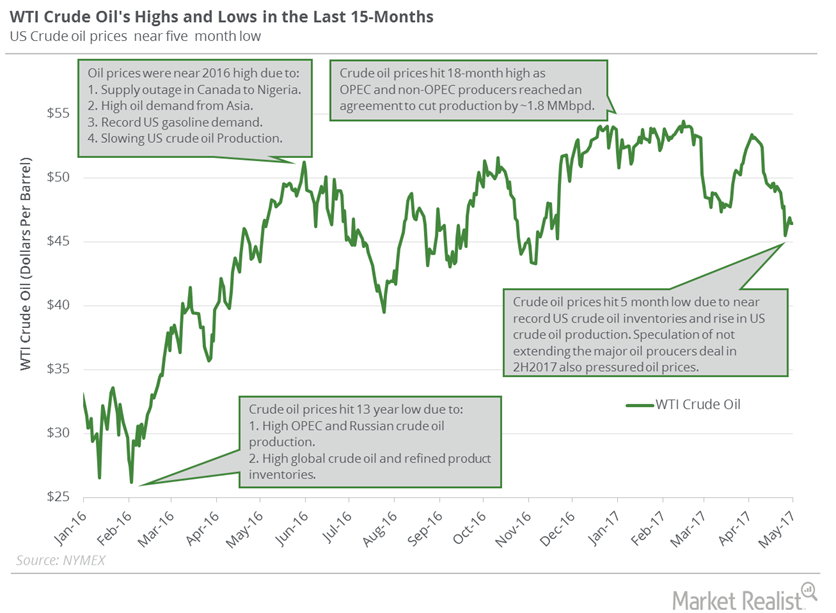
Could Crude Oil Prices Hit Lows from 2016?
WTI (West Texas Intermediate) crude oil (FXN) (SCO) (FENY) futures contracts for June delivery are near a five-month low as of May 9, 2017.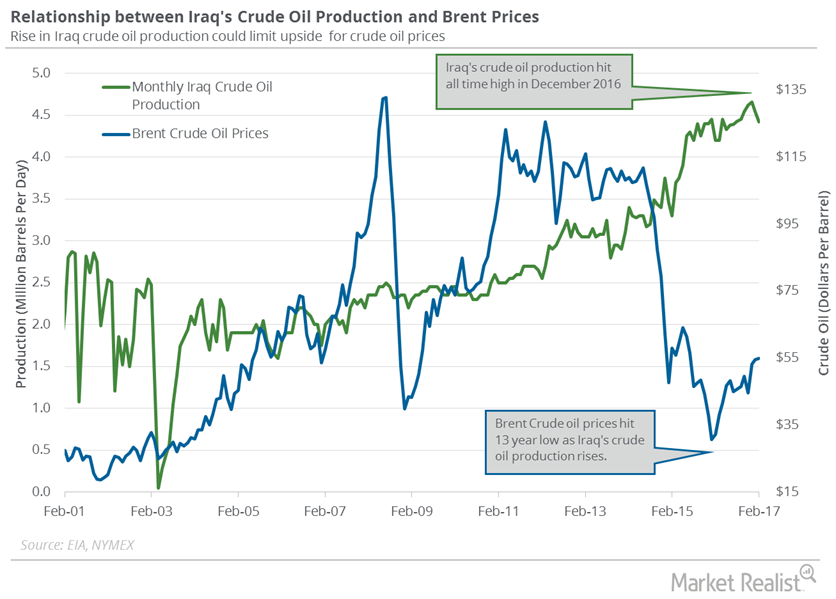
Iraq’s Crude Oil Production: More Pain for Crude Oil Bears
The EIA estimates that Iraq’s crude oil production fell by 115,000 bpd (barrels per day) to 4.42 MMbpd in February 2017—compared to the previous month.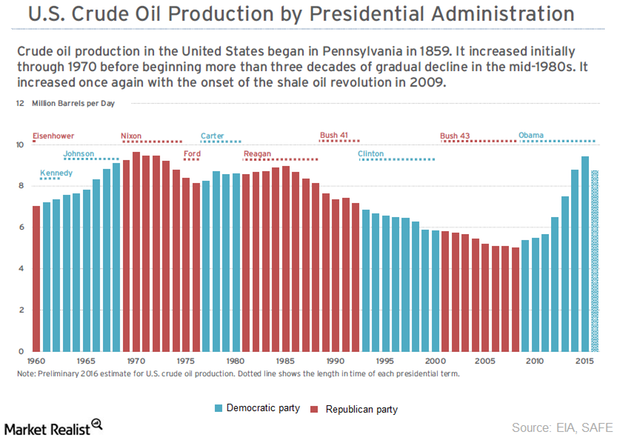
How Political Parties Impact US Crude Oil Production
Under President Obama’s tenure, US crude oil production rose 92% and peaked at 9.6 MMbpd (million barrels per day) in June 2015.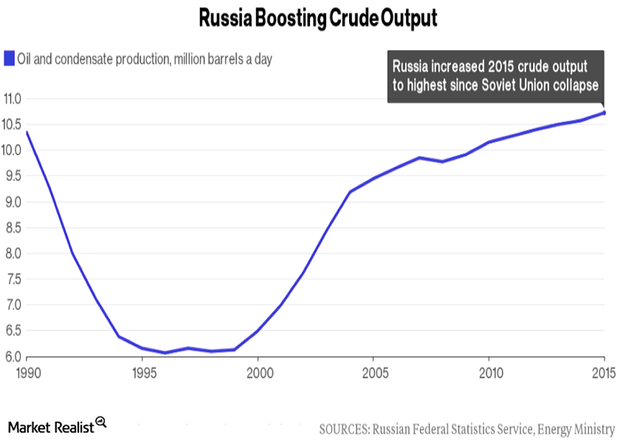
Russia’s Crude Oil Production Will Pressure the Crude Oil Market
Russia’s crude oil production rose to 10.84 MMbpd in June 2016—compared to the previous month—according to sources from the Russian Energy Ministry.