US Gasoline Inventories Could Pressure Crude Oil Prices
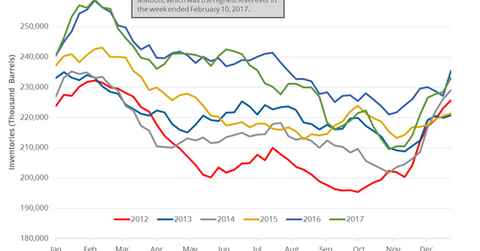
The EIA estimated that US gasoline inventories increased by 4.8 MMbbls (million barrels) or 2.1% to 233.1 MMbbls on December 22–29, 2017.
Jan. 5 2018, Published 8:17 a.m. ET

US gasoline inventories
The EIA estimated that US gasoline inventories increased by 4.8 MMbbls (million barrels) or 2.1% to 233.1 MMbbls on December 22–29, 2017. The inventories also increased by 2.3 MMbbls or 1% from the same period in 2016.
Analysts expected that US gasoline inventories would have increased by 1.8 MMbbls on December 22–29, 2017. US gasoline futures (UGA) rose 0.5% to $1.8 per gallon on January 4, 2018. US crude oil (DWT) (DBO) and gasoline futures moved in the same direction on January 4, 2018.
US crude oil (SCO) prices are at a three-year high. Moves in oil (USL) prices impact oil producers (XOP) (IEZ) like W&T Offshore (WTI), SM Energy (SM), and Carrizo Oil & Gas (CRZO).
Similarly, moves in gasoline prices impact US refining companies (CRAK) like CVR Energy (CVI) and Phillips 66 (PSX).
US gasoline production and demand
According to the EIA, US gasoline production fell by 564,000 bpd (barrels per day) or 5.5% to 9.6 MMbpd (million barrels per day) on December 22–29, 2017. However, production rose by 215,000 bpd or 2.3% from the same period in 2016.
US gasoline demand fell by 835,000 bpd or 8.8% to 8.7 MMbpd on December 22–29, 2017, according to the EIA. However, demand increased by 185,000 bpd or 2.2% from the same period in 2016. The year-over-year increase in gasoline demand has a positive impact on gasoline and oil (DWT) prices.
Impact
US gasoline inventories increased for the eighth straight week. They increased by 23.6 MMbbls or 11% during this period. If the momentum continues in 2018, it could pressure gasoline and crude oil (UWT) prices. It could also be one of the bearish drivers of crude oil prices in 2018.
US gasoline inventories were also 6.7 MMbbls or ~3% above their five-year average for the week ending December 29, 2017. If the difference increases, it’s a bearish sign for gasoline and oil (UCO) prices.
Next, we’ll analyze US distillate inventories.
