Massive Fall in Crude Oil Inventories Pushed Oil Prices Higher
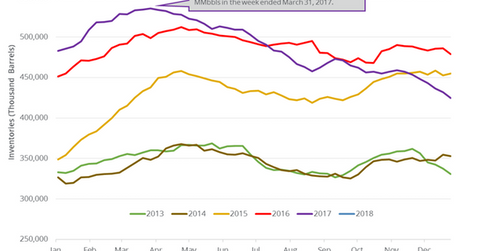
US crude oil inventories fell by 4.9 MMbbls (million barrels) to 419.5 MMbbls between December 29, 2017, and January 5, 2018.
Jan. 11 2018, Updated 10:35 a.m. ET

Crude oil futures  
February WTI crude oil futures (DWT) (UWT) contracts fell 0.11% to $63.5 per barrel at 1:15 AM EST on January 11, 2018. Prices are at the highest level since December 2014. The Guggenheim S&P Equal Weight Energy (RYE) and the Vanguard Energy ETF (VDE) benefit from higher oil (USO) prices. These funds have exposure in US oil and gas companies.
Meanwhile, March E-mini S&P 500 (SPY) futures contracts rose 0.07% to 2,752.5 at 1:15 AM EST on January 11, 2018.
US crude oil inventories  
The EIA released the US crude oil inventories report on January 10, 2018. US crude oil inventories fell by 4.9 MMbbls (million barrels) to 419.5 MMbbls between December 29, 2017, and January 5, 2018, according to the EIA. The inventories fell 1.1% week-over-week and by 63.5 MMbbls or 13.2% year-over-year.
A Reuters poll estimated that US crude oil inventories would have fallen by 3.9 MMbbls between December 29, 2017, and January 5, 2018. A larger-than-expected fall in US oil inventories pushed oil (SCO) prices to more than a three-year high on January 10, 2018. Energy producers (XLE) (IEZ) like Sanchez Energy (SN), Hess (HES), and Callon Petroleum (CPE) benefit from higher oil (USO) prices.
Impact
US crude oil inventories fell ~12% in 2017. US crude oil (DWT) prices rose ~12.4% in 2017. Inventories and oil prices are usually inversely related.
US crude oil inventories fell ~21.7% from their peak. Inventories fell for the eighth straight week. Any fall in inventories is bullish for oil (UCO) prices.
However, US oil inventories are 8% above their five-year average for the week ending January 5, 2018. It’s bearish for oil (UWT) prices. If the difference drops, it’s a bullish sign for oil (USL) prices.
Next, we’ll discuss the most important threat to crude oil prices in 2018.
