How US Natural Gas Production and Consumption Are Driving Prices
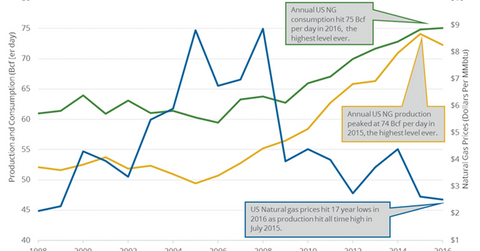
Market data provider PointLogic estimates that weekly US dry natural gas production fell by 0.2 Bcf (billion cubic feet) per day to 74.3 Bcf per day from September 21 to 27, 2017.
Sept. 29 2017, Updated 4:06 p.m. ET

Weekly US natural gas production
Market data provider PointLogic estimates that weekly US dry natural gas production fell by 0.2 Bcf (billion cubic feet) per day to 74.3 Bcf per day from September 21 to 27, 2017. However, production rose by 4.4 Bcf per day or 6.3% year-over-year.
The year-over-year rise in natural gas production is bearish for natural gas (DGAZ)(UNG)(BOIL) prices. Lower natural gas prices have a negative impact on natural gas producers’ (RYE)(VDE) profitability, including Rice Energy (RICE), Cabot Oil & Gas (COG), and Newfield Exploration (NFX).
Weekly US natural gas consumption
PointLogic estimates that weekly US natural gas consumption rose 5.8% to 61.4 Bcf per day from September 21 to 27. Consumption rose 9% year-over-year. A rise in natural gas consumption could have a positive impact on natural gas (UGAZ)(GASL)(FCG) prices.
Impact
US natural gas production could surpass consumption in 2017 and 2018 per EIA’s estimates, which could weigh on natural gas prices. However, booming US natural gas exports could limit the impact of excess supply.
In the next part of this series, we’ll take a look at some natural gas price forecasts.
