Rice Energy Inc
Latest Rice Energy Inc News and Updates
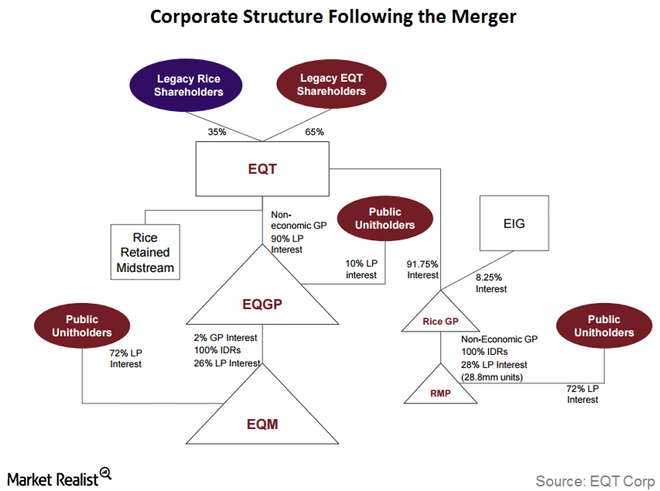
Key Updates on the EQT-RICE Merger
Under EQT Corporation’s (EQT) existing ownership, the company owns a 90% limited partner interest and non-economic general partner interest in EQT GP Holdings (EQGP).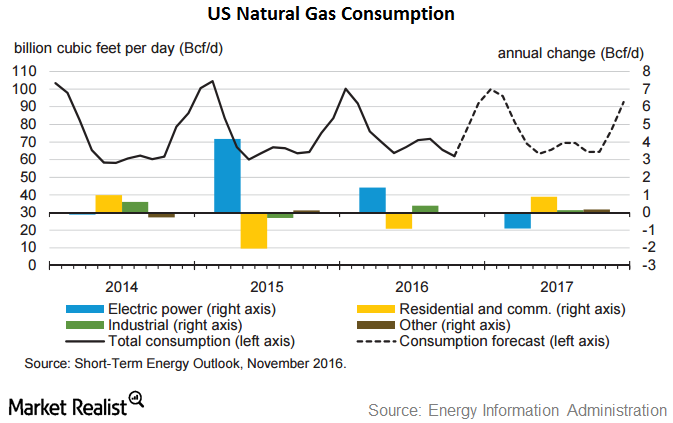
How Natural Gas Prices Have Supported Chesapeake Energy
2016 has been good for natural gas prices (UGAZ). Prices have risen ~34% year-over-year.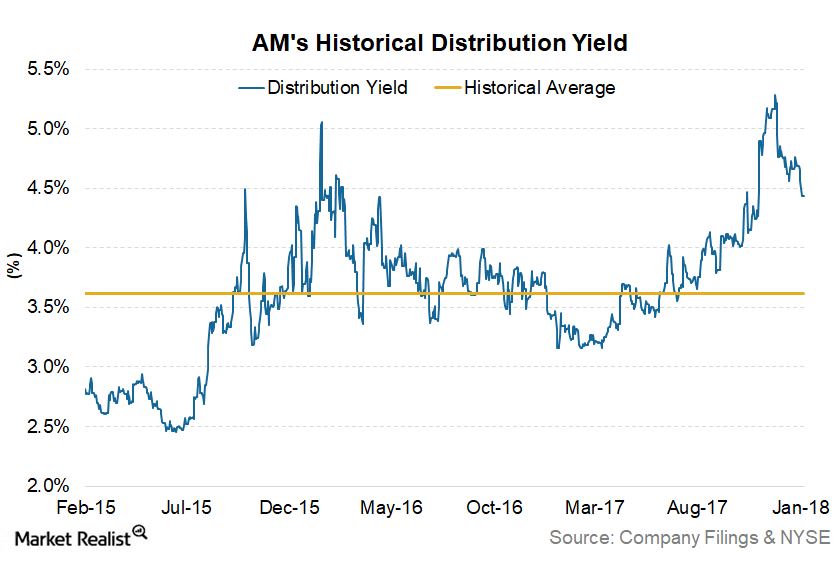
Could Antero Midstream Partners Benefit from Strong Earnings?
Antero Midstream Partners fell 6% last year. However, it had a strong start to the new year. It has risen 6.8% in 2018.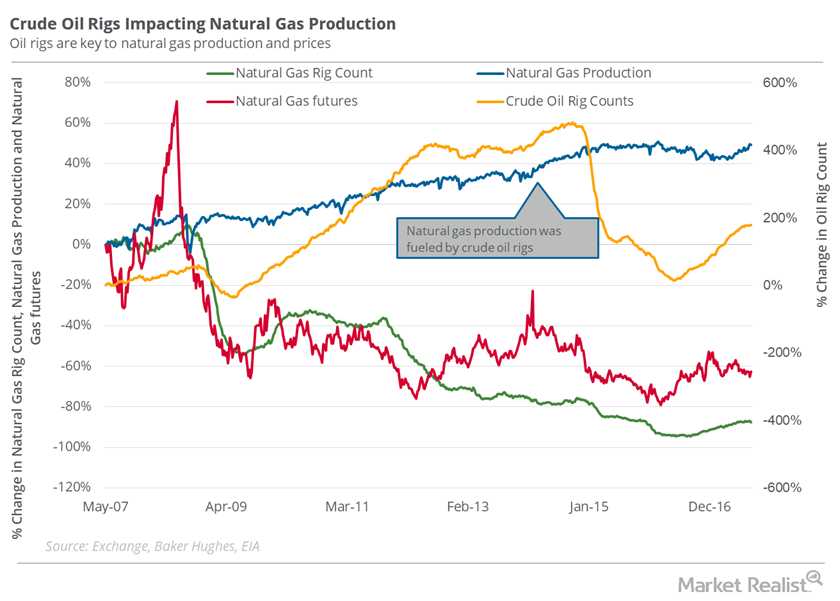
Could Oil Rig Count Stop Natural Gas Fall?
In the week ended October 6, 2017, the natural gas rig count fell by two to 187.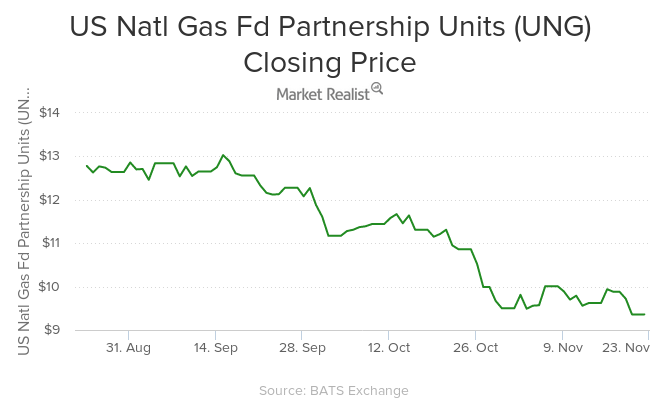
Natural Gas Prices Slump 9.4% for the Week
ETFs like the United States Natural Gas—UNG—ETF fell in the direction of natural gas prices on November 20, 2015. UNG fell by 4.7% on the day.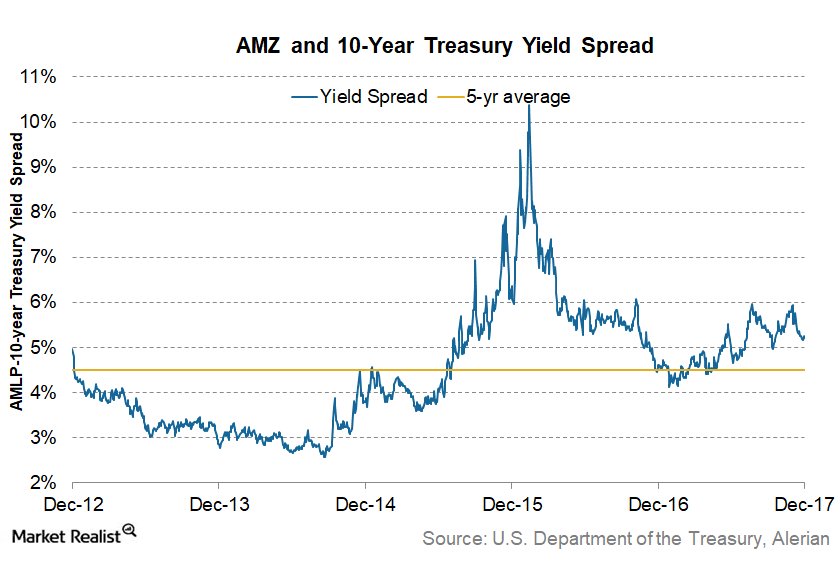
How Do These MLPs Look in 2018?
MLPs had a strong start to the new year. The Alerian MLP Index rose 5% in the first week of 2018.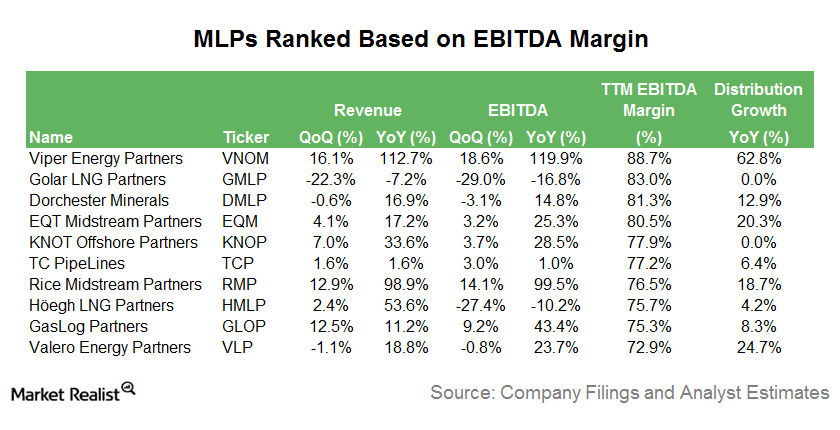
These MLPs Have the Highest Earnings Margins Today
In this series, we’ll assess the performances of the MLPs with the highest EBITDA (earnings before interest, tax, depreciation, and amortization) margins.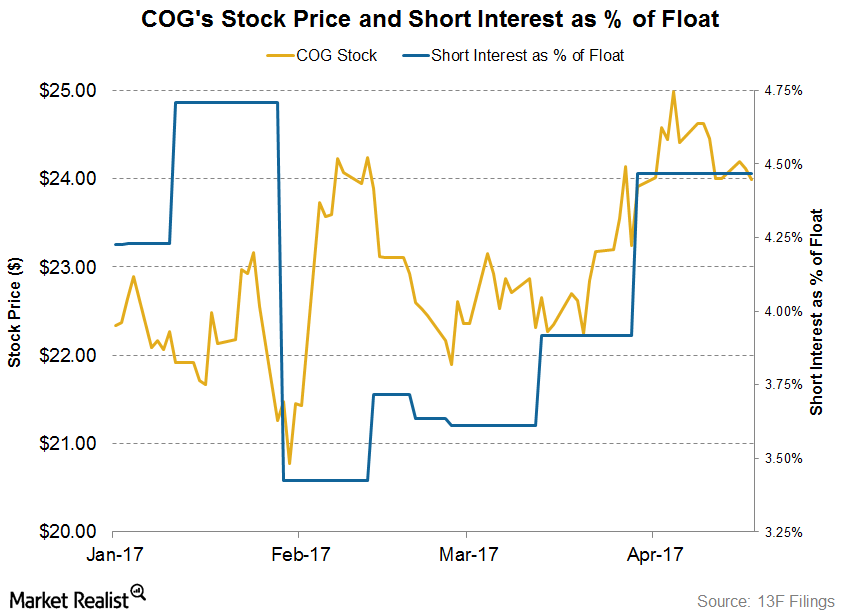
Short Interest Trends in Cabot Oil & Gas Stock
On April 19, Cabot Oil and Gas’s short interest as a percentage of its float was ~4.5%. At the beginning of the year, its short interest ratio was 4.2%.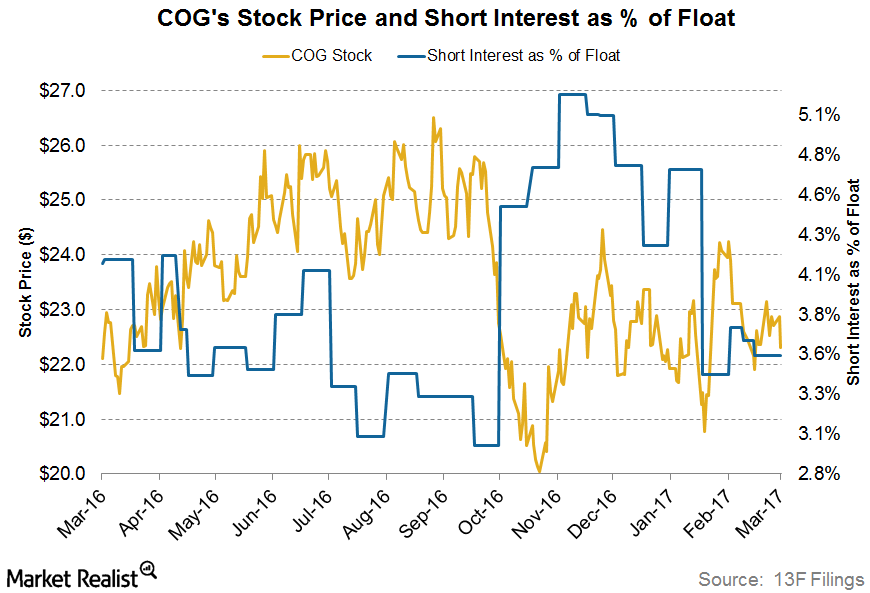
How Short Interest in COG Stock Has Been Trending
On March 14, 2017, Cabot Oil and Gas’s (COG) short interest as a percentage of its float (or its short interest ratio) was ~3.5%.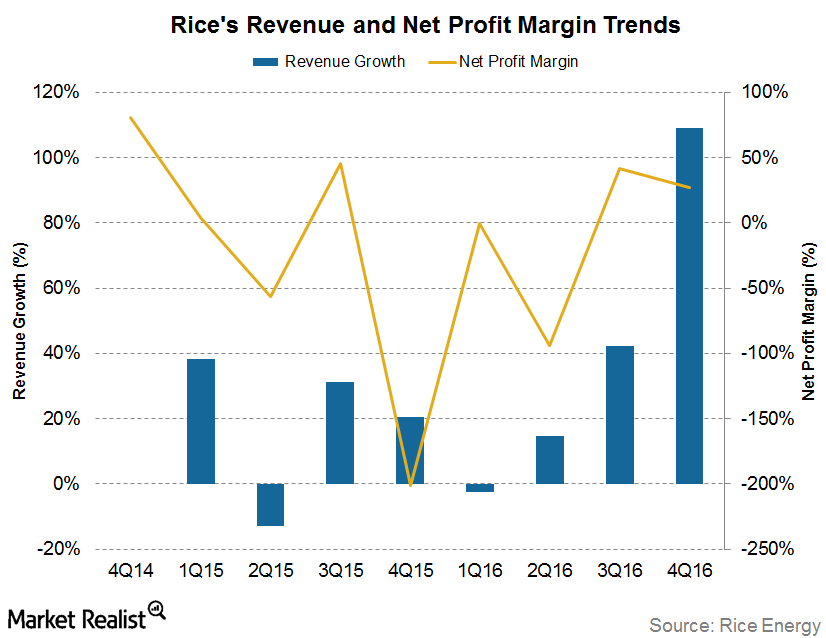
Rice Energy’s Revenue Growth and Net Profit Margin Trends
Rice Energy’s (RICE) 4Q16 revenue rose ~109.0% YoY (year-over-year).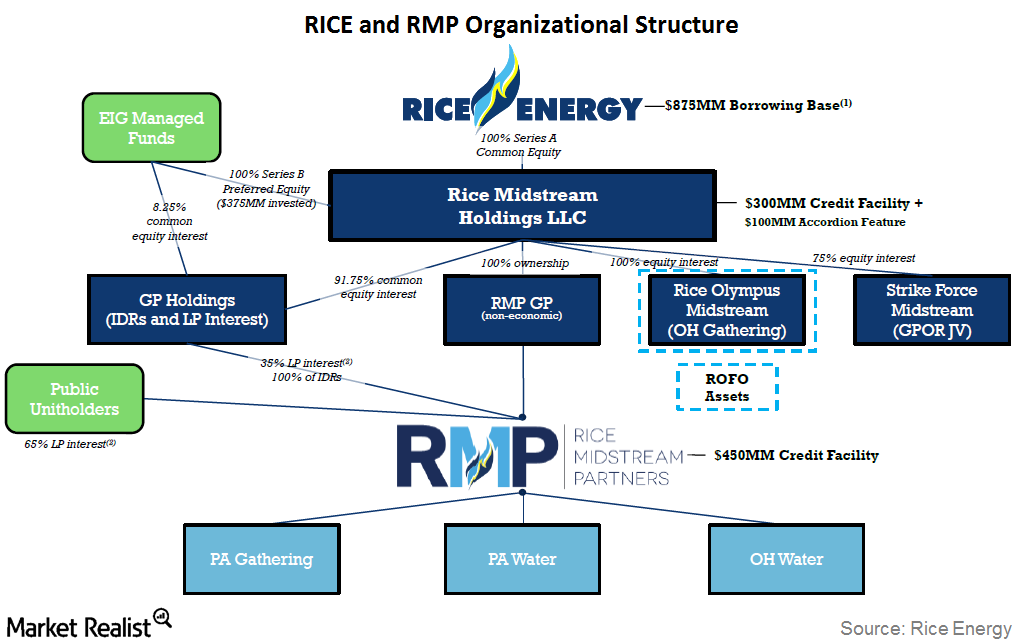
Rice Energy’s Organizational Structure: A Brief Overview
In its organizational structure, Rice Energy, through its GP Holdings subsidiary, and the public hold 35% and 65% limited partner interest, respectively, in Rice Midstream Partners.