Why Oil Rigs Could Overshadow Natural Gas’s Gains
On March 31, 2017, the natural gas (BOIL) (GASX) (FCG) (GASL) rig count was 160, a rise of five rigs over the previous week.
Nov. 20 2020, Updated 11:33 a.m. ET

Natural gas rigs
On March 31, 2017, the natural gas (BOIL) (GASX) (FCG) (GASL) rig count was 160, a rise of five rigs over the previous week. The number of active natural gas rigs has risen by 72 in the trailing year. On April 7, 2017, Baker Hughes (BHI) will release its natural gas rig count for the week ending April 7, 2017.
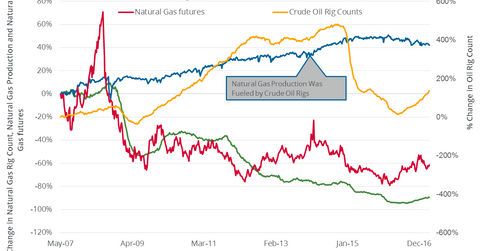
However, the natural gas rig count for the week ending March 31, 2017, was 90% lower than its peak in 2008. The rig count reached a historic high of 1,606 in 2008. Despite the sharp fall in natural-gas-targeted rigs since August 2008, natural gas production continued to rise.
Crude oil rigs and natural gas production
The oil rig count, not just the natural gas rig count, is another important factor to watch to understand what’s driving natural gas prices. It can be a major bearish catalyst for natural gas. Over the past ten years, natural gas production has moved more in tandem with the crude oil rig count than with the natural gas rig count, as you can see in the above chart.
Apart from natural gas wells, natural gas is often an associated product of crude oil (USO) (OIIL) (DBO) (USL) extraction. Rising crude oil prices after the 2008 financial crisis kept the number of oil rigs rising until June 2014. With increasing crude oil extraction, associated natural gas production also kept rising despite falling prices.
Since the bottom at 316 rigs in the week ending May 27, 2016, the count more than doubled. The crude oil rig count has risen 346 rigs as of March 31, 2017. On March 31, the US crude oil rig count was 662, ten more than during the previous week.
Relatively strong WTI crude oil prices due to OPEC’s (Organization of the Petroleum Exporting Countries) supply cuts until June 2017 could lead to higher US oil supplies. It could cause a rise in associated natural gas production as well, which would be bearish for the commodity.
What’s the effect on stocks and ETFs?
In the short term, any fall in natural gas prices could have a limited impact on natural-gas-weighted stocks, the energy sector, and broader market indexes such as the S&P 500 Index (SPY) (SPX-INDEX) and the Dow Jones Industrial Average (DIA) (DJIA-INDEX). In the long term, the impact could be more material.
If the number of oil and gas rigs keeps rising, it could boost natural gas production and pressure prices. Given the impact on production and energy prices, rig counts impact ETFs such as the ProShares Ultra Oil & Gas (DIG), the PowerShares DWA Energy Momentum ETF (PXI), the Vanguard Energy ETF (VDE), the Energy Select Sector SPDR ETF (XLE), the iShares US Energy (IYE), and the Fidelity MSCI Energy ETF (FENY).
Rig efficiency
Increasing rig efficiency also helps US natural gas companies produce more natural gas with fewer rigs. The EIA estimates that new well gas production per rig will be 3,516 thousand cubic feet per day in April 2017, about 30.7% more than in April 2016. So, rising rigs could increase US natural gas supplies more today than the same number of rigs would have in the past, which is also a bearish driver for natural gas prices.
In the next part of this series, we’ll take a look at natural gas inventories.
