SPGSCLTR/BARC 36
Latest SPGSCLTR/BARC 36 News and Updates

Why Did Oil Prices Move Higher?
On February 22, 2018, US crude oil’s April 2018 futures rose 1.8% and closed at $62.77 per barrel.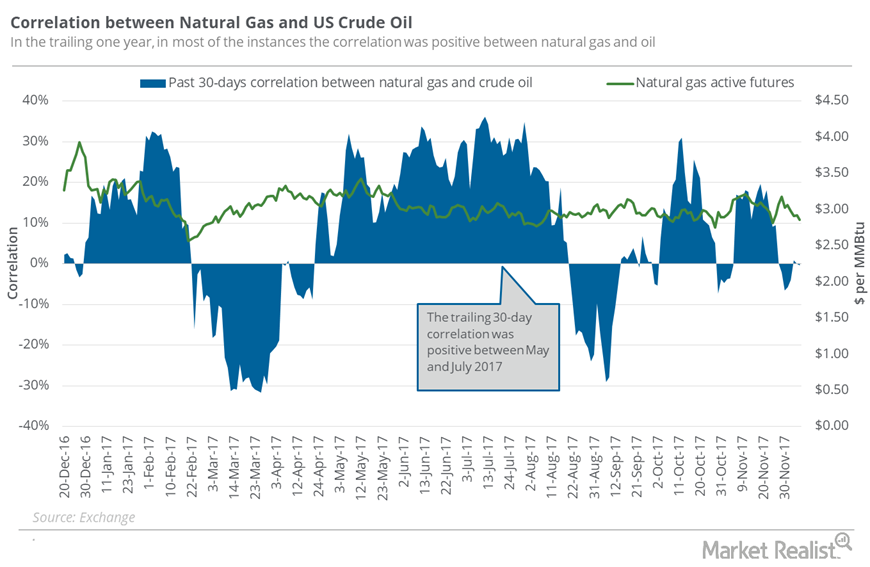
Does the Natural Gas Fall Relate to Oil’s Decline?
Between November 29 and December 6, natural gas (GASL)(GASX)(FCG) January 2018 futures had a correlation of -1.6% with US crude oil January futures.
Why Did Oil Prices Fall?
On March 22, natural gas April 2018 futures declined 0.8% and settled at $2.62 per million British thermal units.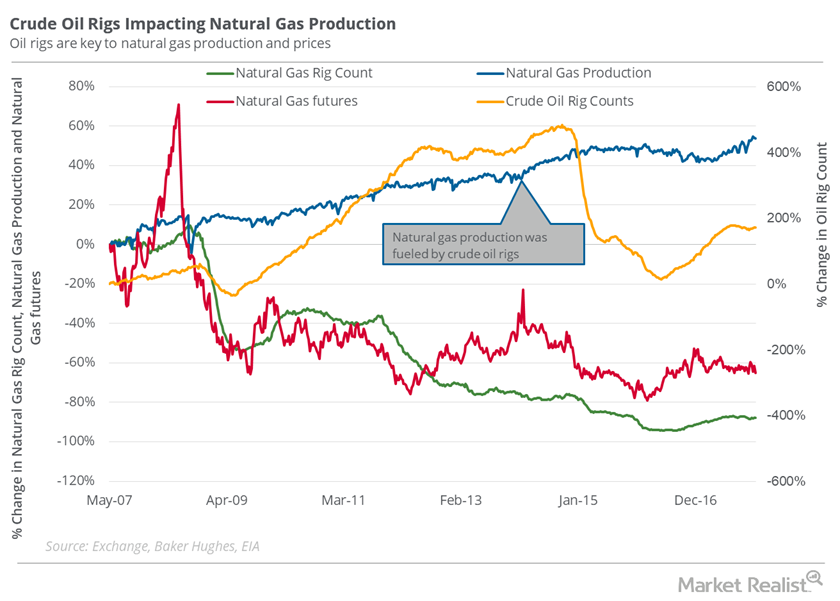
Natural Gas Traders Should Stay Cautious of Oil Rigs
On December 29, the natural gas rig count was 88.7% below its record high of 1,606 in 2008. However, natural gas supplies have risen drastically since 2008.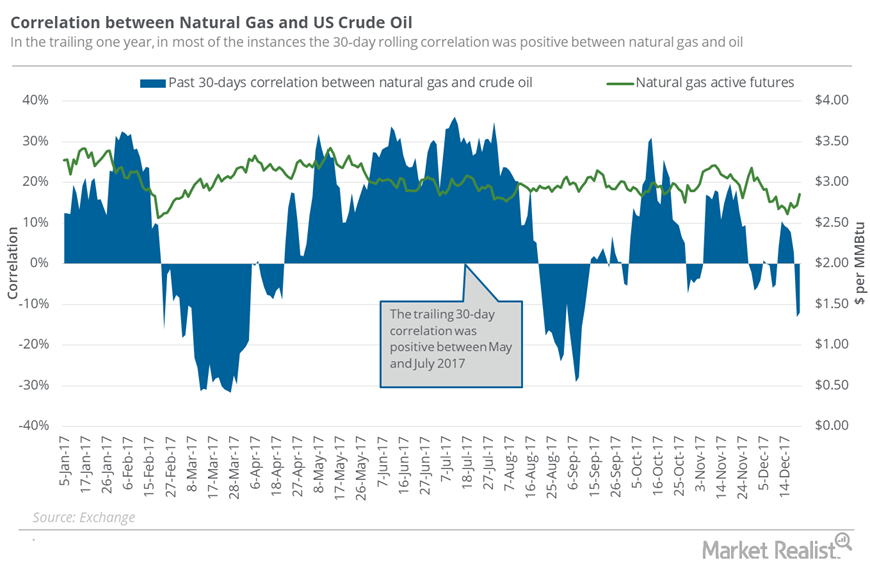
Is Natural Gas Moving with Oil Prices?
The correlation between natural gas (GASL)(GASX)(FCG) active futures with US crude oil active futures was 99.8% between December 12 and December 19.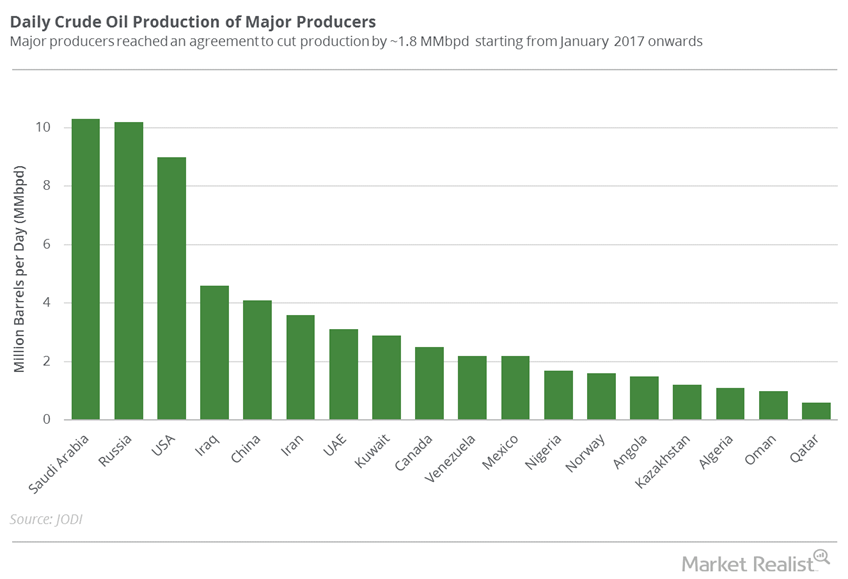
Chart of the Week: Crude Oil Production of Global Majors
Crude oil (OIIL) (DBO) (USL) prices fell on June 5, 2017, due to geopolitical tensions.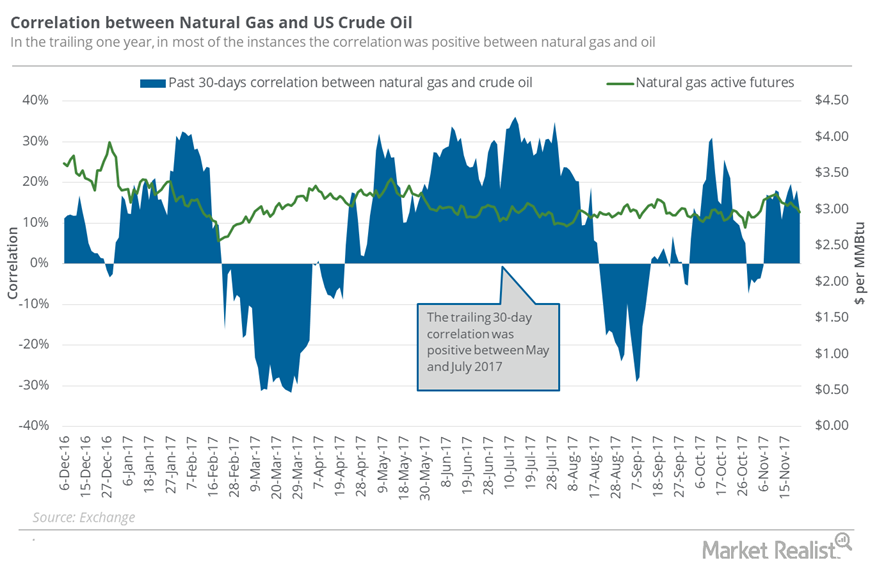
How Closely Is Natural Gas Tracking Oil?
Between November 15 and 22, natural gas (UNG)(FCG) January futures had a correlation of 52.5% with US crude oil January futures.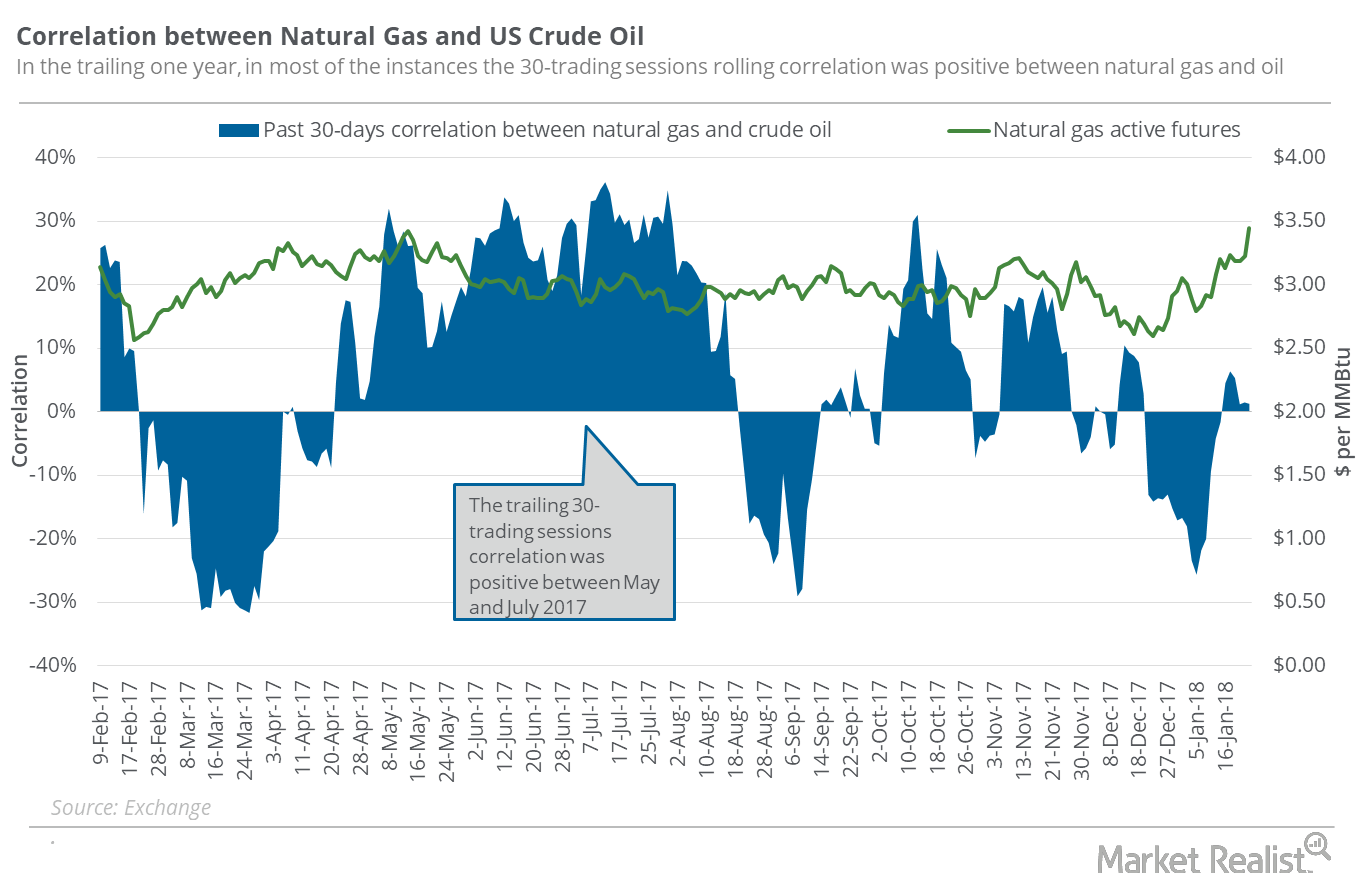
Does Natural Gas’s Rise Depend on Crude Oil?
Between January 16 and January 23, 2018, natural gas (GASL) (UNG) (FCG) had a correlation of 84.6% with US crude oil (OIIL) (USL) (DBO) active futures.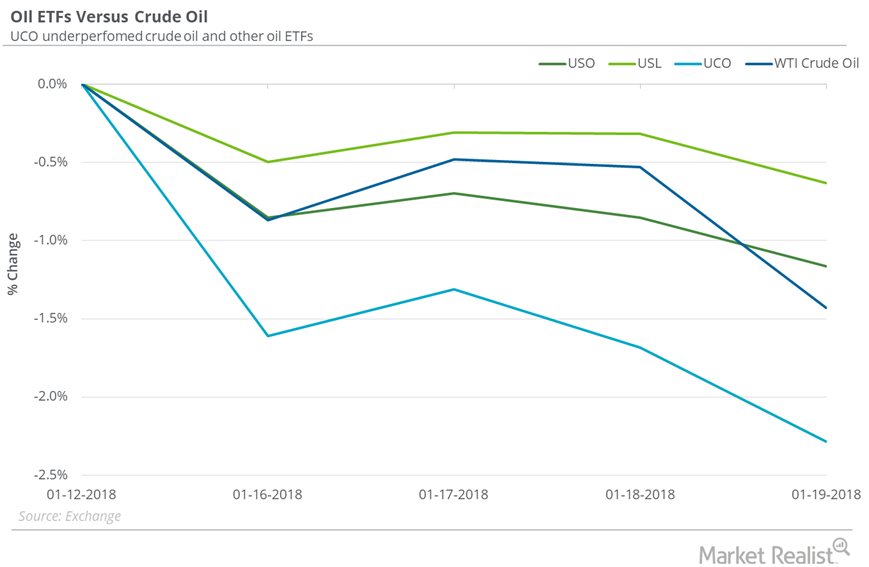
Are Oil ETFs Outperforming Oil?
Between January 12 and January 19, 2018, the United States Oil ETF (USO) fell 1.2%.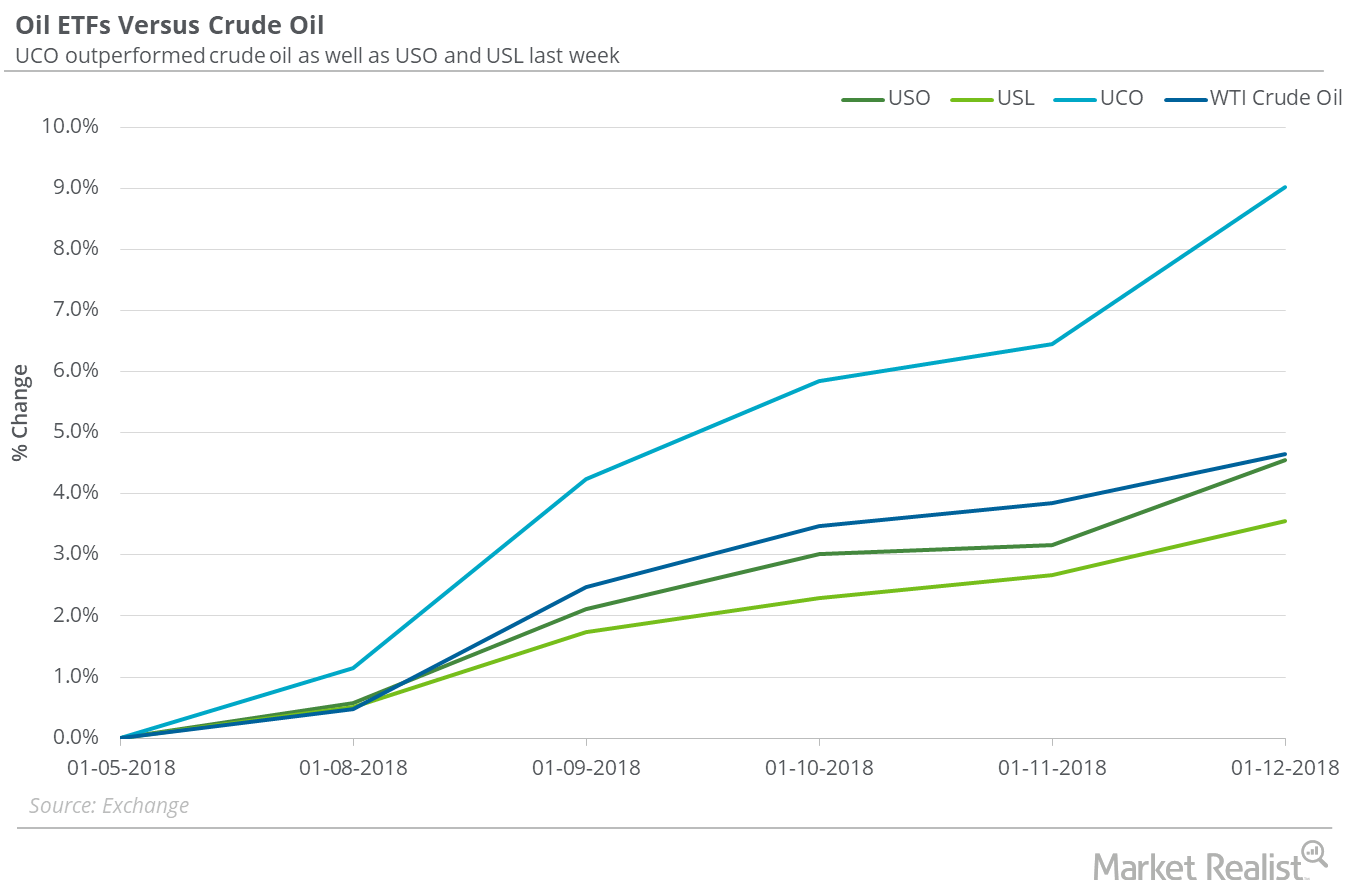
Oil ETFs: How They’re Performing at Oil’s 3-Year High
Between January 5 and January 12, 2018, the United States Oil ETF (USO), which holds positions in US crude oil active futures, gained 4.5%.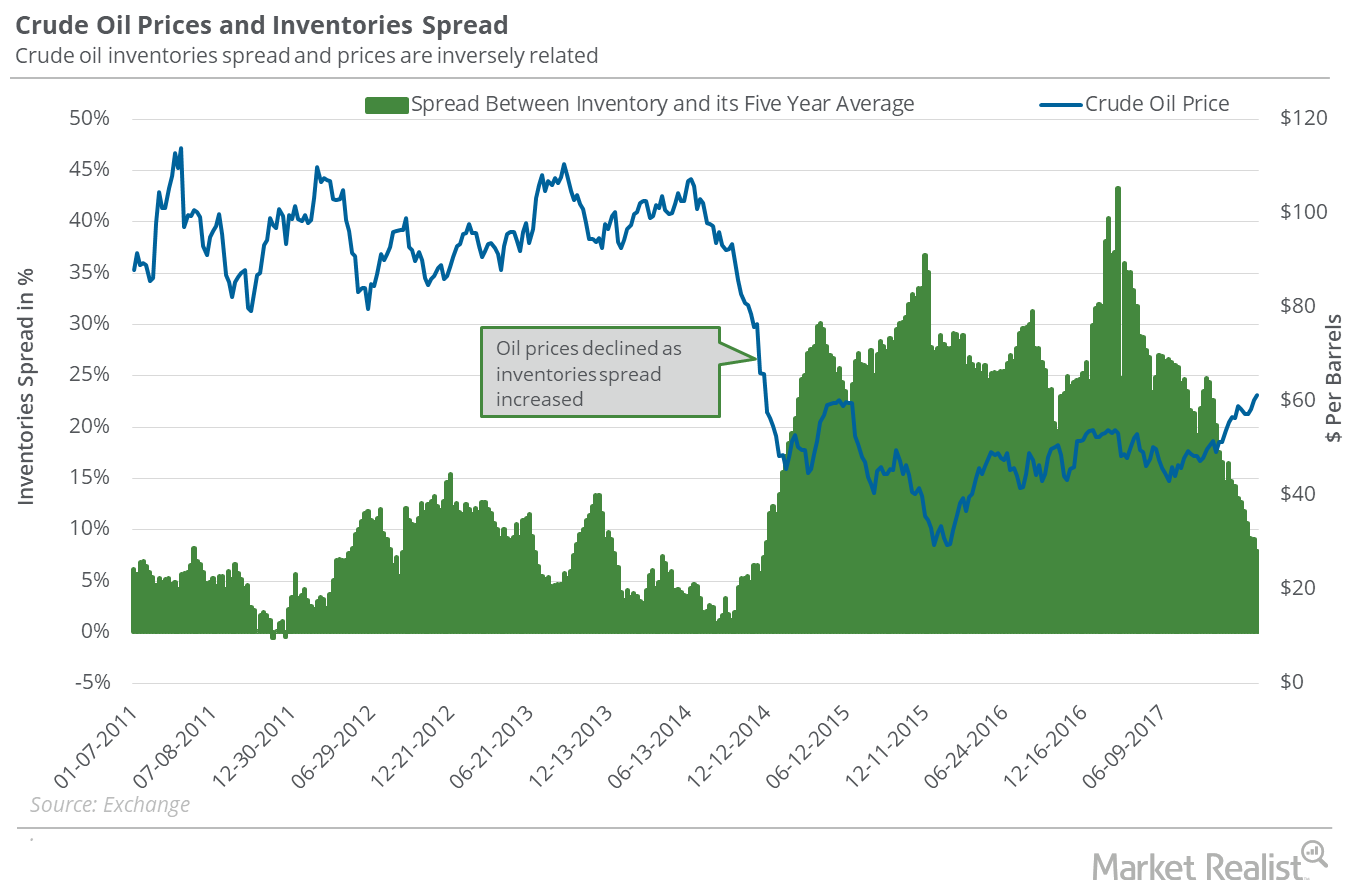
Oil Inventory Data Could Push Oil Higher
In the week ending January 5, 2018, US crude oil inventories fell by 4.9 MMbbls (million barrels)—1 MMbbls more than the market’s expected fall.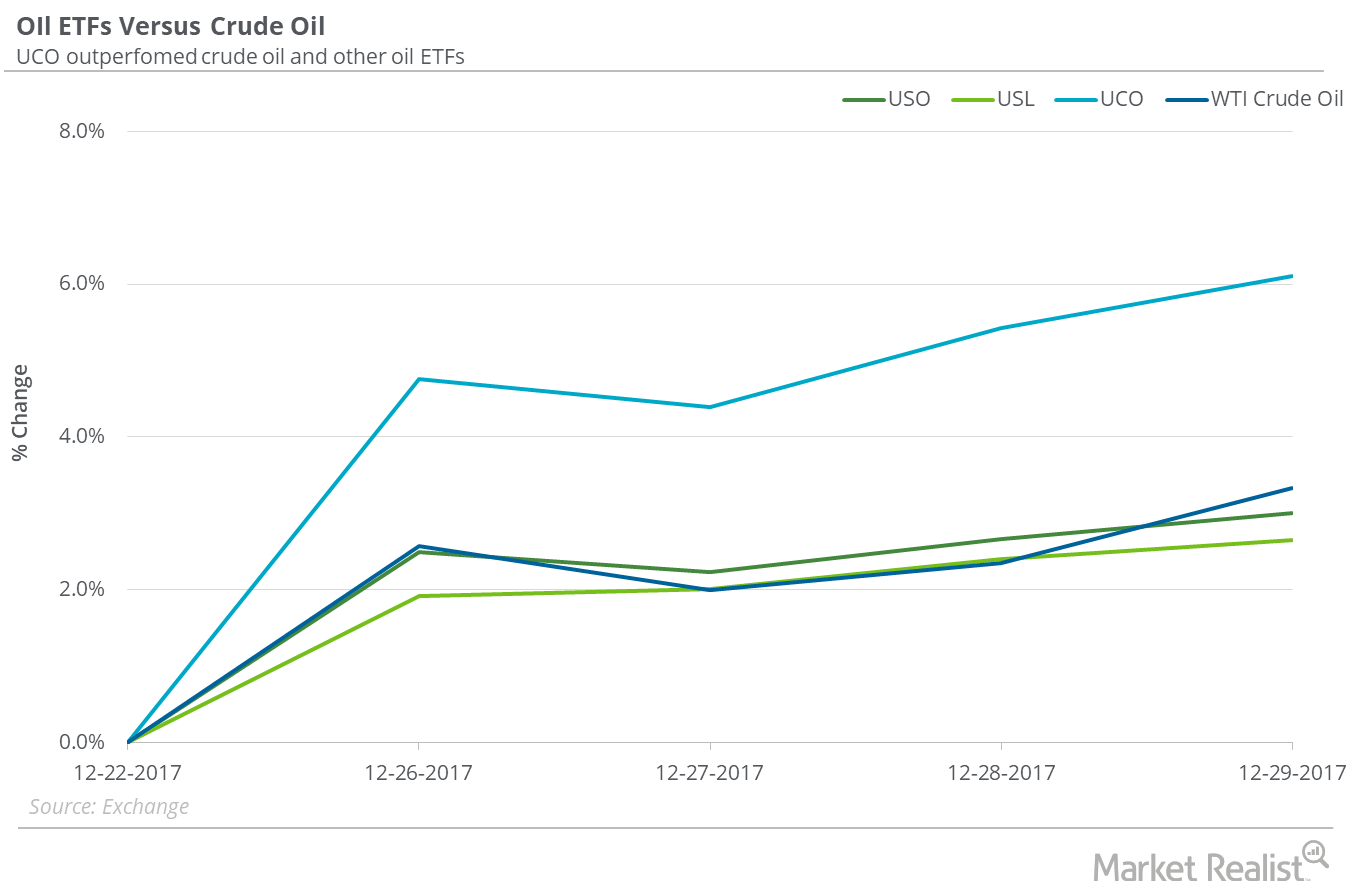
Which Oil ETFs Might Be a Better Bet in 2018?
On December 29, 2017, the closing prices of US crude oil futures contracts between March 2018 and January 2019 were progressively lower.
How Much Fall in Inventories Could Support Oil This Week?
In the week ended December 22, 2017, US crude oil inventories were 431.9 MMbbls (million barrels), a fall of 4.6 MMbbls compared to the previous week.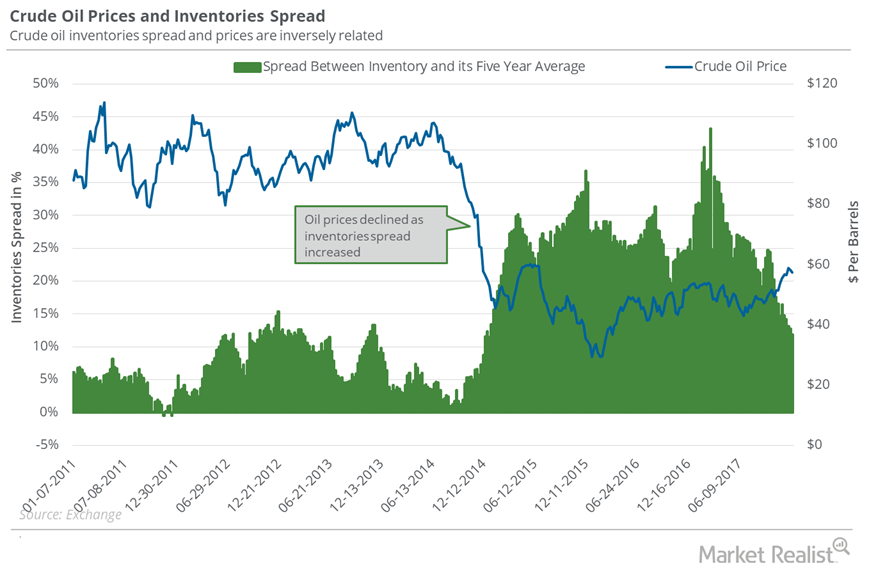
What Oil Bulls Could Expect for Oil Inventories
Oil stockpiles In the week ended December 8, 2017, US crude oil inventories fell by 5.1 MMbbls (million barrels) to 443 MMbbls. However, motor gasoline inventories rose 5.7 MMbbls. The data was released by the EIA (U.S. Energy Information Administration) on December 13. That day, US crude oil prices fell 0.9%. Inventory spread The gap between US oil inventories […]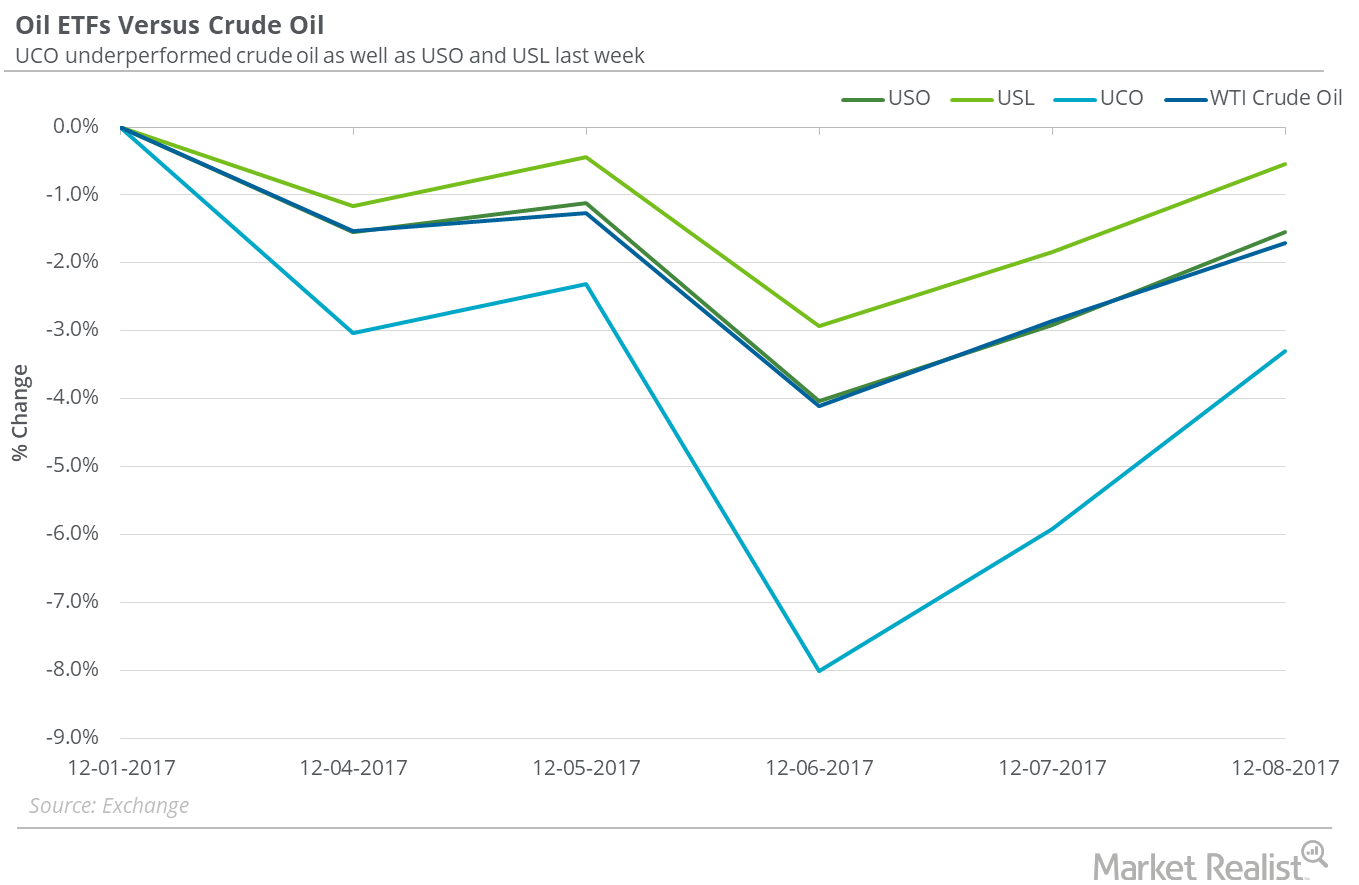
Oil ETFs That Outperformed US Crude Oil Last Week
On December 1–8, 2017, the United States Oil Fund (USO), which holds crude US oil futures contracts, fell 1.5%. US crude oil January 2018 futures fell 1.7%.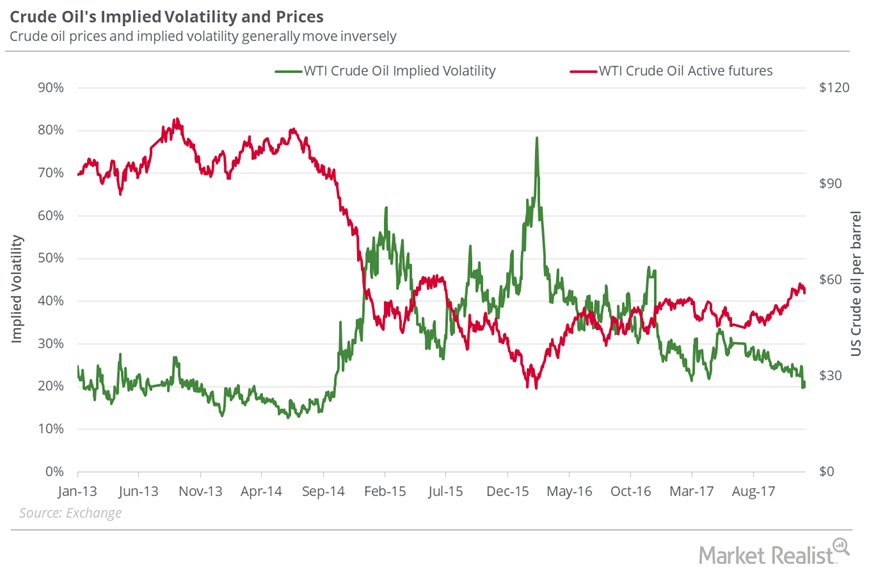
US Crude Oil Prices Could Remain below $58 Next Week
On December 7, 2017, US crude oil’s implied volatility was 20% or ~1.1% less than its 15-day average. On December 1, the implied volatility fell to 19.8%.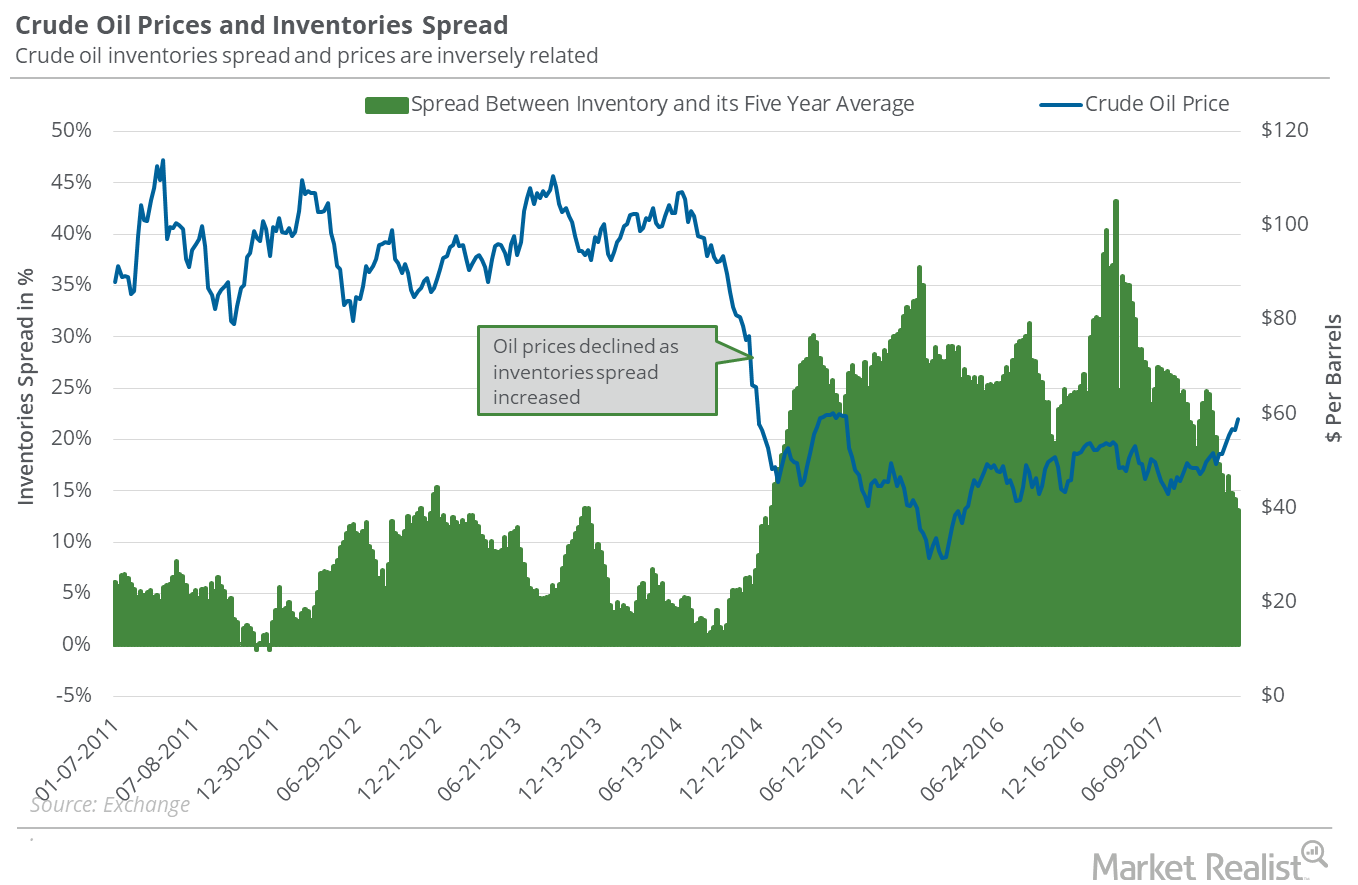
Analyzing Crude Oil Inventories and Oil Prices
In the week ending November 24, 2017, US crude oil inventories fell by 3.4 MMbbls (million barrels) to 453.7 MMbbls.
Will the Inventories Spread Impact US Crude Oil?
US commercial crude oil inventories fell by 1.9 MMbbls in the week ending November 17, 2017—0.5 MMbbls more than the market’s expected fall.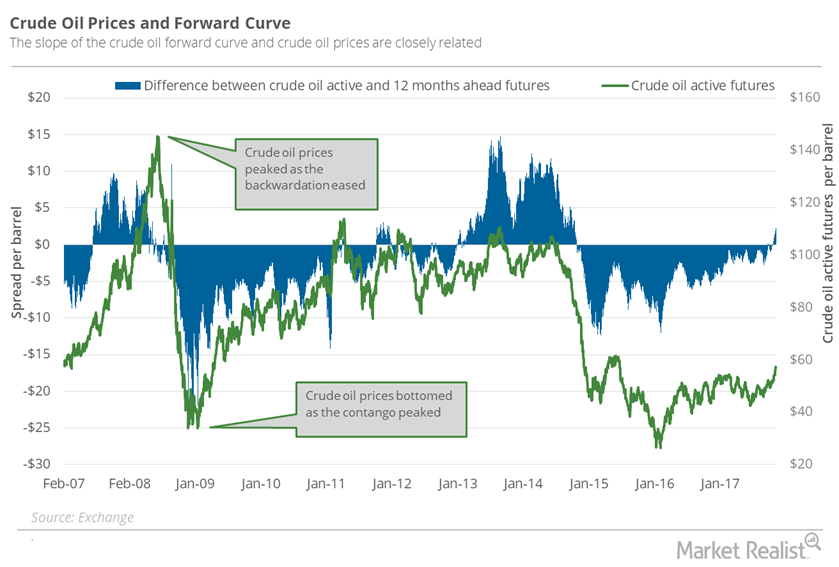
Futures Spread: Is the Oil Market Tightening?
On November 7, 2017, US crude oil (OIIL) December 2018 futures settled $2.08 below the December 2017 futures.
Could the Oil Rig Count Threaten Bullish Bets on Oil Prices?
The US oil rig count rose by three to 768 for the week ended August 11, 2017.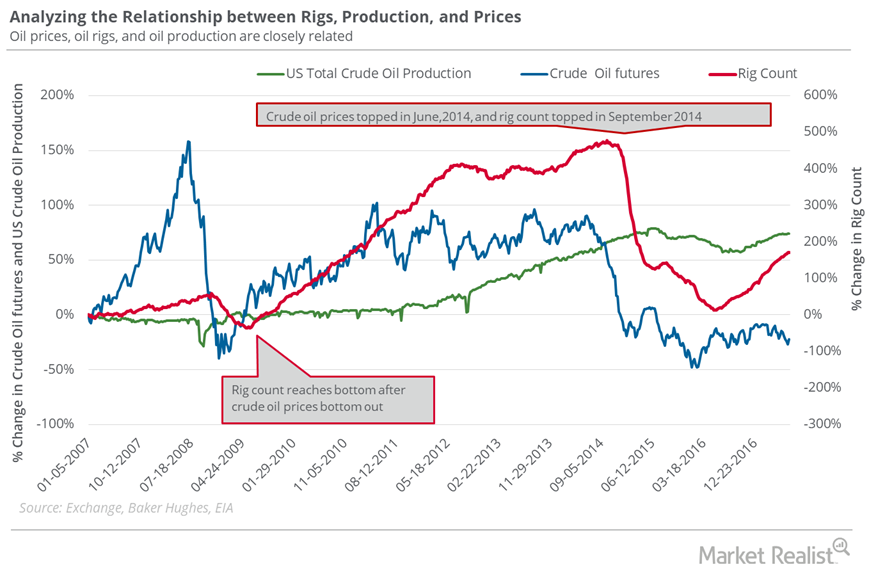
Why Oil Prices Could Plunge
The US oil rig count rose by seven to 763 in the week ended July 7, 2017. This was the rig count’s highest level since April 10, 2015.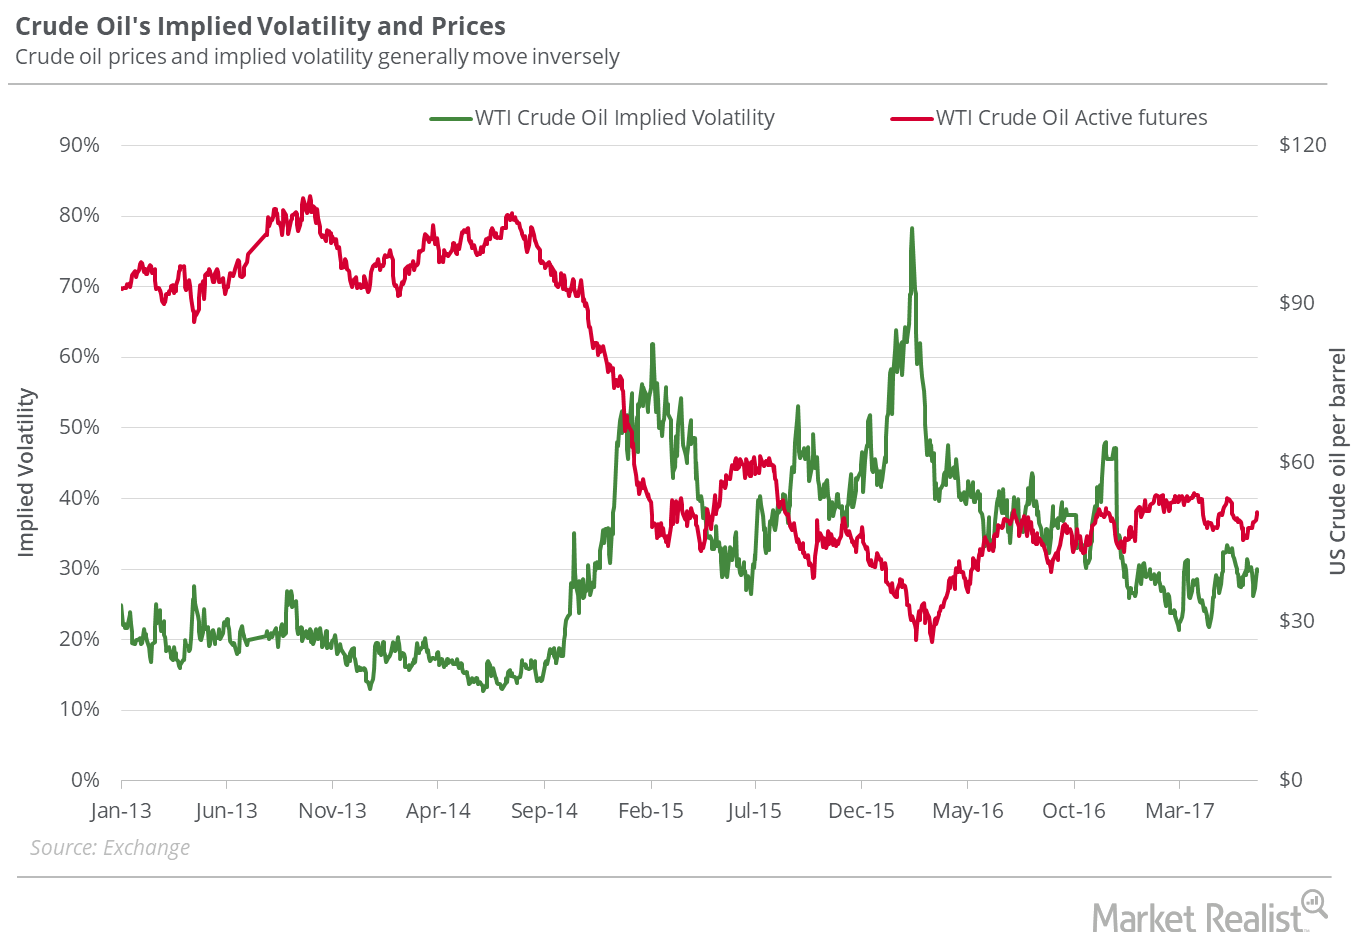
Will US Crude Oil Hit $40 Next Week?
On June 22, 2017, WTI crude oil (USO) (OIIL) active futures’ implied volatility was 29.7%, up 1.7% compared to its 15-day average.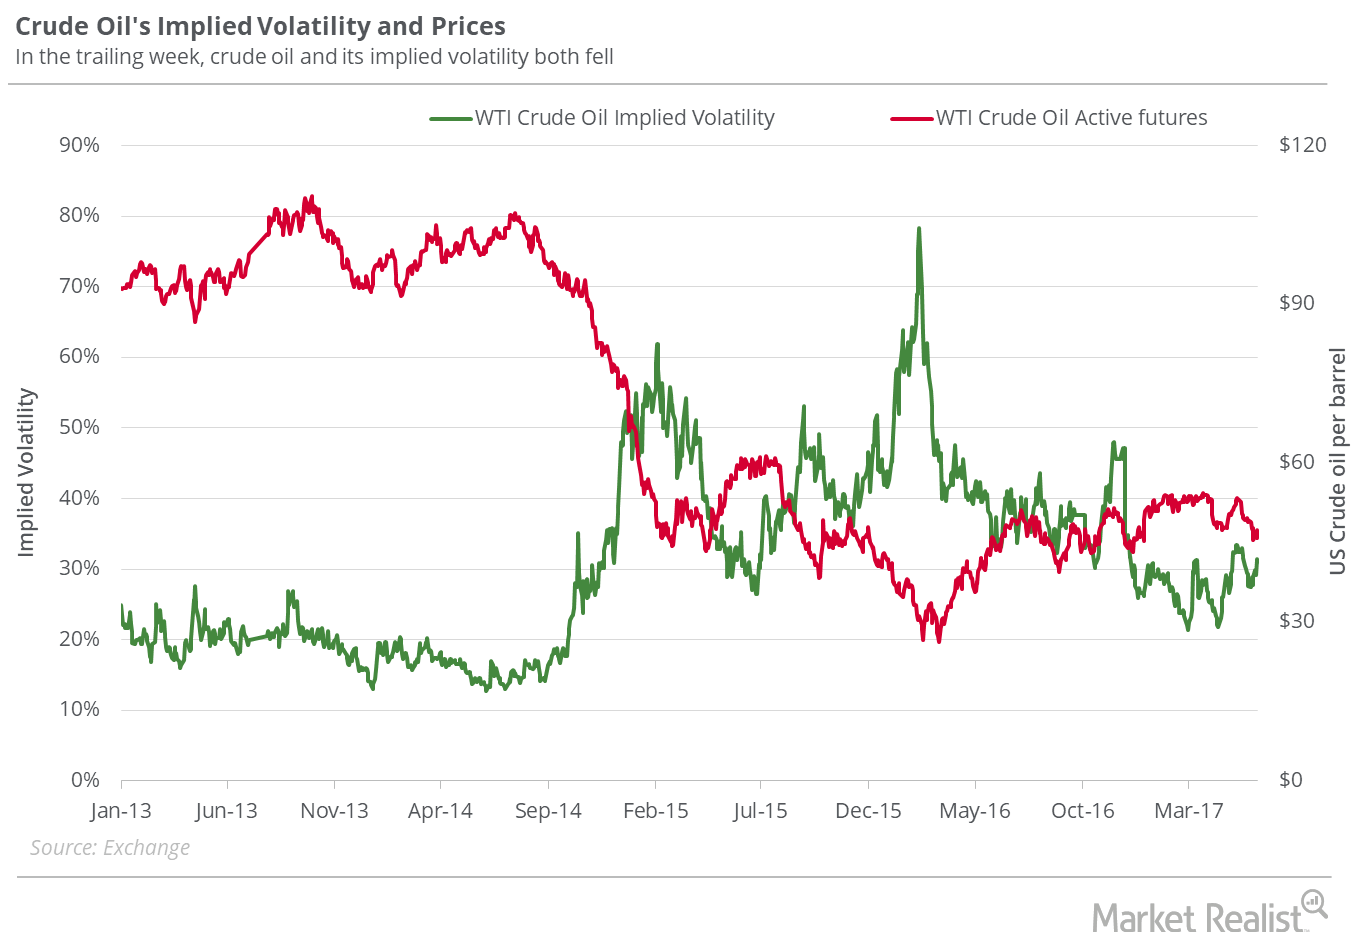
Where Will US Crude Prices Settle?
On June 15, 2017, US crude oil active futures’ implied volatility was 27.9%.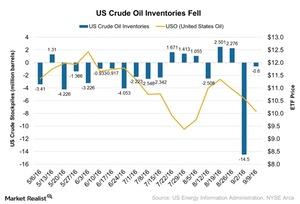
How OPEC’s Decision Will Impact Crude Oil’s Movement
According to the EIA’s (U.S. Energy Information Administration) report on September 14, 2016, US crude oil inventories fell 0.6 MMbbls (million barrels) for the week ending September 9.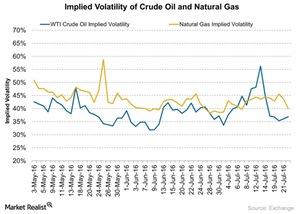
How Volatile Are Natural Gas and Crude Oil?
Natural gas’s (UNG) (GASL) (GASX) implied volatility was 40.0% on July 22, 2016. Its 15-day average implied volatility is 42.5%.