What Does The Price Action in Natural Gas Indicate?
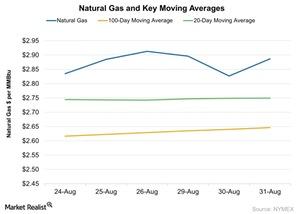
In the last five trading sessions, natural gas October futures have risen by 1.8%. They closed at ~$2.89 per MMBtu on August 31, 2016.
Sept. 1 2016, Updated 8:06 a.m. ET

Natural gas prices
In the last five trading sessions, natural gas (UNG) (FCG) (BOIL) (GASL) (GASX) (UGAZ) (DGAZ) October futures have risen by 1.8%. They closed at ~$2.89 per MMBtu (million British thermal units) on August 31, 2016—up ~2.1% compared to the previous session.
The gains coincide with concerns that the storm forming in the Gulf of Mexico is getting stronger. This might disrupt natural gas production there.
On July 1, active natural gas futures hit a 2016 high of $2.99—the highest level since May 2015 on a closing price basis. Currently, natural gas is ~3.3% below its 2016 high.
Why natural gas prices fell in early 2016
Last winter, natural gas usage for heating was weak due to mild weather. As a result, prices were weak. At the end of March 2016, US natural gas inventories were at 2.5 trillion cubic feet—67% higher than the levels in 2015 and 53% higher than their five-year average. Natural gas futures hit a 2016 and 17-year low of $1.64 on March 3.
Key moving averages
On August 31, natural gas futures were trading ~9% above their 100-day moving average and 5% above their 20-day moving average. This indicates bullishness in natural gas prices. The above graph shows the price performance of natural gas futures relative to key moving averages.
The natural gas sentiment also impacts ETFs such as the ProShares Ultra Oil & Gas ETF (DIG), the PowerShares DWA Energy Momentum Portfolio (PXI), the Vanguard Energy ETF (VDE), the iShares U.S. Energy ETF (IYE), and the Fidelity MSCI Energy Index ETF (FENY).
In the next part of this series, we’ll discuss the crude oil rig count. We’ll see how it impacts natural gas production and prices.
