Pioneer Natural Resources Co
Latest Pioneer Natural Resources Co News and Updates
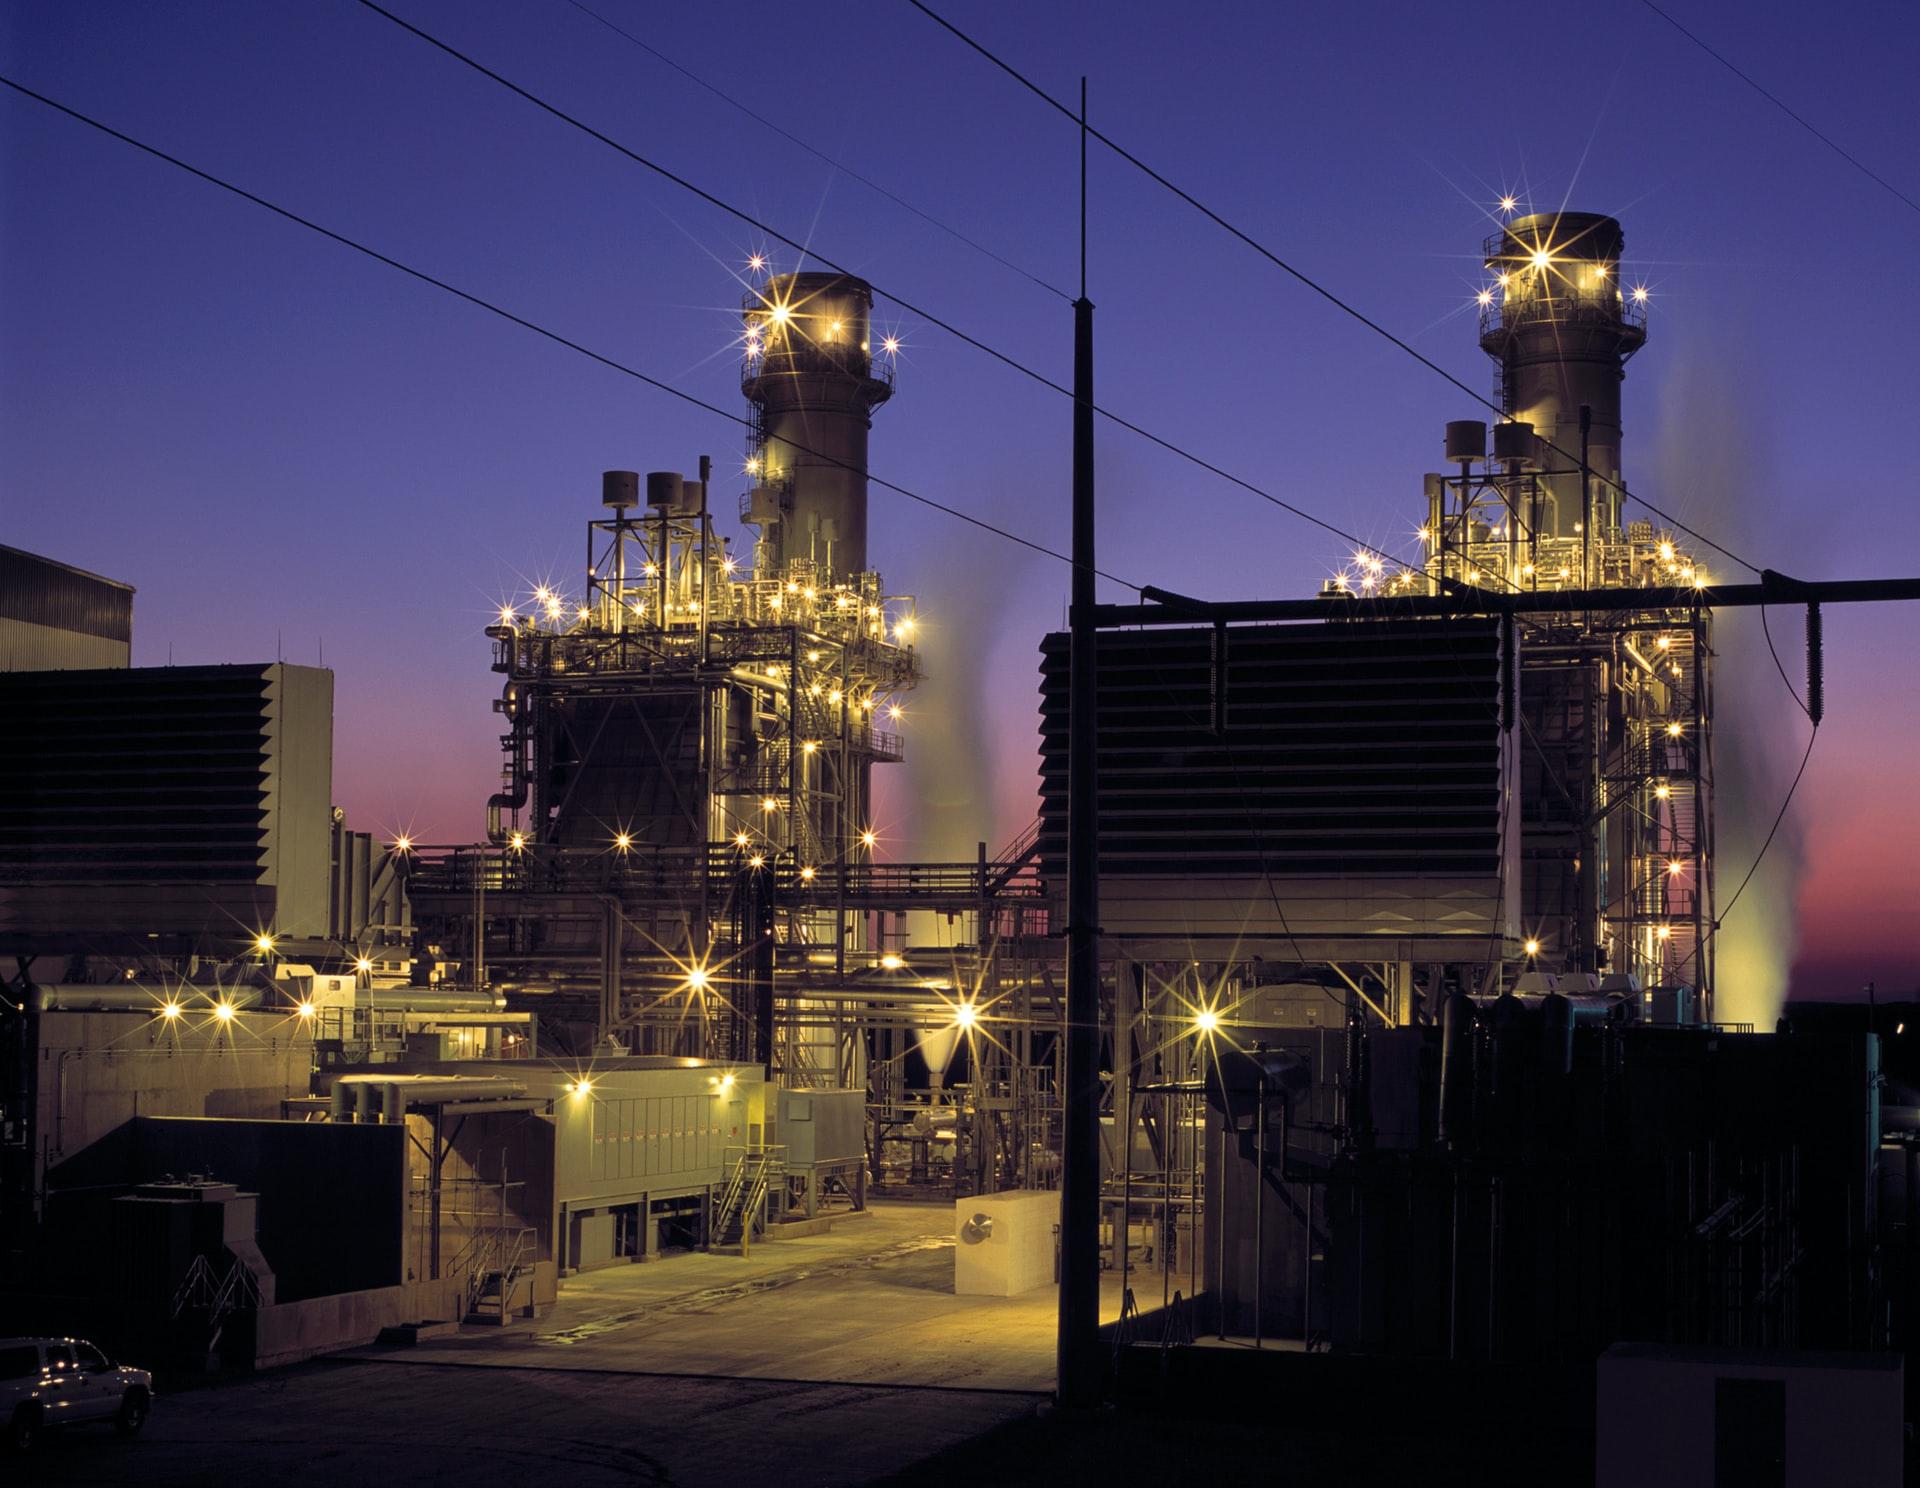
Perfect Storm for Natural Gas—What Are the Top Stock Picks?
With nearly 100 percent gains YTD, natural gas has become one of the top-performing commodities in 2021. What are the best natural gas stocks to buy now?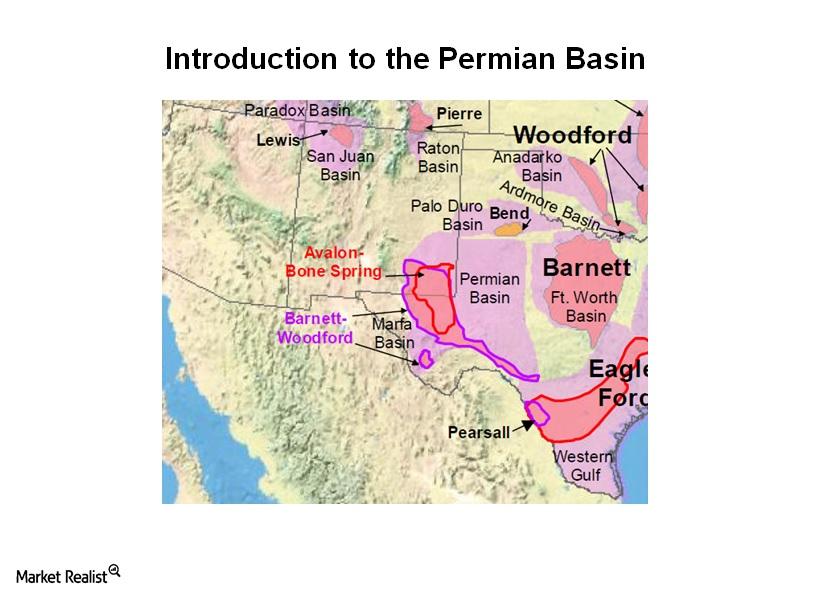
Introduction to the Permian Basin — Part 2: Geography of the Permian Basin
The Permian Basin is one of the US’s primary drivers of oil production growth. Market Realist provides an overview of this prolific hydrocarbon asset with a primer piece: “Introduction to the Permian Basin”.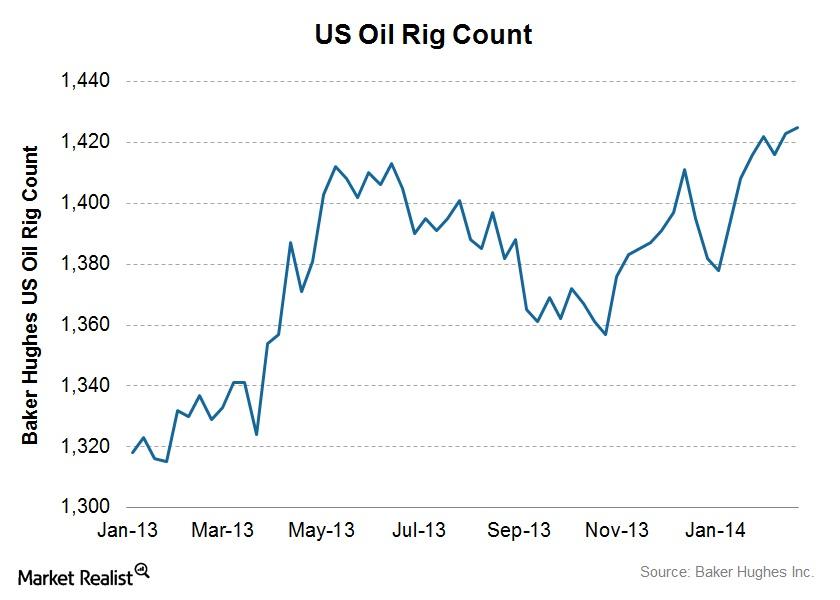
US oil rig counts continue to rally, reaching a year-to-date high
Last week, the Baker Hughes oil rig count increased from 1,423 to 1,425, reaching the highest level since 2014 began.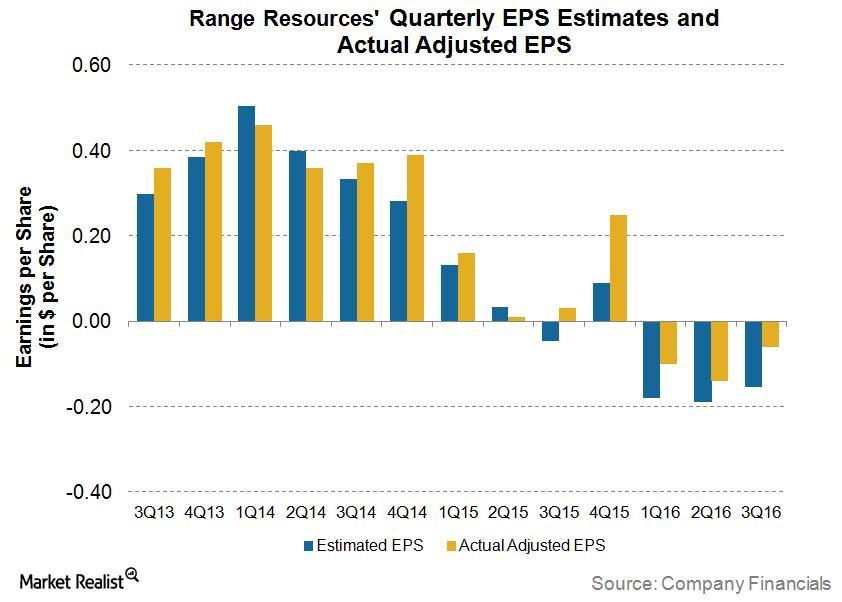
Inside Range Resources’ 3Q16 Earnings
For 3Q16, Range Resources reported an adjusted loss per share of $0.06—$0.09 better than the Wall Street analyst consensus estimate of $0.15 loss per share.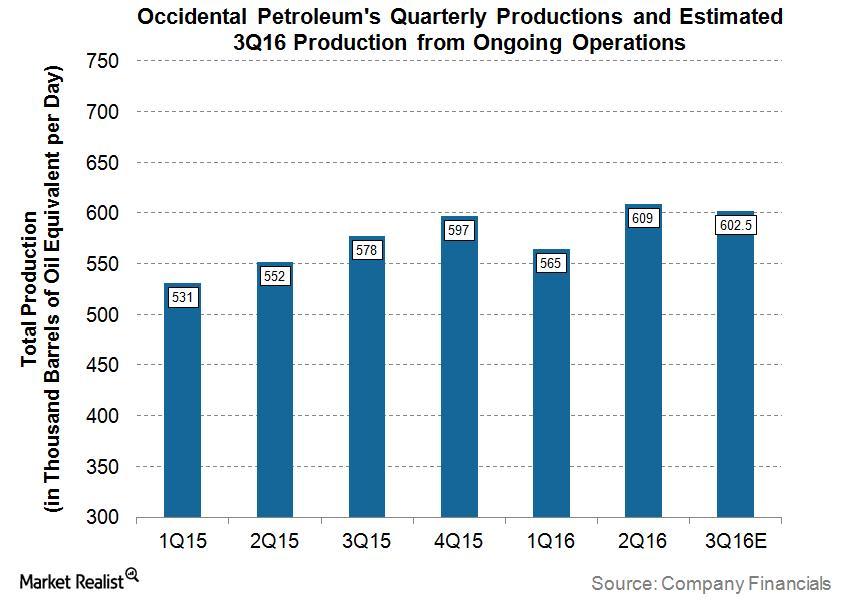
Did Occidental Petroleum Set a High Bar for 3Q16 Production?
For 3Q16, Occidental Petroleum expects its total production from ongoing operations to be in the range of 600–605 Mboe per day.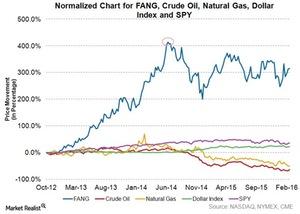
What’s Been Driving Diamondback Energy’s Stock Price Movement?
Diamondback Energy’s stock price saw uptrend from October 2012 to June 2014. When NYMEX WTI crude oil started falling in June 2014, FANG’s stock peaked.
Top Energy Gains Last Week
On April 16, McDermott International announced that it will release its first-quarter earnings results on April 29.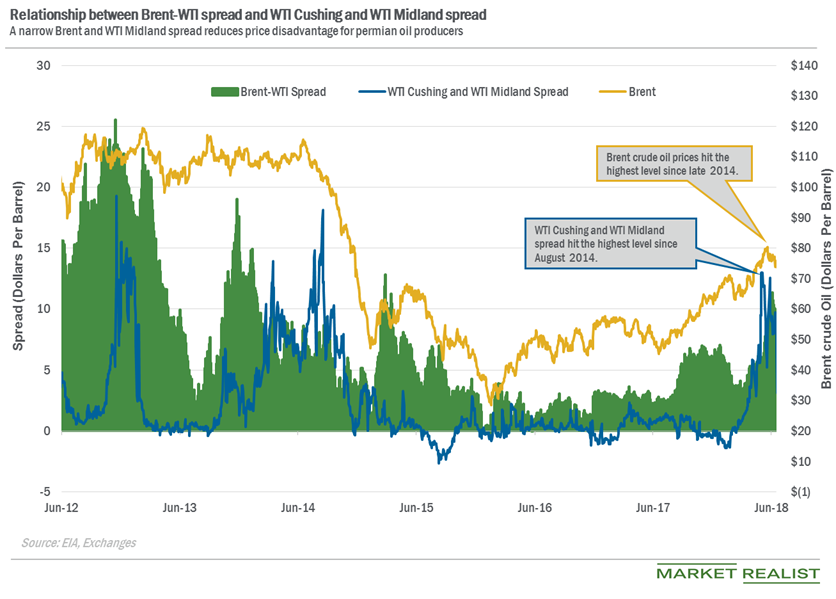
Why Did the WTI Cushing-WTI Midland Spread Drop?
The WTI Cushing-WTI Midland spread was at $4.12 per barrel on June 25—compared to $9.7 per barrel on June 18. The spread fell 58% on June 18–25.
Why WTI crude oil prices are down over 15% in 3 months
WTI crude oil prices continued to slide as U.S. crude inventories continued to grow, with domestic production surging.Financials Why the inverted head and shoulder pattern is formed
The inverted head and shoulder pattern is the reverse of the head and shoulder pattern. It’s formed at the bottom of the downtrend.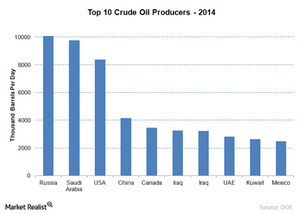
Why is OPEC important to the price of crude oil?
High market share gives OPEC bargaining power to price oil above a competitive market. It can sway crude oil prices by increasing or decreasing production.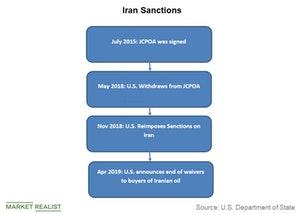
Why the US Imposed Sanctions on Iran and Why They Matter
The United States first imposed restrictions on its activities with Iran in 1979, after the seizure of the US embassy in Tehran.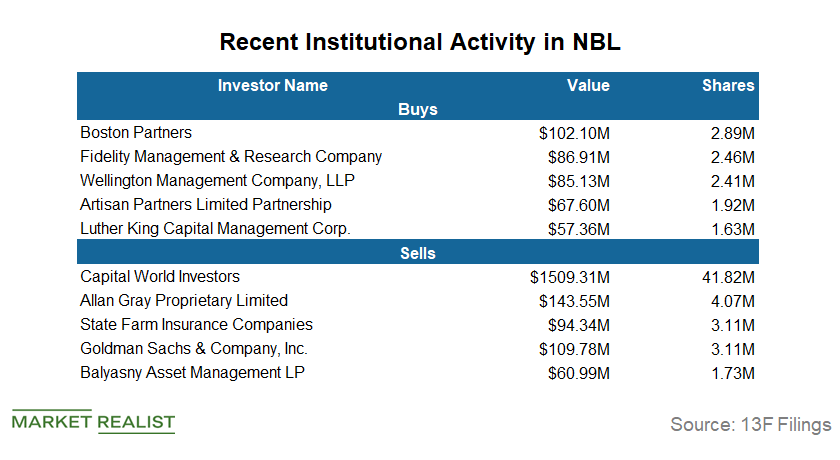
Capital World Investors Sold a Major Position in NBL in Q2
So far in this series, we’ve looked at institutional investments in five major oil-weighted E&P (exploration and production) stocks: ConocoPhillips (COP), EOG Resources (EOG), Occidental Petroleum (OXY), Anadarko Petroleum (APC), and Pioneer Natural Resources (PXD).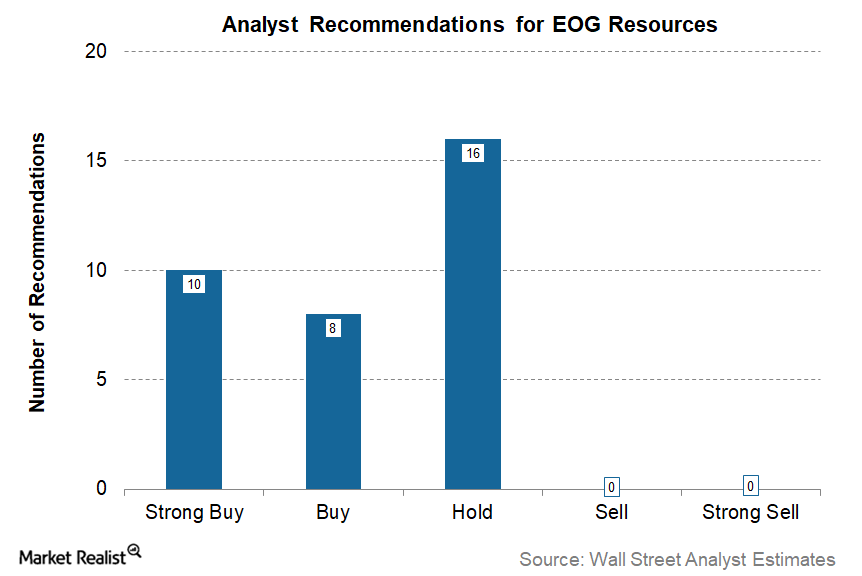
EOG Resources: Post-Earnings Wall Street Ratings
As of March 1, 2018, a total of 34 analysts have made recommendations on EOG Resources (EOG) stock, according to Reuters.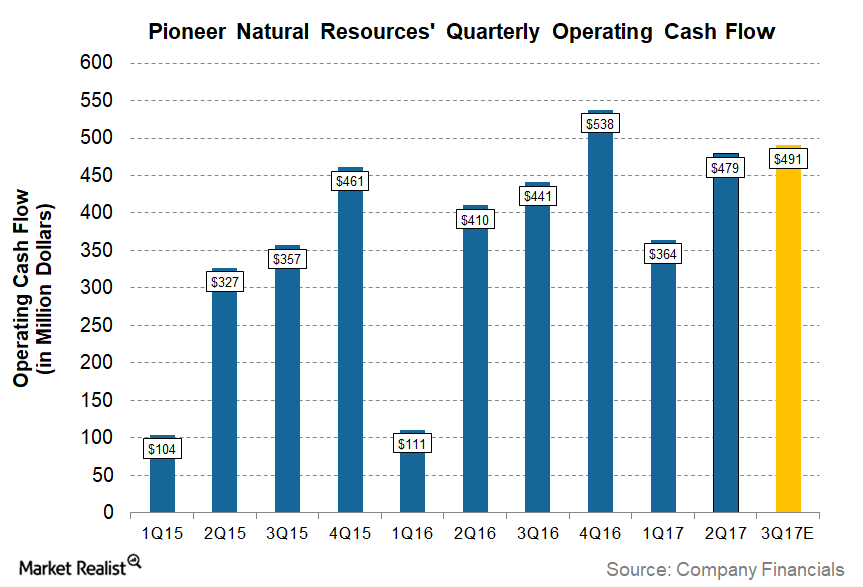
What to Expect from Pioneer Natural Resources’ Cash Flow in 3Q17
Wall Street analysts expect Pioneer Natural Resources (PXD) to report year-over-year higher cash flow of ~$491 million in 3Q17 compared to ~$441 million in 3Q16.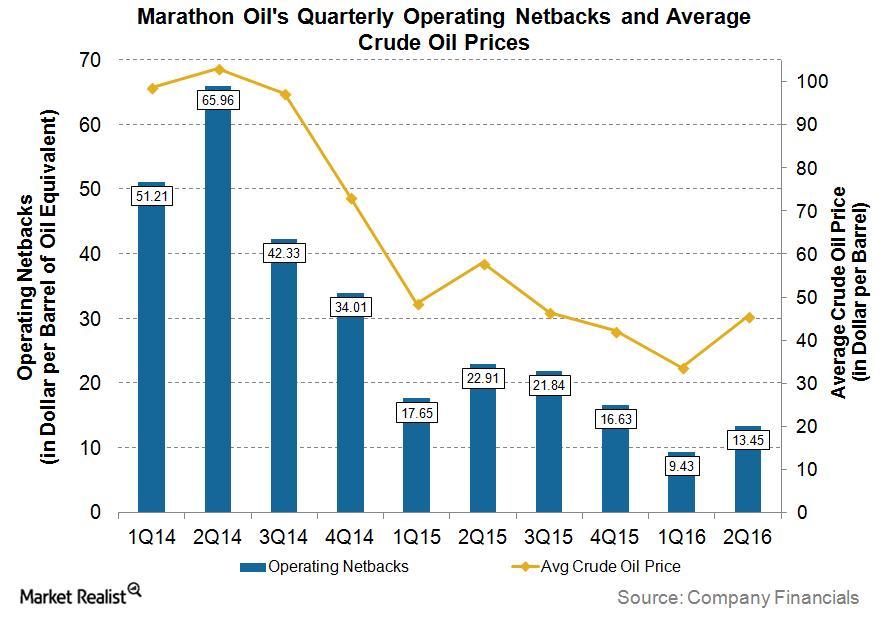
Marathon Oil’s 2Q16 Operating Netbacks Unveiled
In 2Q16, Marathon Oil (MRO) reported an operating netback of ~$13.45 per boe (barrel of oil equivalent), which is ~41% lower than in 2Q15.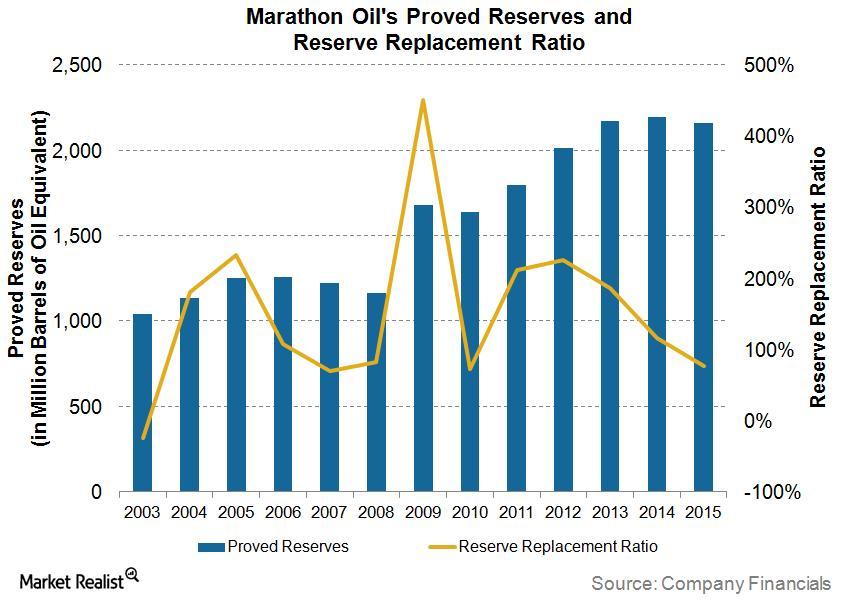
How Are Marathon Oil’s Proved Reserves Evolving?
As of December 31, 2015, the Marathon Oil’s (MRO) proved reserves totaled ~2163 MMboe, which is ~35 MMboe less than in December 31, 2014.
How Range Resources Stock Reacted after Past Earnings Beats
In March 2016, Range Resources stock made a higher high for the first time in almost two years. Since January 2016, Range Resources stock has risen a whopping 112%.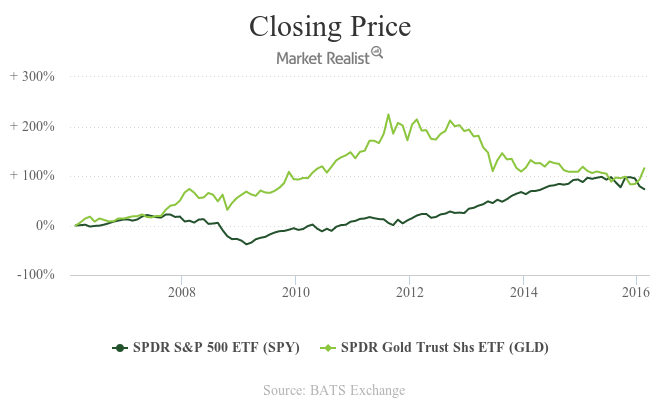
How Gold Correlates with the S&P 500 Index
Since July 2011, the S&P 500 Index has gained about 62% and touched its high of 2130 in July 2015. During the same period, gold (GLD) has lost about 92%.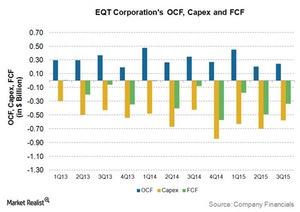
The Downward Trend of EQT’s Free Cash Flow
EQT has been reporting negative free cash flows since 2Q13. In 3Q15, EQT’s free cash flow was -$334 million.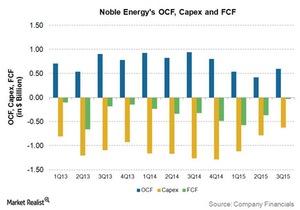
A Look at Noble Energy’s Free Cash Flow Trends
Noble Energy reported negative but improving free cash flows in 2015.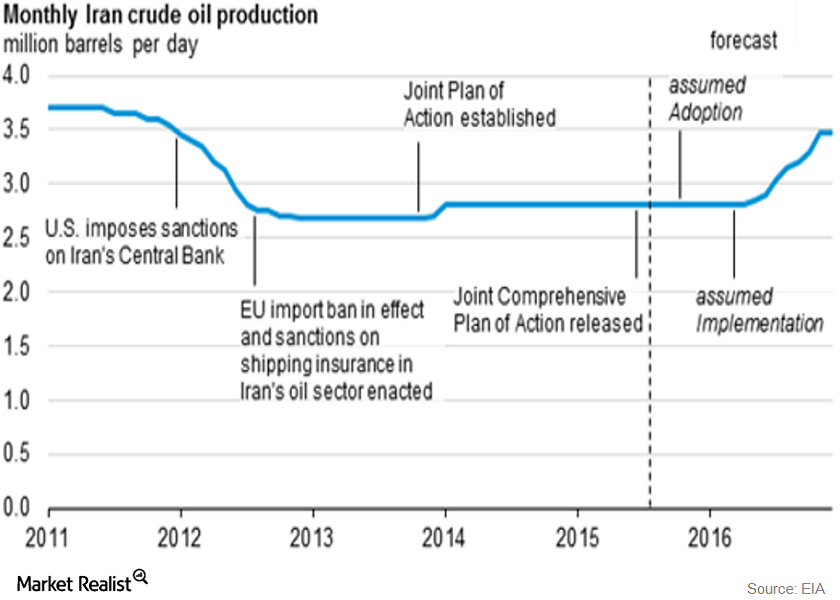
Iran’s Oil Sanctions Lifted: Brent Oil Prices Feel the Heat
Thus, Iran’s Western oil sanctions were lifted on Saturday, January 16, 2016. On Sunday, January 17, Iran stated that it would increase its crude oil production by 500,000 bpd (barrels per day) as soon as possible.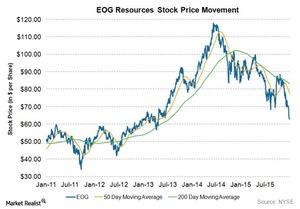
EOG Resources Failed to Hold above Its 200-Day Moving Average
In 3Q15, excluding the one-time items, EOG reported a profit of $0.02 per share, $0.32 better than the analyst consensus for a loss of $0.30 per share. Its revenues fell ~58% year-over-year to ~$2.17 billion.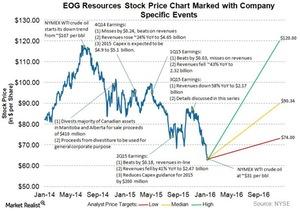
Analyzing EOG Resources’ 3Q15 Earnings Call
Currently, ~67% of Wall Street analysts rate EOG as a “buy” and ~31% of analysts rate it as a “hold.” Only ~2% rate the stock a “sell.”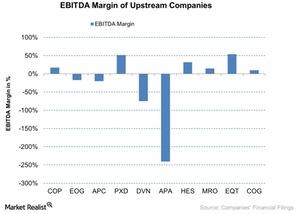
Operating Margins for Upstream Companies Rose
The operating margin of the US-based (SPY) upstream companies rose by an average of 16%.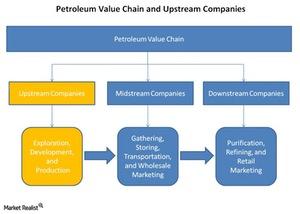
Where Do Upstream Energy Companies Sit along the Petroleum Value Chain?
Upstream energy companies are the starting point of the petroleum value chain and are involved in exploration, appraisal, development, and production.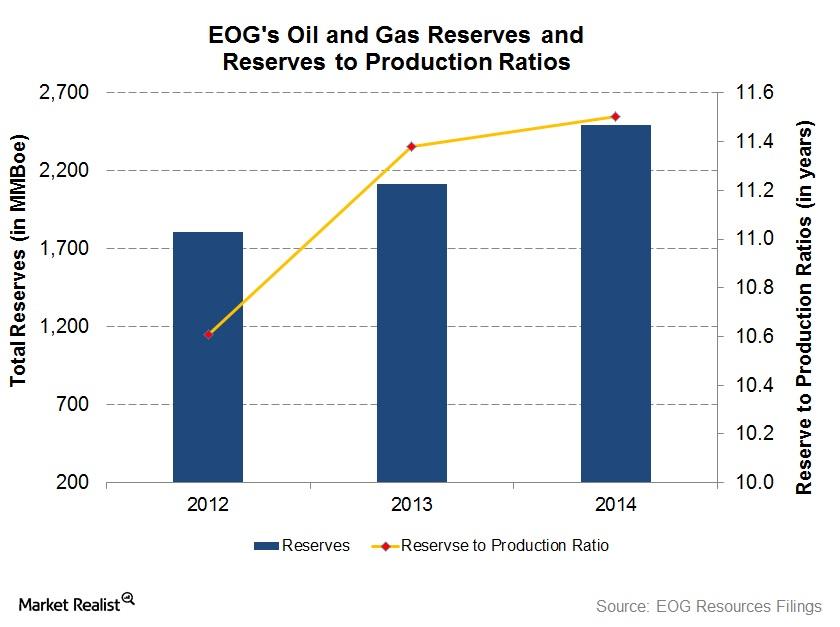
Growth in EOG Reserves Outpaces Production
EOG’s reserves-to-production ratio, or reserve life, increased from 10.6x in 2012 to 11.5x in 2014. It would take EOG 11.5 years to deplete its proved reserves at its 2014 production rate.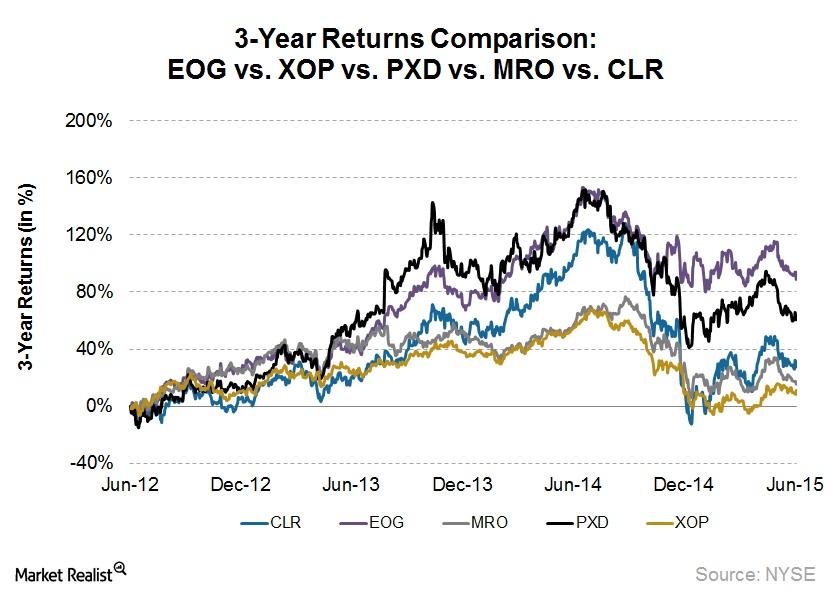
EOG and Pioneer: The Best Upstream Stocks in the Past 3 Years
Of the top American upstream stocks, EOG Resources has been the outperformer since June 2012, returning 93%. During the same period, Pioneer Natural Resources (PXD) returned 61%.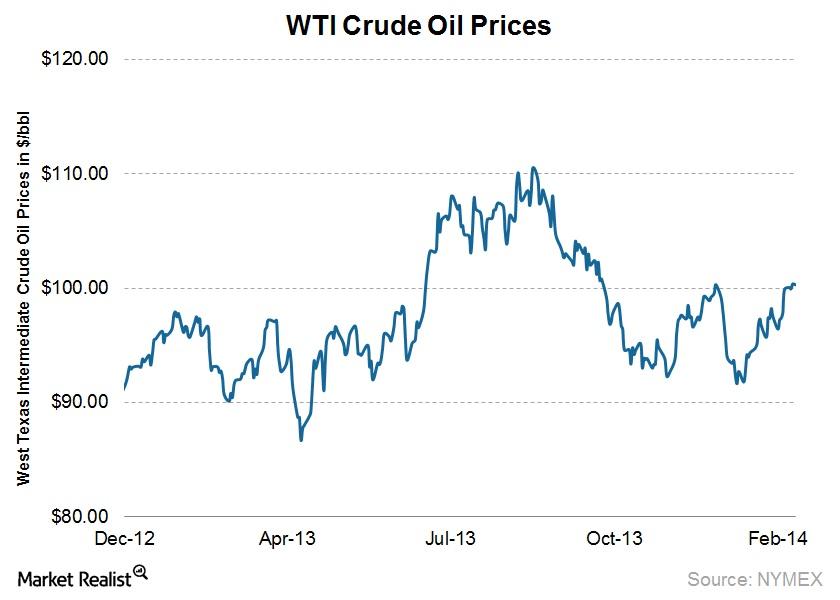
WTI crude prices break $100 per barrel for the 1st time in 2014
WTI traded flat last week, but firstly traded up $100 per barrel since December 27. This past week’s upward movement in prices was a short-term positive for the sector.
