Lennar Corp
Latest Lennar Corp News and Updates

How Much Do 3D-Printed Homes Cost?
The largest 3D-printed neighborhood is coming to Austin, Tex. What's the price tag for 3D-printed abodes?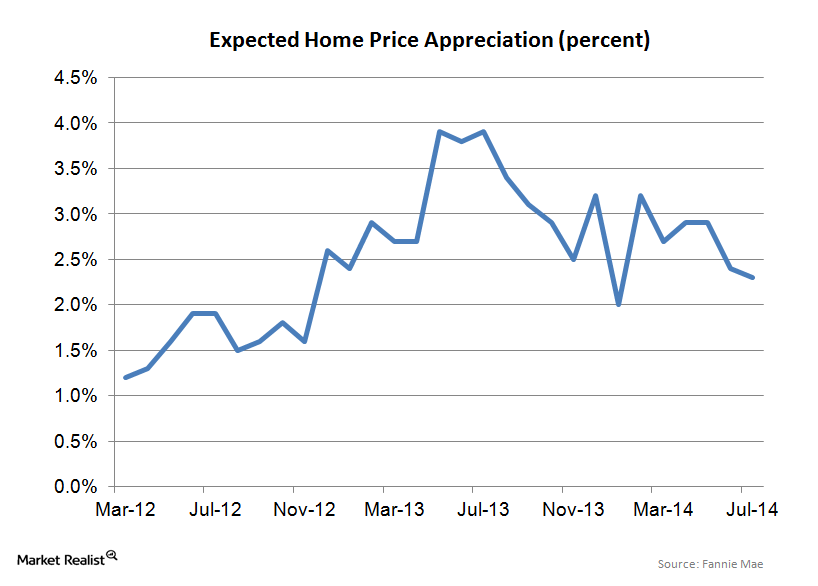
Consumers are tempering their home price appreciation expectations
The 2.3% home price expectation is much lower than the 6%–7% forecast we’re seeing out of the National Association of Realtors and the mid single-digit forecast we’re seeing from most Wall Street professionals.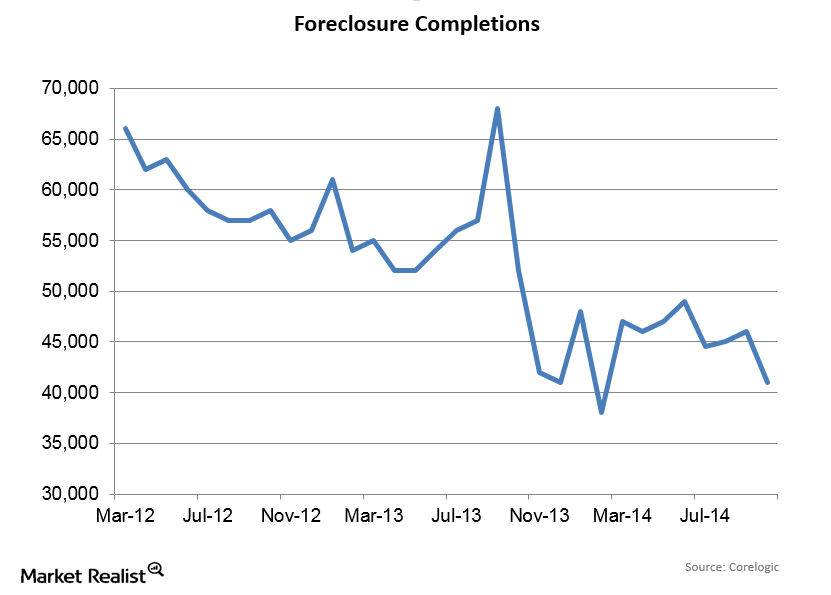
Foreclosure Completions Drop In October
Since foreclosures represent a process that may or may not wind up with the bank owning the home, foreclosure completions are a better indicator of foreclosure activity than foreclosure starts.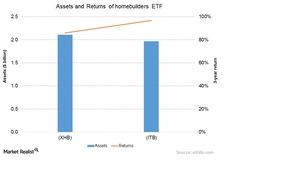
Why you should invest in homebuilder ETFs like XHB and ITB
ETFs present another investment avenue. Apart from pure homebuilder ETFs, there are many other ETFs that offer exposure to homebuilders.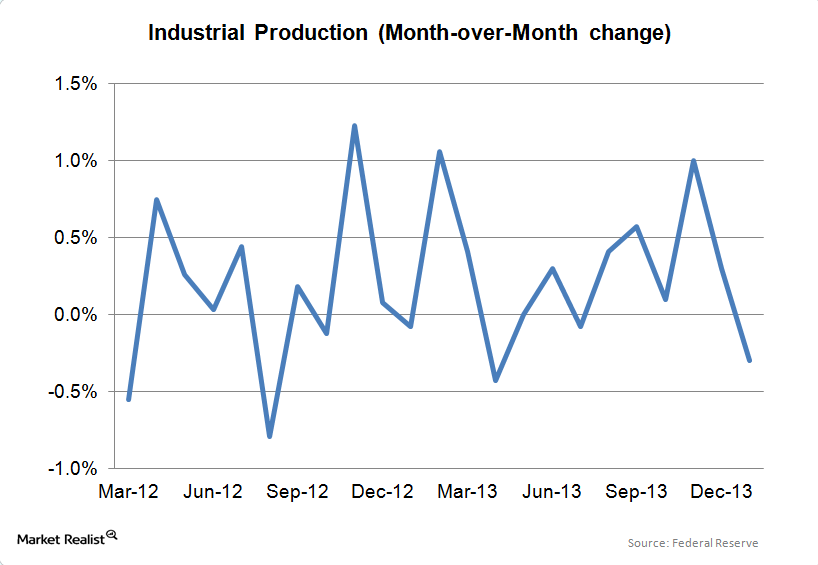
A decline in manufacturing causes industrial production to fall
Up until January, industrial production and manufacturing production had been accelerating, so it is premature to draw any major conclusions from one disappointing report.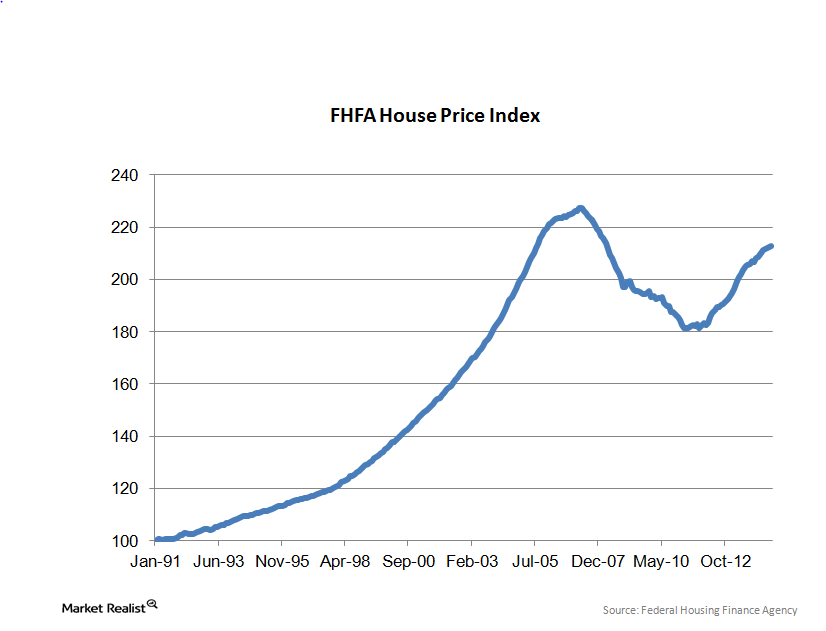
Must-know: Why home-price appreciation is leveling off
In July, home prices increased 0.1% month-over-month. They’re up 4.4% year-over-year (or YoY). Prices are now within 6.5% of their April 2007 peak. They correspond to the levels in July 2005. Real estate values drive consumer confidence and spending. They have an enormous impact on the economy.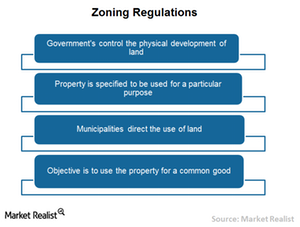
How Zoning Regulations Impact City Development
Zoning is the way that governments supervise land development and the kinds of uses each individual property may be directed toward for the public interest.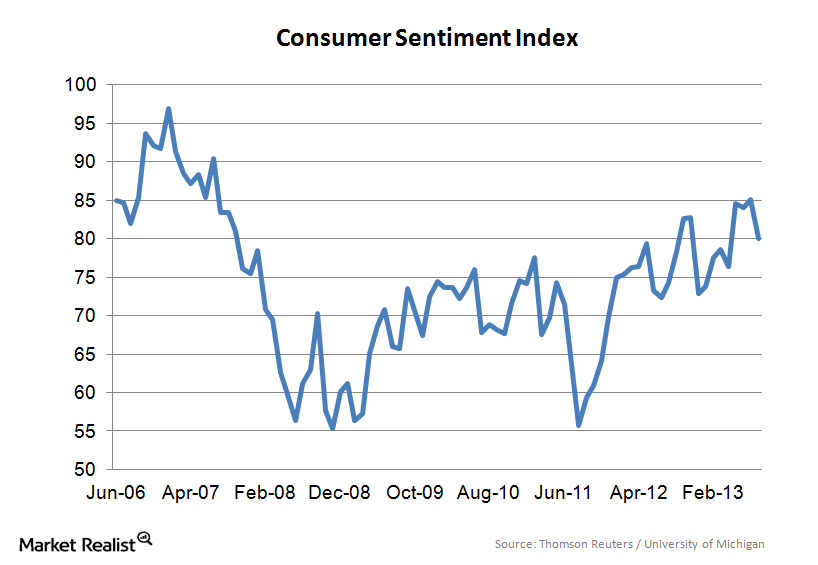
University of Michigan Consumer Confidence Index dips in August
The Thomson Reuters/University of Michigan Consumer Confidence Index is a leading indicator for the U.S. economy The Thomson Reuters/University of Michigan Consumer Confidence Index is an important indicator of the consumer’s perception of the U.S. economy. Similar to other consumer confidence measures, it asks consumers about their views on the current economic conditions and their […]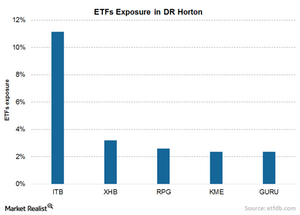
How to Invest in D.R. Horton through ETFs
D.R. Horton sees allocation in major homebuilding sector-specific ETFs like the iShares Dow Jones US Home Construction Index Fund (ITB).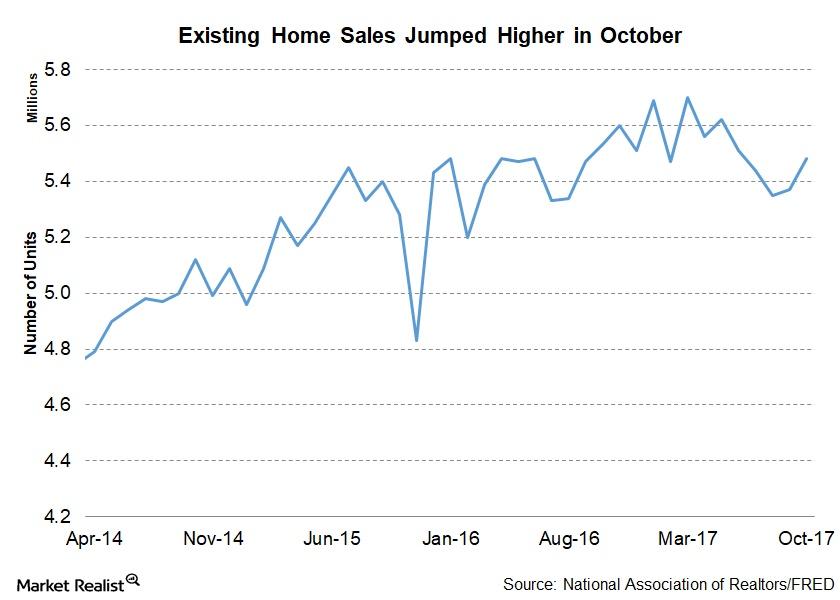
Households Think It’s a Good Time to Buy a Home
According to the latest report from NAR, existing home sales have risen 2% to a seasonally adjusted annual rate of 5.48 million in October.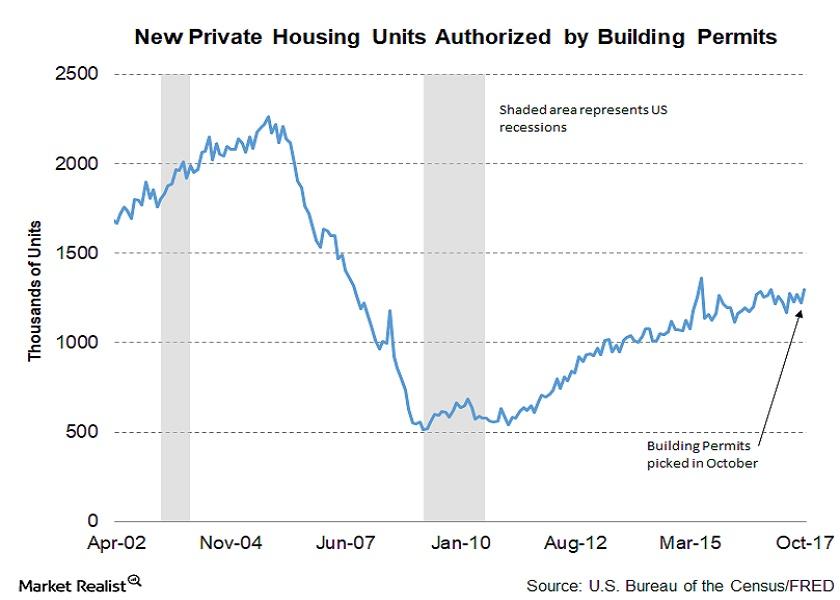
Housing Market: What a Rise in Building Permits Signals
In October 2017, building permits were at a seasonally adjusted rate of 1.297 million—an increase of 5.9% from the reading of 1.225 million in September.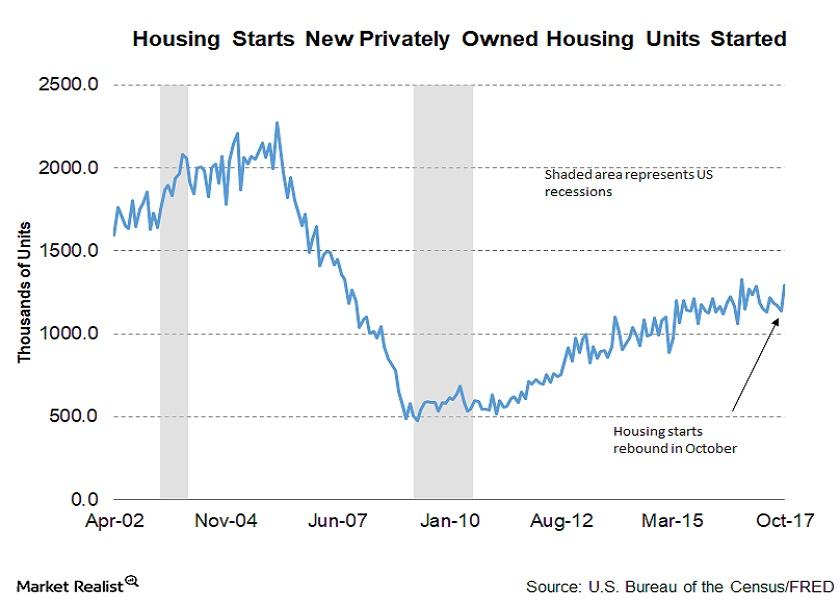
Analyzing Housing Starts in October 2017
In October 2017, housing starts rebounded sharply from the slump in September. October housing starts beat the market’s expectations.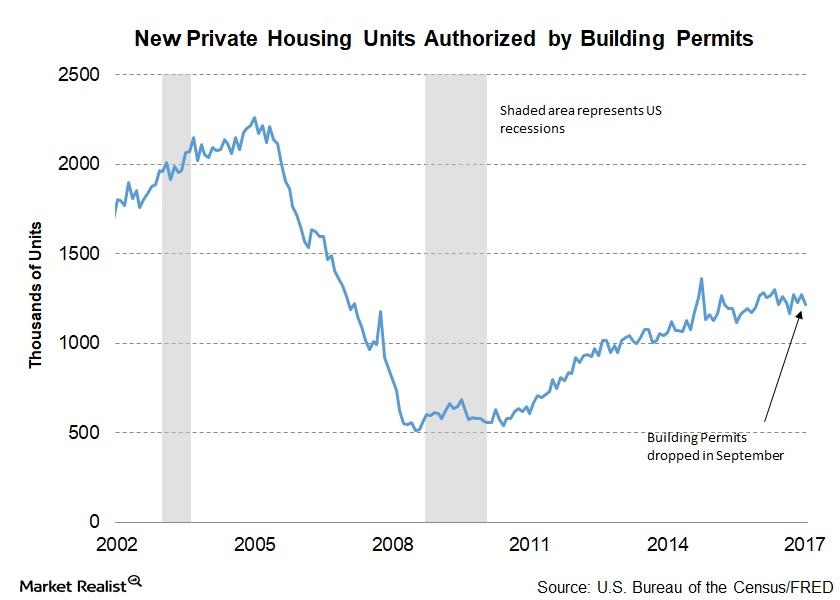
Is the Drop in September Building Permits Cause for Concern?
In September 2017, building permits were at a seasonally adjusted annual rate of 1.215 million—a fall from August’s 1.272 million and 4.3% below September 2016.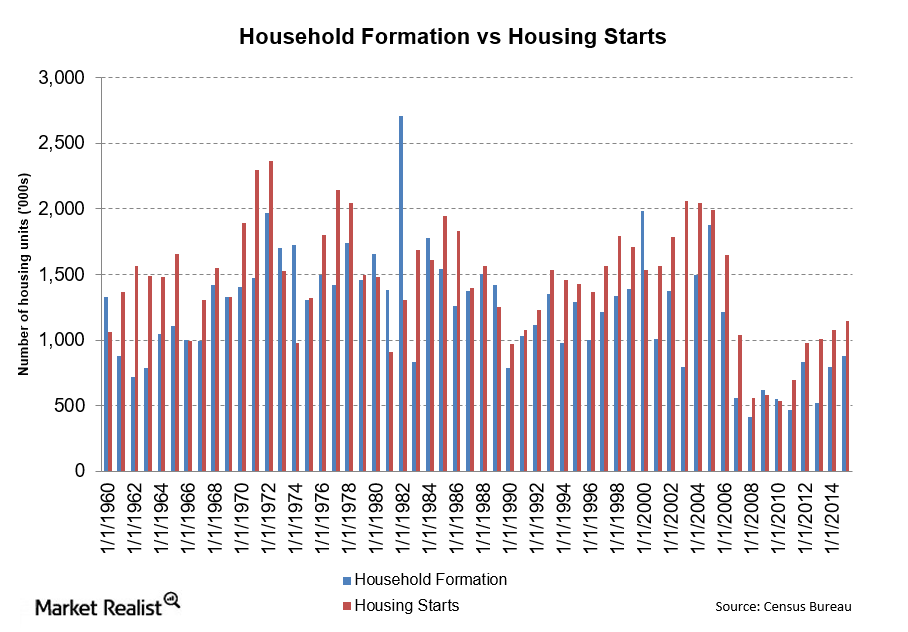
Limited Supply: Analyzing Housing Starts and Household Formations
There was a big fall in household formation in 2008. In 2005, household formation peaked at 1.9 million. By 2008, that number was just over 400 million.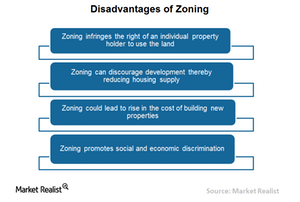
How Zoning Can Be a Hindrance to Housing Market Growth
Zoning restricts the freedom of property holders and REITs to use land however they want, given their specific development and investment interests.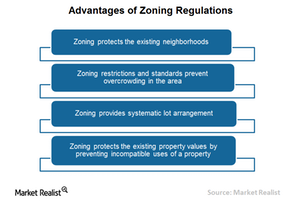
How Zoning Regulations Benefit Communities
Zoning protects existing property values by preventing incompatible uses of a property. It also protects residential properties from commercial development.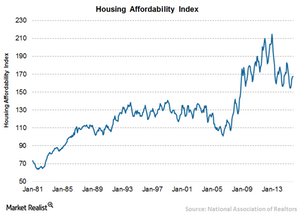
What Are the Factors Driving Housing Affordability?
Housing affordability took a beating in July 2015 after reaching its high in January 2013. The higher ratio of the home affordability index signifies relatively higher home affordability to buyers.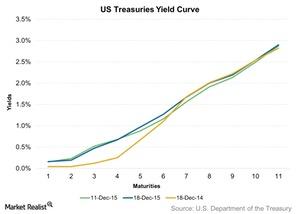
Treasury Yield Curve Flattened after US Interest Rate Hike
The US Treasury yield curve was flat for the week ended December 18, 2015, as short-term yields fell. Medium- to long-term yields rose after US interest rates rose by 25 basis points.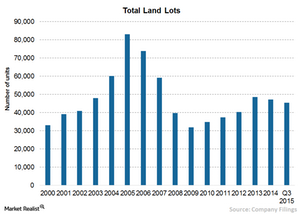
Understanding Toll Brothers’ Land Acquisition Strategy
Toll Brothers’ use of land option agreements reduces financial risks associated with long-term land holdings. The land acquisition strategy of other homebuilders also involves option contracts.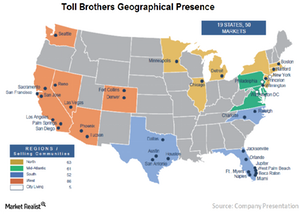
A Geographic Overview of Toll Brothers’ Homebuilding Operation
Toll Brothers (TOL) has a very geographically diverse homebuilding operation in the United States. The company has a presence in 50 markets, spanning 19 states as well as the District of Columbia.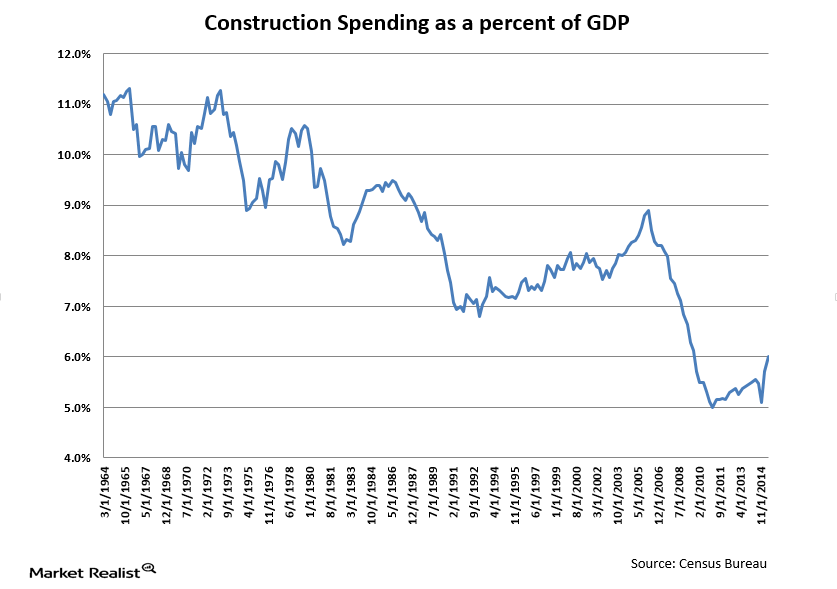
The Importance of Construction Spending to GDP
Historically, construction spending has led economies out of recessions. This didn’t happen in the most recent recession, however, because of the overhang from the real estate bubble.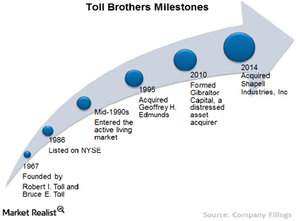
Investing in Toll Brothers: A Must-Know Company Overview
Toll Brothers is primarily engaged in the development of attached and detached homes in luxury residential communities. It’s a dominant player in the luxury segment with very few comparable competitors.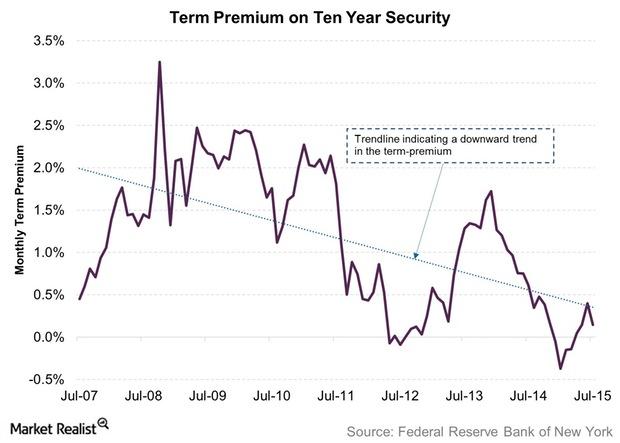
What Does US Term Premium Indicate?
Over an eight-year period, the term premium on a ten-year US security rose to 3.25% in October 2008. It saw a low of -0.37% in January 2015.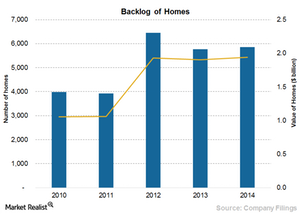
Why PulteGroup Saw a Modest Rise in Sales Order Backlog in 2014
Sales order backlog represents homes under contract but not closed or delivered. For orders in backlog, the company receives a customer contract and deposit, which may or may not be refundable.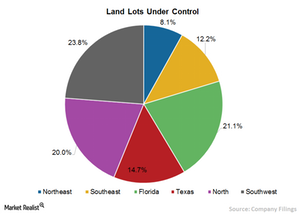
Understanding PulteGroup’s Land Acquisition Strategy
PulteGroup (PHM) mainly acquires land to complete sales of housing units within 24 to 36 months from the date of opening a community.
What Is PulteGroup’s Market Segmentation Strategy?
The move-up buyers in Pulte Homes communities tend to place more premium on location and amenities.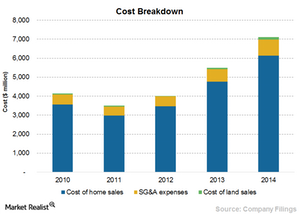
What Was D.R. Horton’s Cost Structure Breakdown in 2014?
Cost of homes sold is the highest of the company’s costs at 78.1%, followed by SG&A at 10.6%, and cost of land sold at 1.6%.
What Is D.R. Horton’s Market Segmentation Strategy?
As part of its market segmentation strategy, D.R. Horton launched a variety of different brands, including D.R. Horton, America’s Builder, Express Homes, and Emerald Home.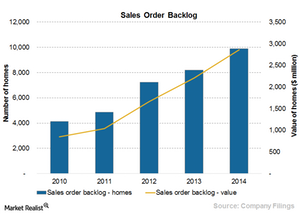
D.R. Horton’s Huge Sales Order Backlog Ensures Sustainable Growth
Pretty much all of the homes in D.R. Horton’s sales order backlog at the end of fiscal 2014 are likely to close in fiscal 2015, which will boost the company’s revenues.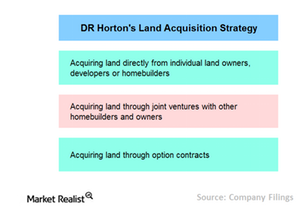
Understanding D.R. Horton’s Land Acquisition Strategy
D.R. Horton directly acquires almost all of its land and lot positions. The company has initiated few joint ventures for land acquisitions.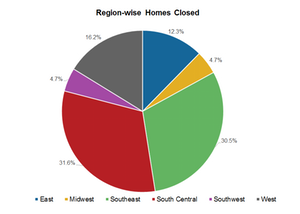
An Overview of D.R. Horton’s Homebuilding Segment
The homebuilding segment of D.R. Horton, which mainly focuses on single-family attached and detached homes, is divided into six divisions.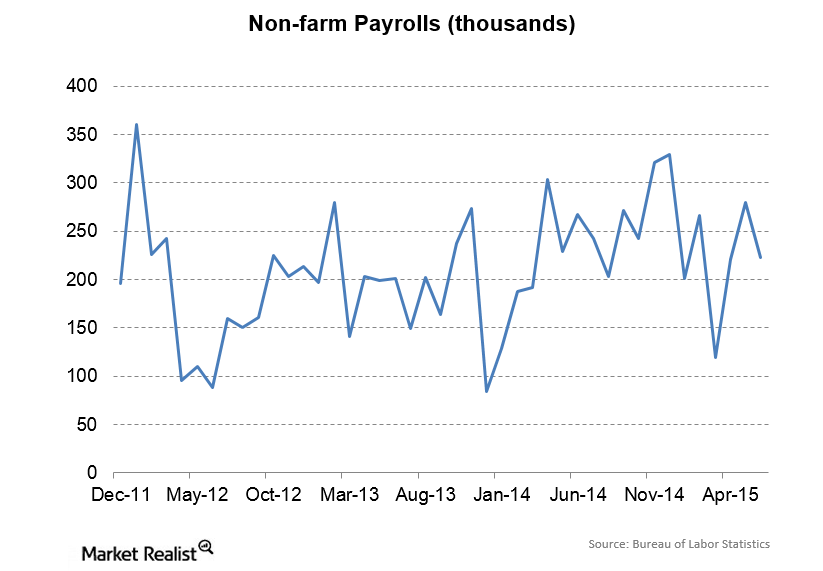
June Payrolls Increase
Private payrolls increased by 223,000 in June, while government jobs growth was flat and manufacturing employment barely increased.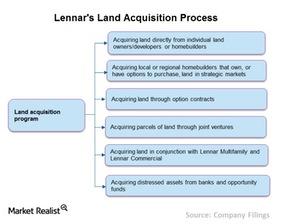
Lennar’s Diversified Land Acquisition Process
Lennar’s land acquisition process includes acquiring land from individual land owners, developers, or homebuilders. Lennar also creates JVs to acquire land.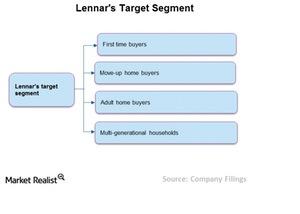
Market Segmentation in Lennar Corporation
Lennar’s market segmentation is primarily first-time, move-up, and active adult homebuyers in areas ranging from urban infill to golf course communities.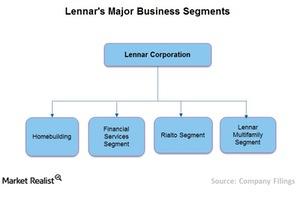
Lennar’s Four Main Business Segments
Lennar’s (LEN) four main business segments include Homebuilding, Lennar Financial Services, Rialto, and Lennar Multifamily.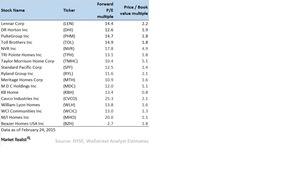
Valuing homebuilders: Buying at the right price
Homebuilders earn substantial profits buying land at a cheaper rate, allowing it to appreciate over time, constructing a house on it, and selling it.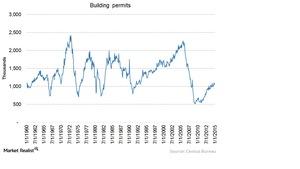
Understanding building permits and their impact on homebuilders
Along with housing starts, building permits are also a leading indicator of the health of the US housing market.
The basics of the US homebuilding industry for investors
The US homebuilding industry comprises many large, publicly traded residential construction companies. Top homebuilders mainly focus on specific categories.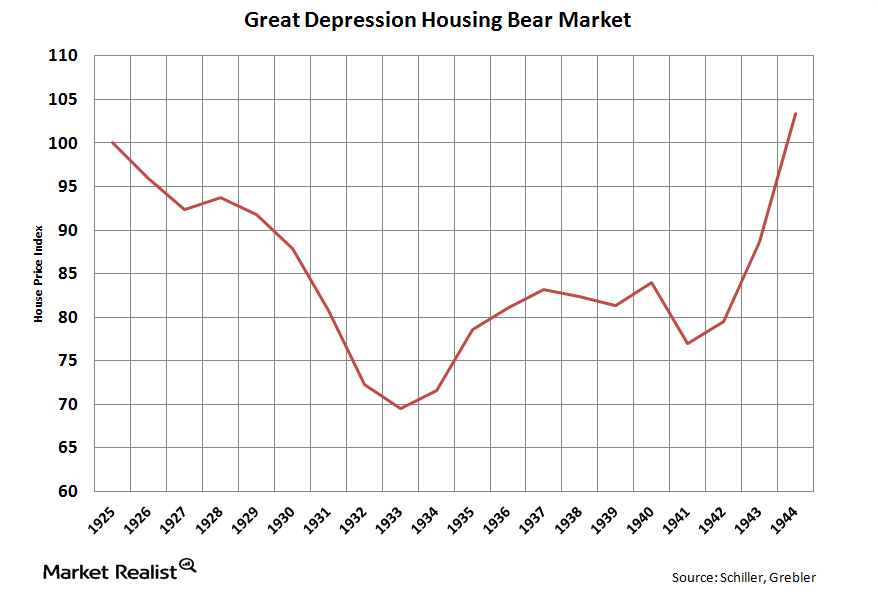
Comparing the Great Depression’s housing bear market with today’s
The real estate bubble of the 2000s was bigger than the real estate bubble of the 1920s In many ways, the dual stock market and real estate bubbles of the 1920s were a mirror image of the 2000s market collapse. The 1920s real estate boom peaked in 1925, and the stock market collapsed four years […]