DR Horton Inc
Most Recent
ConsumerCould New Home Sales Continue to Rise?
The US Census Bureau and Department of Housing and Urban Development report monthly data on the number of new homes sold in the United States.
Company & Industry OverviewsA Glance at Key Updates in the Consumer Sector
So far in 2018, the S&P 500 Consumer Discretionary Index has risen 13.7%, outperforming the S&P 500 Index’s rise of 3.9%.
ConsumerAnalyzing the Consumer Cyclical Sector’s Dividend Yield: Part One
The consumer cyclical sector has an average dividend yield of 1.4%.
Macroeconomic AnalysisWhy the Fall in April New Home Sales Isn’t a Reason to Worry
As per the recent report, new single-family homes (XHB) sold in April were at a seasonally adjusted rate of 662,000 units.
Macroeconomic AnalysisShould Housing Investors Worry about Declining Building Permits?
An increase in the number of building permits in any given month is a signal for increased activity in the housing sector (DHI) in the future.
ConsumerWhat to Make of the March Increase in Building Permits Issued
The US Census Bureau and Department of Housing and Urban Development report monthly data on building permits issued in the United States.
ConsumerWhy a Rebound in March Housing Starts Isn’t Satisfying the Sector
The volatility in housing starts data remains elevated. Housing starts in March were reported to have risen 1.9%.
ConsumerWhat to Make of the Drop in Building Permits Issued in February
The decrease in building permits spanned across the sectors in February.
ConsumerWhat’s behind the 7% Fall in February Housing Starts?
Just as markets were celebrating the stellar 9.7% increase in housing starts in January, the February data proved to be a damper for that enthusiasm.
ConsumerWhy Building Permits Didn’t Change in December
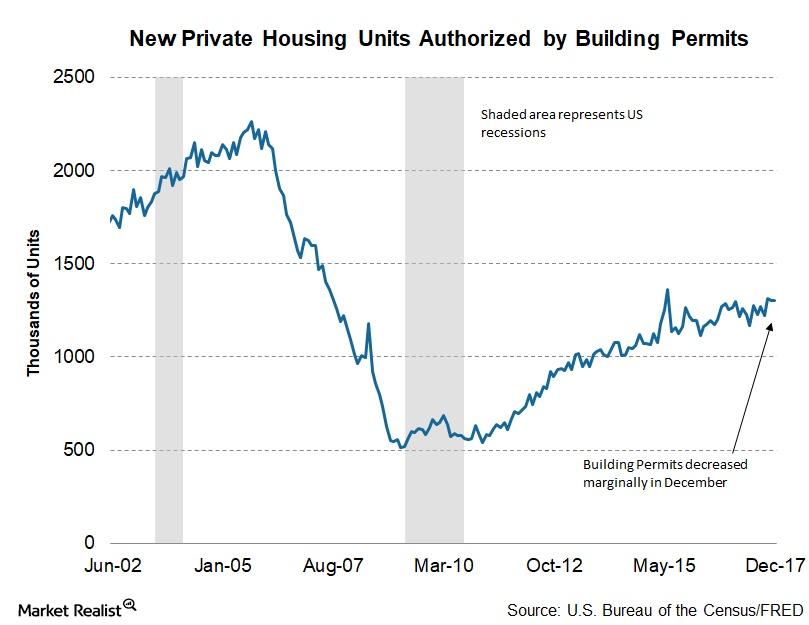
For 2017, 1,263,400 housing units have been authorized by building permits—a 4.7% increase from 1,206,600 housing units in 2016.
ConsumerShould Investors Be Concerned about Fewer Building Permits?
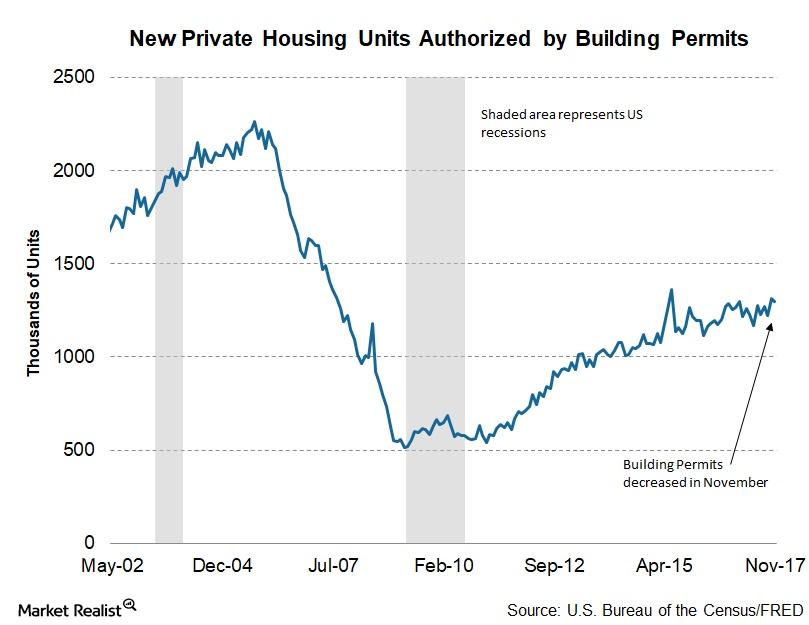
In November 2017, housing units (XHB) authorized by building permits were at a seasonally adjusted rate of 1.298 million—a decrease of 1.4% from October.
ConsumerAnalyzing Housing Starts in October 2017
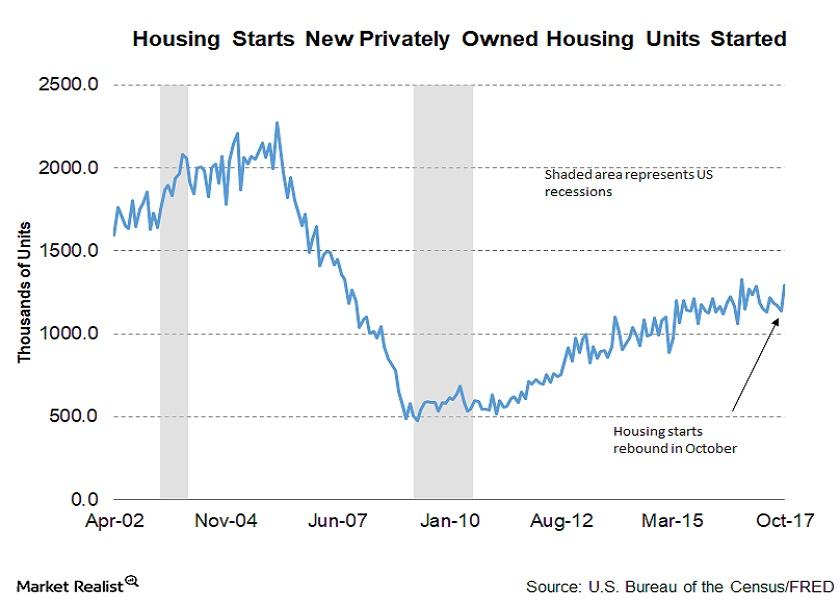
In October 2017, housing starts rebounded sharply from the slump in September. October housing starts beat the market’s expectations.
ConsumerThe Truth about Housing Starts in September 2017
In September 2017, US housing starts fell from an upwardly revised August number of 1.183 million to 1.127 million units—a negative surprise.
ConsumerWhat a Building Permit Bounce Means for the Housing Market
The number of building permits issued in June 2017 stood at 1.25 million, an improvement from May’s 1.17 million.
Company & Industry OverviewsD.R. Horton Was the S&P 500’s Top Gainer on July 7
D.R. Horton, one of the largest home construction companies in the US, rose on Friday. Homebuilders rose with D.R. Horton leading the rally.
Macroeconomic AnalysisWhy Eric Rosengren Is Worried about US Unemployment Rate
Eric Rosengren, president of the Federal Reserve Bank of Boston, warned about the jobless rate being below the natural full employment estimate of 4.7%.
Company & Industry OverviewsCould Equity Valuations Pick Up in a Lower Interest Rate Environment?
According to Morgan Stanley Private Wealth Management’s Andy Chase, long-term fundamentals look strong with the recent pickup in economic activity.
Macroeconomic AnalysisSeptember 2016 Projections: US GDP Growth and Unemployment
FOMC (Federal Open Market Committee) participants have toned down their projections for US GDP growth in 2016 for the second successive quarter.
ConsumerHomebuilder Sentiment Improved in August
The NAHB Wells Fargo Housing Market Index, which measures homebuilder sentiment, peaked at 71 during the height of the housing bubble in late 2005. It bottomed out at 8 in early 2009.
ConsumerDid Housing Starts Rise Again in July?
In July, the Northeast saw housing starts jump from 116,000 to 134,000, while starts rose from 171,000 to 175,000 in the Midwest.
ConsumerWhy Did Foreclosure Completions Rise in June?
In June, the total foreclosure inventory fell 26% from a year ago to 375,000 homes. This works out to be about 1% of all homes with mortgages.
ConsumerJob Cuts Rose in July but Fell Sharply on an Annual Basis
Planned job cuts rose 19% in July compared to June. However, they fell 57% YoY (year-over-year) in July.
ConsumerConstruction Spending Fell in June
In June 2016, private construction fell 0.6%, and public construction fell 0.6% month-over-month.
ConsumerFor Now, D.R. Horton Avoids Fallout from Declining Energy Prices
D.R. Horton (DHI) reported net income of $294.8 million, or $0.66 per share, for 3Q16.
ConsumerWhy Many Homeowners Think It’s a Good Time to Sell
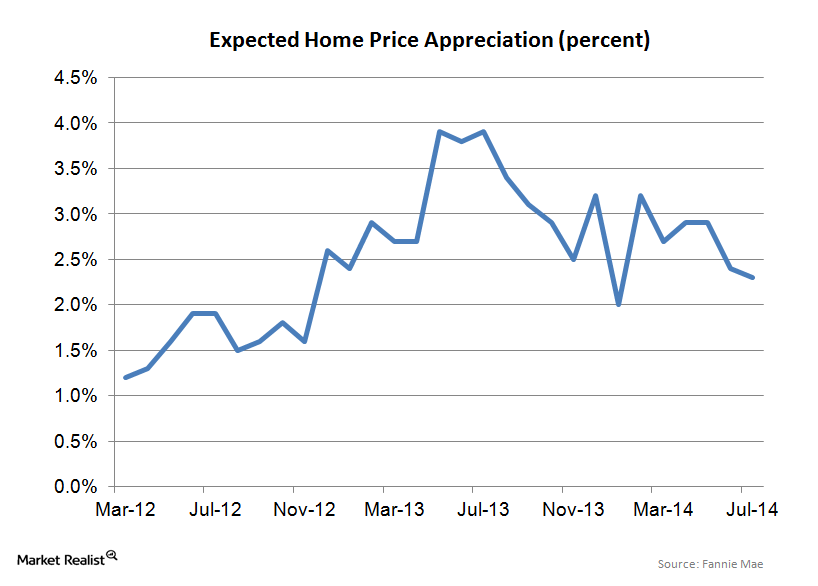
Fannie Mae’s monthly National Housing Survey asked respondents if it’s a good time to buy and sell a house. They’re more confident that it’s a good time to sell.
ConsumerHomebuilder Earnings and Housing Data on Tap this Week
This week is relatively data-light. However, a slew of reports will interest real estate investors.
ConsumerWhy Wage Inflation Could Be Picking Up
Given the terrible growth in payrolls, we might see more flattening of wage inflation back towards the current inflation rate.
ConsumerJune Payrolls Rebound after a Dismal May
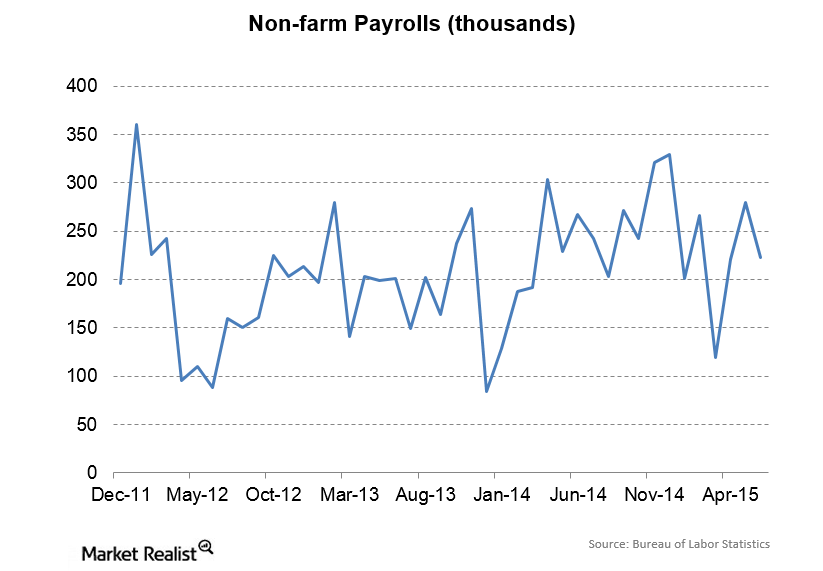
In June 2016, non-farm payrolls rose by 287,000. Non-farm payrolls easily topped Wall Street analysts’ estimate of 180,000.
ConsumerMortgage Purchase Applications Fell Last Week
Mortgage purchase applications fell 3% in the week ending June 24, 2016. We’re at the tail end of the seasonally strong period for house purchases.
Earnings ReportKB Home Just Reported Strong Revenue Growth for 2Q16
For 2Q16, KB Home reported revenues of $811 million, which easily topped the Wall Street estimate consensus of $750 million. Revenues increased by 30% YoY.
Earnings ReportLennar’s Gross Margin Falls, but Guidance Remains for 2016
In 2Q16, Lennar’s (LEN) gross margin rose 40 basis points sequentially to 23.1%. In 2Q15, the company’s gross margin was 23.8%.
Macroeconomic AnalysisMay Payrolls Were Exceptionally Weak
In May 2016, non-farm payrolls rose by 38,000, which missed Wall Street analysts’ estimate of 160,000 by a wide margin.
Macroeconomic AnalysisAverage Hourly Earnings Rose in May
Aside from employment, the most important indicator of economic well-being is wages.
Macroeconomic AnalysisDo US Economic Indicators Support a Rate Hike?
US economic growth was revised to 0.8% in the second reading of GDP for 1Q16 compared to the previous month’s 0.5%.
Company & Industry OverviewsUS Stock Indexes Rose as the US Economy Recovered
Upbeat new home sales data boosted investors’ sentiments about US economic recovery, causing US equity indexes to rise from May 17 to May 24, 2016.
Earnings ReportGeographic Results for Toll Brothers in Fiscal 2Q16
In Toll Brothers’ North segment, the ASP (average selling price) rose from $630,000 to $705,000 in fiscal 2Q16.
Earnings ReportDid Toll Brothers’ Earnings per Share Rise in Fiscal 2Q16?
After Toll Brothers reported fiscal 2Q16 earnings on May 24, 2016, its stock rose by $2.41 to close the day at $29.51.
Earnings ReportIs Pricing Growth Stalling for Toll Brothers?
Toll Brothers (TOL) reported that its ASP (average selling price) for fiscal 2Q16 was $855,500, a drop of 2% on a quarter-over-quarter basis.
Macroeconomic AnalysisBehind Homebuilder Sentiment So Far in May
The NAHB Wells Fargo Housing Market Index measures homebuilder sentiment has been increasing steadily since 2009. Recently, it’s started to accelerate.
Macroeconomic AnalysisGood News! Job Openings Rose in March
In March 2016, there were 5.8 million job openings—up 9% YoY. The number of job openings came in well above Wall Street analysts’ estimates.
Company & Industry OverviewsAnalyzing the New Deal: Do We Need a New One?
Historically, the use of public construction dollars has been the big lever that the government uses to stimulate the economy. This dates back to the New Deal.
Macroeconomic AnalysisWhere’s the First-Time Homebuyer?
In March, the share of existing home sales attributable to the first-time homebuyer was 30%—flat with February. Historically, this was closer to 40%.
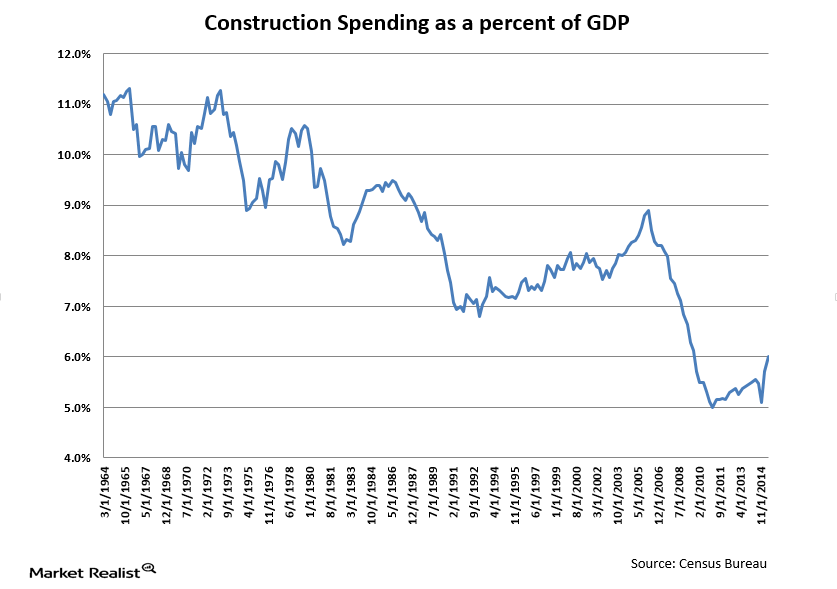
Macroeconomic AnalysisConstruction Spending Rose in March: What Does It Mean?
Construction spending rose to a seasonally adjusted annual rate of $1.14 trillion in March from $1.13 trillion in February. Spending rose 8% YoY.
Earnings ReportD.R. Horton Reported Steady Gross Margins
D.R. Horton (DHI) has been reporting lower gross margins due to sticker shock. Home prices have been increasing, but wage growth has been stagnant.
Earnings ReportAnalyzing D.R. Horton’s 2Q16 Revenue: It’s a Strong Start!
D.R. Horton reported 2Q16 revenue of $2.7 billion—a 16% increase on a YoY basis and a sequential increase of ~14%. The revenue beat analysts’ expectations.
Earnings ReportWhy PulteGroup’s Founder Wants to Fire the CEO and Lead Director
Over time, Pulte has lifted its gross margins and improved revenues. However, the stock has still lagged its peers, especially the S&P SPDR Homebuilder ETF (XHB).
Macroeconomic AnalysisWhy Did the First-Time Homebuyer Step Back in February?
In February, the share of existing home sales attributable to the first-time homebuyer was 30%—down 2 percentage points from January and up 1% YoY.
Macroeconomic AnalysisWages Are Increasing 2.3% per Year: What Does That Mean?
Employment and wages are key indicators for the Fed Aside from employment, the most important indicator of economic well-being is wages. Despite falling unemployment, one of the conundrums facing the current labor market is flat real or inflation-adjusted wages. Over the past decade, wages have more or less kept pace with inflation, but they haven’t increased. Before the financial crisis, much of […]
Macroeconomic AnalysisHousing Starts Rise as the Spring Selling Season Begins
Housing starts rose from 1.12 million to ~1.18 million in February 2016. This was above Wall Street analysts’ estimates of 1.5 million.
Macroeconomic AnalysisForeclosure Completions Ticked Up Slightly in January
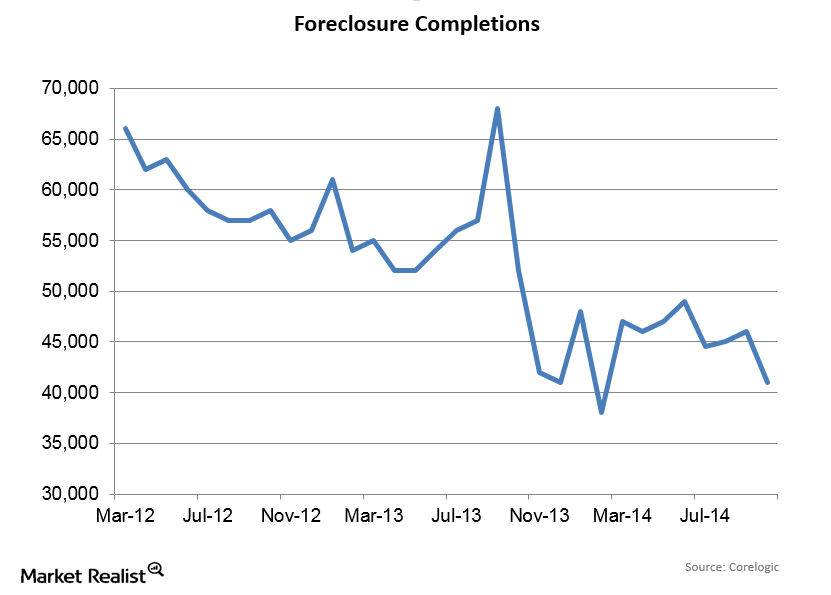
Foreclosure completions rose by 5,000 units to 38,000 in January, according to CoreLogic. From 2000 to 2006, foreclosure completions averaged around 21,000 per month.
Macroeconomic AnalysisWhat’s the Fannie Mae National Housing Survey?
Fannie Mae puts out its monthly National Housing Survey. It measures consumers’ attitudes about housing and the economy.
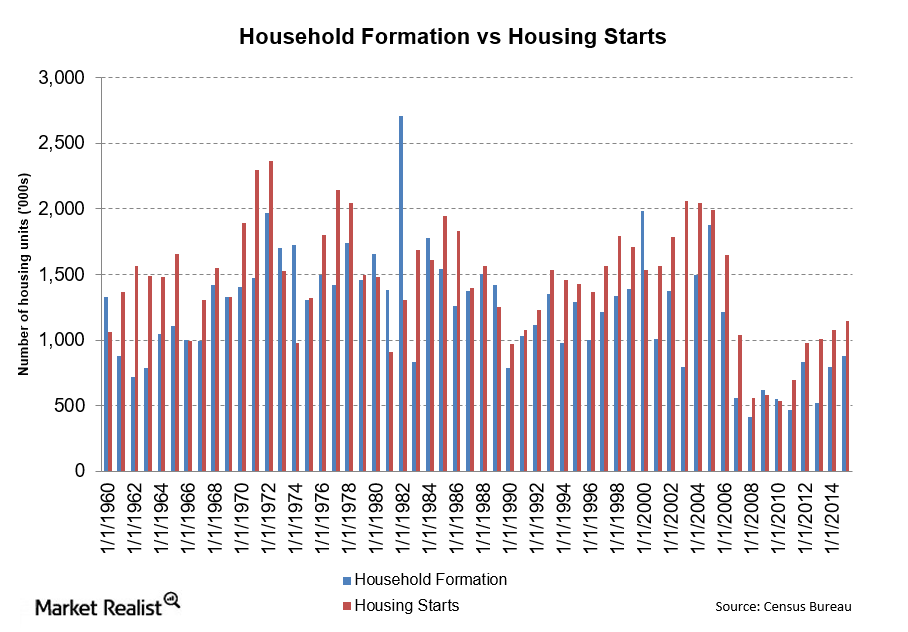
Macroeconomic AnalysisLimited Supply: Analyzing Housing Starts and Household Formations
There was a big fall in household formation in 2008. In 2005, household formation peaked at 1.9 million. By 2008, that number was just over 400 million.
Macroeconomic AnalysisExisting Home Sales Were Flat in January: Here’s Why
The ratio of median home prices to median income ratio is 3.9x, well above the historical range of 3.2x to 3.6x.
Company & Industry OverviewsTreasury Yields Rise on Upbeat Consumer Inflation Data
US Treasury yields rose across the yield curve after upbeat consumer inflation data suggested that the Fed may hike interest rates earlier than expected.
Macroeconomic AnalysisIs It Done Yet? Foreclosure Inventory at November 2007 Levels
Foreclosure completions fell by 1,000 units to 32,000 in December. Completions fell 23% year-over-year. However, 33,000 is still a relatively high number.
Company & Industry OverviewsTreasury Yields Fall on Bank of Japan’s Negative Interest Rates
Treasury yields fell across the yield curve, except for three-month, six-month, and one-year Treasury bills, after the Bank of Japan introduced a negative interest rate.
Earnings ReportPulteGroup Saw an Increase in 4Q15 Gross Margins
PulteGroup’s (PHM) gross margins for 4Q15 came in at 23.5%, up 40 basis points on a year-over-year basis and down ten basis points from the third quarter.
Macroeconomic AnalysisPending Home Sales Rose Annually, but They’re Falling Monthly
According to the National Association of Realtors, US pending home sales rose marginally at 0.1% in December versus a 1.1% fall in November 2015.
Macroeconomic AnalysisProperties for Sale: What Are They Like?
The National Association of Realtors’ data showed that, on average, properties stayed on the market for 58 days before they were sold to buyers.
Macroeconomic AnalysisMedian Existing Home Prices Are Rising Higher and Higher
With a rise of 7.6% YoY (year-over-year) to $224,000, December 2015 was the 46th consecutive month of YoY increases in median home prices.
Macroeconomic AnalysisExisting Home Sales: Northeast and Midwest Led the Charge
All four major regions of the country witnessed substantial increases in home sales in December 2015. The charge was led by the Northeast and Midwest.
Earnings ReportD.R. Horton Updated Its Guidance for 2016
D.R. Horton (DHI) sounded relatively optimistic on its conference call. It was clearly happy with the most recent quarter despite the stock price reaction.
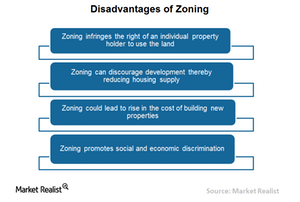
Macroeconomic AnalysisHow Zoning Can Be a Hindrance to Housing Market Growth
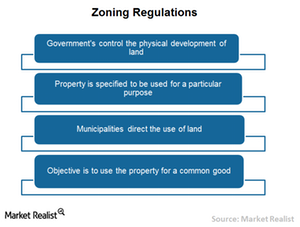
Zoning restricts the freedom of property holders and REITs to use land however they want, given their specific development and investment interests.
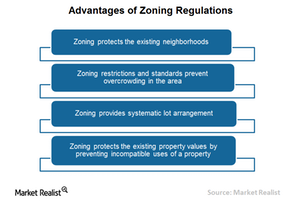
Macroeconomic AnalysisHow Zoning Regulations Benefit Communities
Zoning protects existing property values by preventing incompatible uses of a property. It also protects residential properties from commercial development.
Macroeconomic AnalysisHow Zoning Regulations Impact City Development
Zoning is the way that governments supervise land development and the kinds of uses each individual property may be directed toward for the public interest.
Macroeconomic AnalysisWhat Are the Factors Driving Housing Affordability?
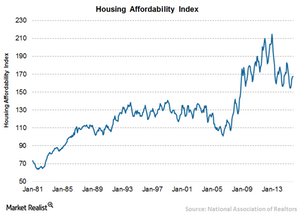
Housing affordability took a beating in July 2015 after reaching its high in January 2013. The higher ratio of the home affordability index signifies relatively higher home affordability to buyers.
Macroeconomic AnalysisWhy Housing Affordability Is a Growing Concern in the US
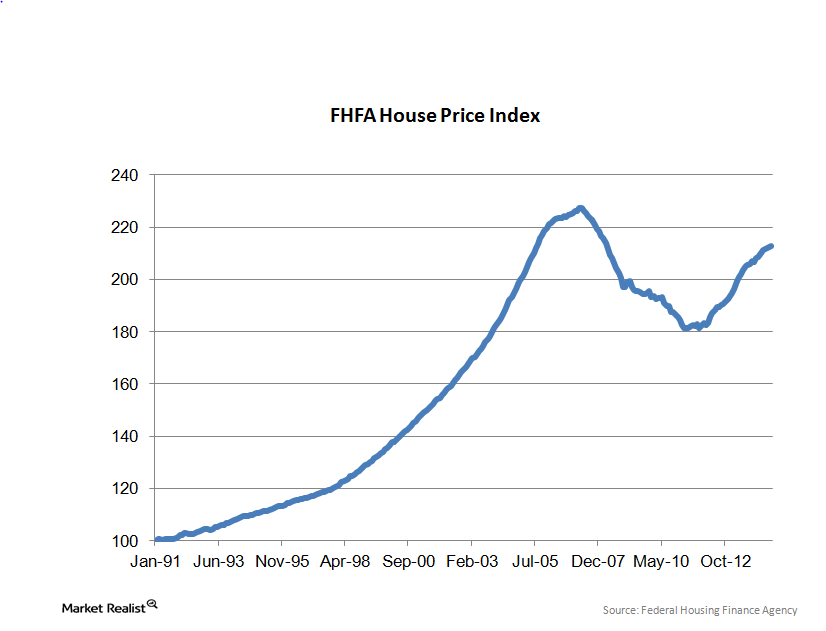
With the rise in property prices, housing affordability has become a growing concern in many markets of the country. High housing prices force people to the suburbs and rural towns to find affordable housing.
Macroeconomic AnalysisThe US Dollar Index Was Flat after a Mixed Data Release
The US dollar index was trading on a flattish note on January 20, with a slight rise of 0.10% for the day. In the end, the index closed the day at 99.09.
Macroeconomic AnalysisHome Prices are Rising, but Not Home Sales—Why?
A home is usually the most expensive asset that consumers can hold, and owning a home is among their lifetime goals. The question arises—why can’t more people own a house despite the availability of so many properties in the market?
Macroeconomic AnalysisForeclosure Completions Fell in November: What Does It Mean?
Foreclosure completions fell by 4,000 units to 33,000 in November, according to CoreLogic. Completions fell 19% YoY (year-over-year).
Macroeconomic AnalysisWages Dipped Slightly in December: Here’s Why
Average hourly earnings fell by 1 cent on a month-over-month basis in December 2015 and were up 2.5% year-over-year to $25.24. Average weekly hours were flat at 34.5.
Macroeconomic AnalysisLabor Market Ended 2015 with Strong Payroll Growth in December
In December 2015, non-farm payrolls increased by 292,000, easily topping Wall Street’s estimate of 200,000.
Company & Industry OverviewsTreasury Yields Were Mixed amid Oil Price Volatility
Treasury yields rose across the yield curve—except for one-month T-bills, three-month T-bills, and three-year T-notes—in the week ending December 31.
Macroeconomic AnalysisPositioning Your Portfolio in the Rising Rate Environment
Sectors with companies that usually have a high level of debt such as utilities and telecommunications are the most affected by rate hikes.
Macroeconomic AnalysisBuilder Confidence Slipped in December 2015
The NAHB Wells Fargo Housing Market Index measures builder confidence, gauging how builders view current and future sales of single-family residences. It asks builders to characterize sales as good, fair, or poor.
Macroeconomic AnalysisUS Dollar Index Fell, GDP Revised Down
The US Dollar Index measures the strength of the US dollar against the other major currencies. It fell by 0.13% on December 22, 2015.
Macroeconomic AnalysisWhat Does the Future Hold for Mortgage REITs?
US markets and investors might have taken the Fed’s interest rate hike positively, but it’s important to explore the future outlook of mortgage REITs.
Earnings ReportHow Does Lennar Compare to Its Peers?
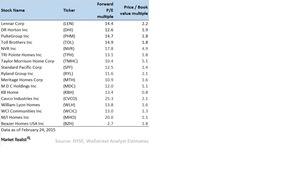
Lennar showed mixed results compared to its peers based on the PE and PBV ratios. The ETFs outperformed Lennar based on the PE and PBV ratios.
Company & Industry OverviewsTreasury Yield Curve Flattened after US Interest Rate Hike
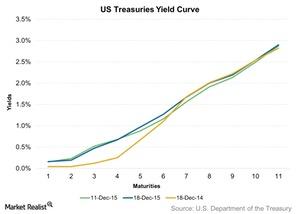
The US Treasury yield curve was flat for the week ended December 18, 2015, as short-term yields fell. Medium- to long-term yields rose after US interest rates rose by 25 basis points.
Earnings ReportAnalyzing Lennar’s EPS and Balance Sheet
Lennar (LEN) reported net earnings of $281.6 million, or $1.21 per share—compared to its net income of $245.3 million, or $1.07 per share, a year ago.
Macroeconomic AnalysisDecember’s Housing Market Saw a Drop in Buyer Traffic
According to the National Association of Home Builders (or NAHB), the housing market index fell by a single point to reach a level of 61.0 in December.
Earnings ReportHow Does Toll Brothers Compare to Its Peers?
The price-to-sales ratios of Toll Brothers, D.R. Horton, NVR, PulteGroup, and M.D.C. Holdings are 1.5x, 1.1x, 1.3x, 1.1x, and 0.68x, respectively.
Earnings ReportToll Brothers’ Gross Margins Fall on a Year-over-Year Basis
In the fourth quarter of 2015, Toll Brothers’ (TOL) gross margins, excluding interest and write-downs, fell to 22.3% compared to 26.8% a year ago.
Macroeconomic AnalysisUS Dollar Index Is Holding Steady
The US Dollar index was trading in a narrow range on November 18, 2015. The slight movements down were mainly due to housing data coming out on a mixed note and the FOMC minutes.
Earnings ReportD.R. Horton Maintained Its Gross Margins
D.R. Horton’s gross margins held steady at 19.9% in the fourth quarter of 2015. However, they fell on a YoY (year-over-year) basis from 20.5% in the fourth quarter of 2014.
Macroeconomic AnalysisWage Growth Could Be Picking Up
Average hourly earnings rose by 9 cents on a month-over-month basis in October and were up 2.4% YoY (year-over-year) to $25.20. However, wage growth is still barely outpacing inflation.
Macroeconomic AnalysisOctober Non-Farm Payrolls Came in Strong and Bonds Sold Off
In October, non-farm payrolls increased by 271,000, easily topping the Wall Street estimate of 185,000.
Macroeconomic AnalysisJobs Report Will Be the Highlight of the Week
This week, REITs such as Annaly Capital Management (NLY) and American Capital Agency (AGNC) will focus almost exclusively on the jobs report and NLY’s earnings.
Earnings ReportPulteGroup’s Valuation Is Not Expected to Improve Dramatically
PulteGroup’s valuation is not expected to improve dramatically from here unless the company shows some improvement in its finances.
Macroeconomic AnalysisHousing Starts Increased in September to Just over 1.2 Million
Housing starts rose from a downward-revised ~1.13 million to ~1.21 million in September 2015. This was above Wall Street estimates of just over 1.14 million.
Earnings ReportHow Has NVR Performed Compared to Its Peers?
The price-to-earnings ratios of NVR, D.R. Horton, PulteGroup, M.D.C. Holdings, and HFF are 21.17x, 16.91x, 13.77x, 24.16x, and 18.75x, respectively.
Earnings ReportOrganic Growth Boosts NVR’s Revenue
NVR rose by 2.3% to close at $1,590 per share as of October 20, 2015, its year-to-date price movement at 24.7%.
Macroeconomic AnalysisUS Dollar Index Flat after Mixed Housing Data
The US dollar index was trading flat for the day on October 20, 2015. The day saw the housing starts come out above forecasts, and September’s building permits came out below expectations.
Macroeconomic AnalysisIncreased Expectations Will Likely Boost Housing Demand
According to the National Association of Home Builders (or NAHB), the housing market index (or HMI) rose to 64 in October as compared to 61 in September 2015.
Macroeconomic AnalysisWhy Mortgage Applications Fell after a Spike on October 9
A week after the implementation of a regulatory change, mortgage applications fell 27.6% for the week ending October 9 as against an increase of 25.5% in the previous week.
Macroeconomic AnalysisMortgage Applications Increased Prior to Regulatory Change
Mortgage applications increased 25.5% for the week ending October 2, 2015 against a decrease of -6.7% in the previous week.
Macroeconomic AnalysisNon-Farm Payrolls Miss Estimates by a Large Margin
In September, non-farm payrolls increased by 142,000, missing the Wall Street estimate of 200,000. Private payrolls increased by 118,000, while government jobs rose by 24,000.
Macroeconomic AnalysisA Closer Look at the August 15 Drop in Housing Starts
Housing starts fell from a downward-revised ~1.16 million to ~1.13 million in August 2015. This was below Wall Street estimates of just over 1.16 million.
Earnings ReportOrganic Growth Boosts KB Home’s Revenue
KB Home (KBH) has a market cap of $1.34 billion. After the earnings report in 3Q15, KB Home rose by 1.04% to close at $14.60 per share.
Earnings ReportNew Homes Boost Lennar’s Performance
Lennar (LEN) has a market cap of $10.36 billion. Lennar’s YTD (year-to-date) price movement has a mixed performance with ups and downs.