
Gabriel Kane
Disclosure: I am in full compliance with all ethics and other policies for Market Realist research analysts. I am not invested in securities that I cover on Market Realist.
More From Gabriel Kane
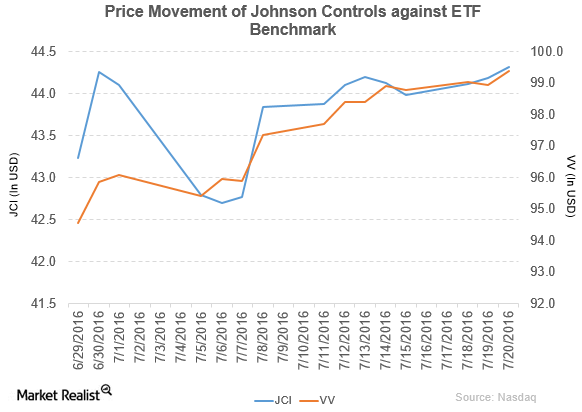
Johnson Controls Declares $0.29 Per Share Dividend
Johnson Controls (JCI) has a market cap of $28.8 billion. It rose by 0.29% to close at $44.32 per share on July 20, 2016.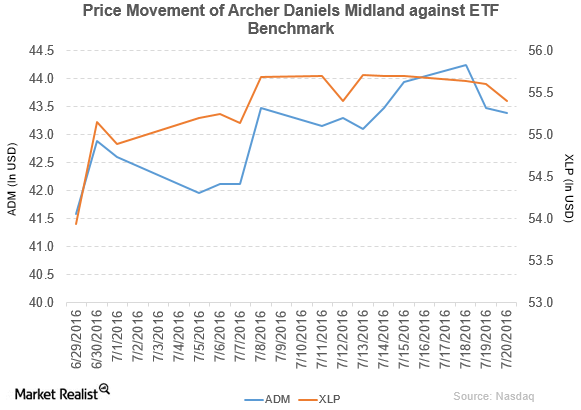
Why Horse Owners Are Suing Archer-Daniels Midland
Archer-Daniels Midland (ADM) has a market cap of $25.2 billion. It fell by 0.21% to close at $43.39 per share on July 20, 2016.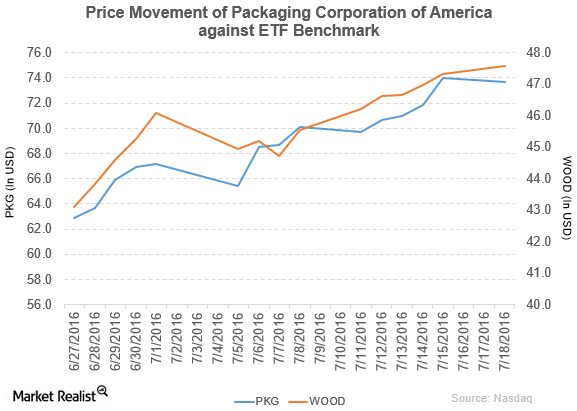
Buckingham Research Downgrades Packaging Corporation of America to ‘Neutral’
Its net income and EPS (earnings per share) rose to $102.6 million and $1.09, respectively, in 1Q16, as compared to $89.6 million and $0.92, respectively, in 1Q15.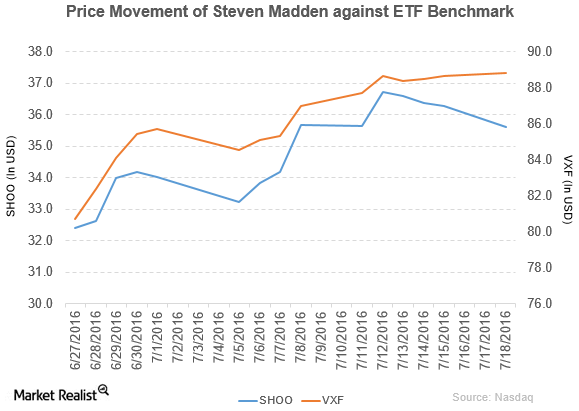
Buckingham Research Downgrades Steven Madden to ‘Neutral’
Steven Madden (SHOO) has a market cap of $2.2 billion. It fell by 1.9% to close at $35.60 per share on July 18, 2016.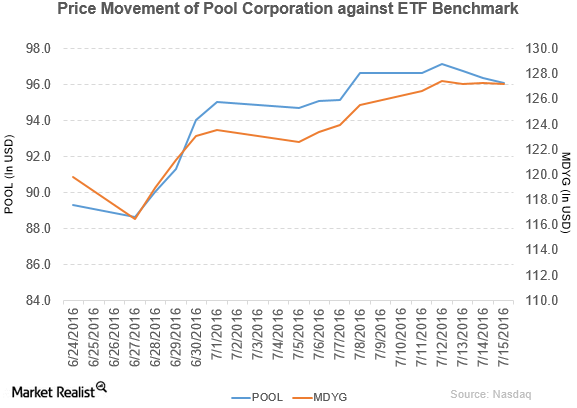
Johnson Rice Downgrades Pool Corporation to ‘Accumulate’
Pool Corporation fell by 0.27% to close at $96.10 per share on July 15. Its weekly, monthly, and YTD price movements were -0.59%, 6.6%, and 19.8%.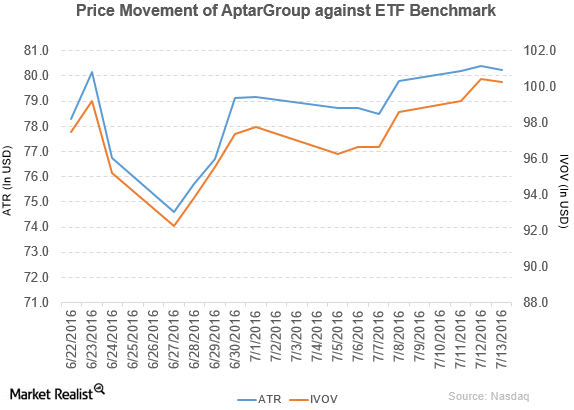
AptarGroup Declares Quarterly Dividend of $0.30 Per Share
AptarGroup (ATR) has a market cap of $5.0 billion. It fell by 0.22% to close at $80.23 per share on July 13, 2016.
Goodyear Tire & Rubber Declares Dividend of $0.07 Per Share
Goodyear Tire & Rubber Company (GT) has a market cap of $7.1 billion.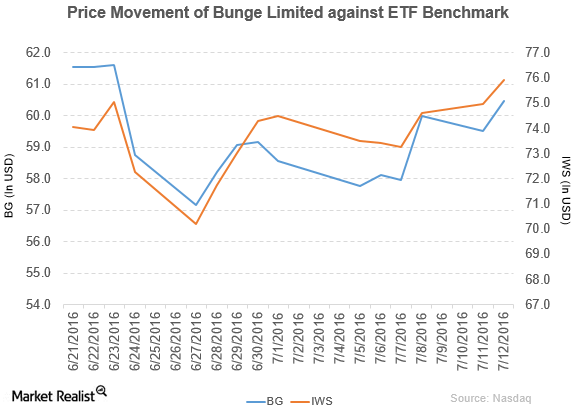
BB&T Capital Rated Bunge a ‘Buy’
Bunge reported 1Q16 net sales of $8.9 billion, a decline of 17.5% compared to net sales of $10.8 billion in 1Q15.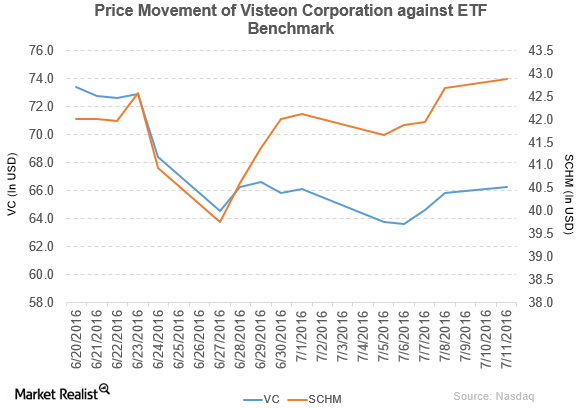
Visteon Acquires AllGo Embedded Systems
Visteon (VC) has a market cap of $2.5 billion. It rose by 0.59% to close at $66.23 per share on July 11, 2016.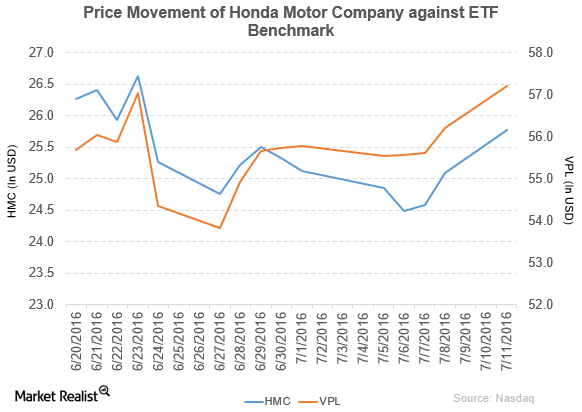
Why Did Honda Motor’s Stock Rise ~3% on July 11?
Honda Motor (HMC) has a market cap of $45.2 billion. It rose by 2.8% to close at $25.78 per share on July 11, 2016.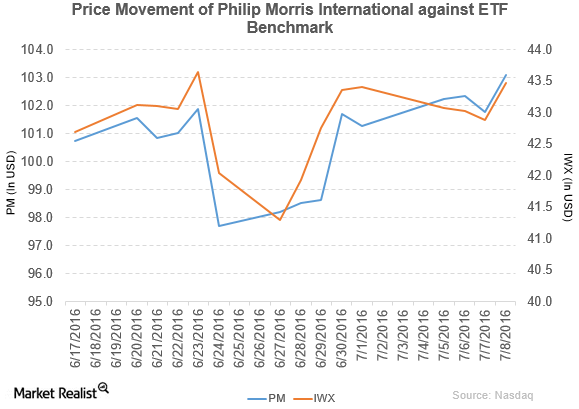
ICSID Dismisses Philip Morris’s Lawsuit against Uruguay
Philip Morris International (PM) has a market cap of $160.6 billion. Its stock rose by 1.3% to close at $103.09 per share on July 8, 2016.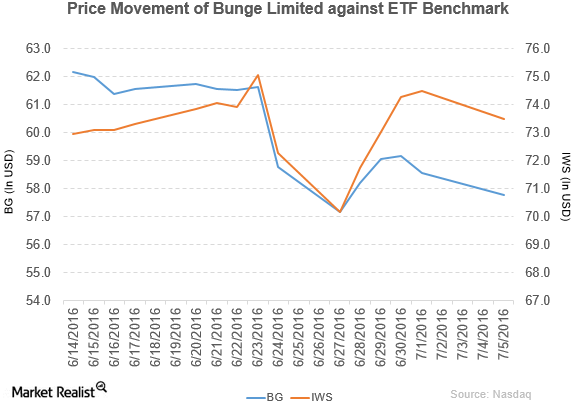
Bunge and Wilmar Form Joint Venture to Increase Market Share
Bunge Limited (BG) has a market cap of $8.2 billion. Its stock fell by 1.4% to close at $57.76 per share on July 5, 2016.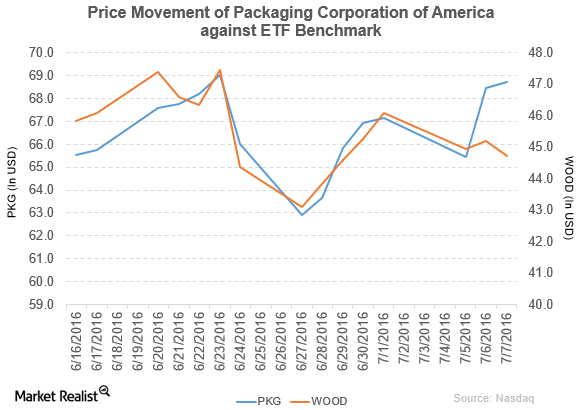
Moody’s Says PKG’s TimBar Acquisition Is Credit Positive
Packaging Corporation of America rose by 0.34% to close at $68.71 per share on July 7. Its weekly, monthly, and YTD movements were 4.3%, -2.6%, and 11.0%.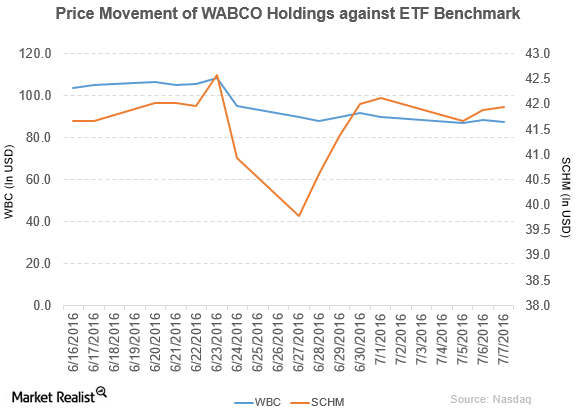
Bank of America-Merrill Lynch Downgrades WABCO to ‘Neutral’
WABCO Holdings fell by 1.3% to close at $87.26 per share on July 7. The stock’s weekly, monthly, and YTD price movements were -2.7%, -20.3%, and -14.7%.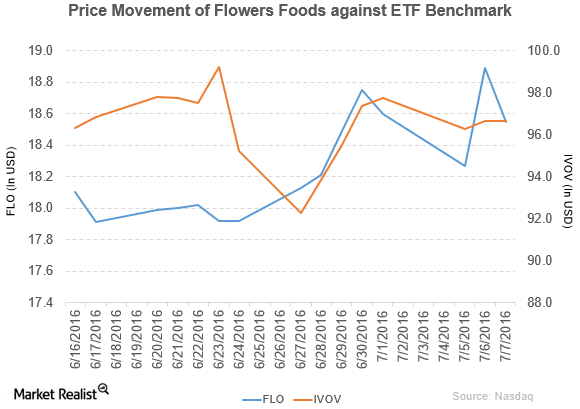
Flowers Foods Made Changes in Its Management
Flowers Foods fell by 1.8% to close at $18.55 per share on July 7. The stock’s weekly, monthly, and YTD price movements were 0.32%, 0.32%, and -12.2%.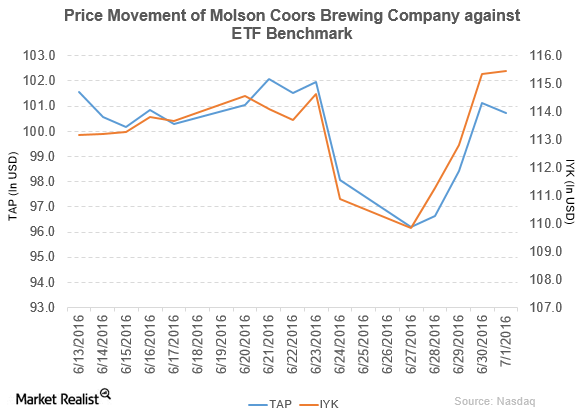
Moody’s Downgrades Molson Coors’ Senior Notes to ‘Baa3’
Molson Coors Brewing (TAP) rose by 2.7% to close at $100.74 per share at the end of the fifth week of June 2016.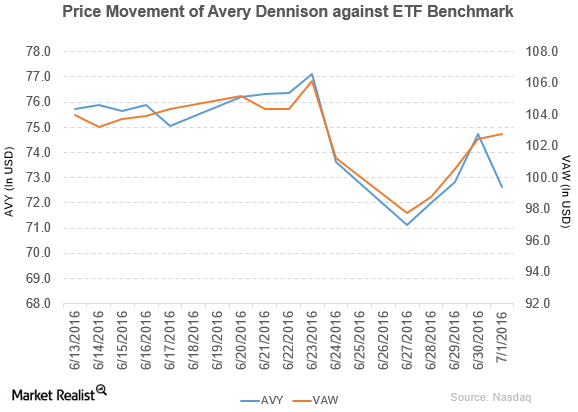
Bank of America Merrill Lynch Downgrades Avery Dennison
Avery Dennison (AVY) has a market capitalization of $6.5 billion. It fell by 2.9% to close at $72.62 per share on July 1, 2016.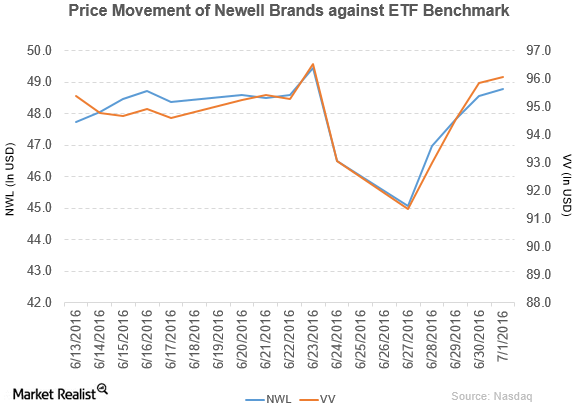
Newell Brands Sold Its Brands to Hunter Douglas
Newell Brands (NWL) has a market capitalization of $24.0 billion. It rose by 0.43% to close at $48.78 per share on July 1, 2016.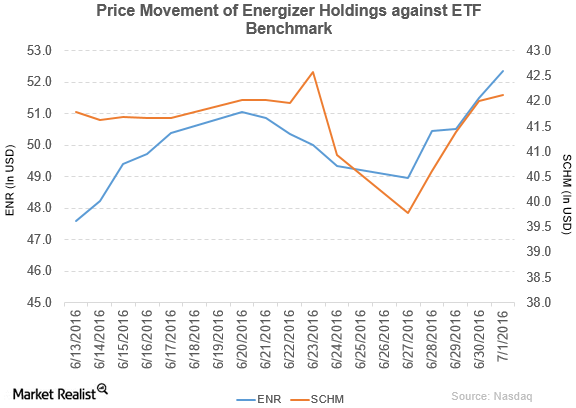
Energizer Holdings Acquired HandStands Holding for $340 Million
Energizer Holdings (ENR) has a market capitalization of $3.2 billion. It rose by 1.7% to close at $52.35 per share on July 1, 2016.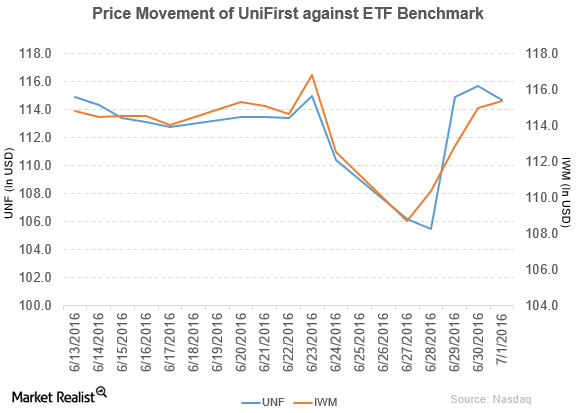
Robert W. Baird Downgrades UniFirst to a ‘Neutral’
UniFirst Corporation (UNF) has a market capitalization of $2.3 billion. It fell by 0.86% to close at $114.73 per share on July 1, 2016.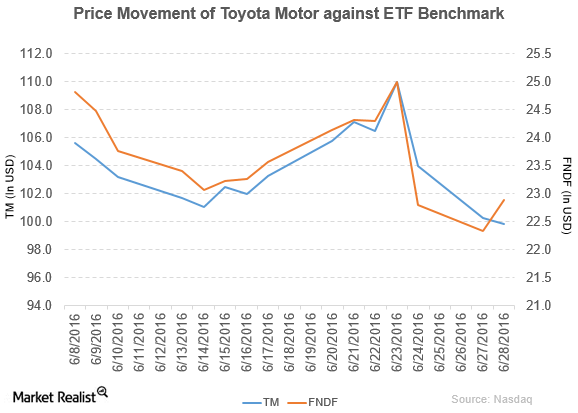
Why Did Toyota Motor Recall Its Vehicles?
Toyota Motor (TM) has a market cap of $158.3 billion. It fell 0.41% to close at $99.85 per share on June 28.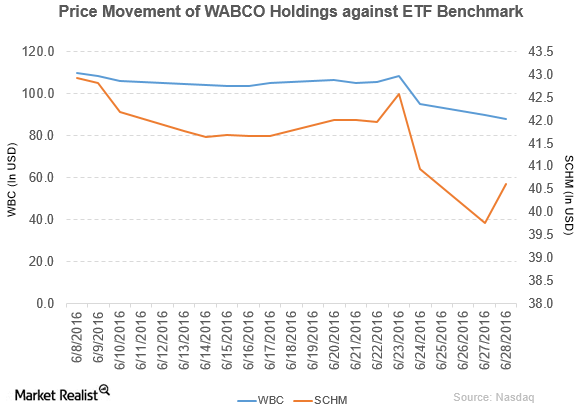
Why Goldman Sachs and Piper Jaffray Downgraded WABCO to ‘Neutral’
WABCO Holdings (WBC) has a market cap of $5.0 billion. It fell 2.0% to close at $88.07 per share on June 28.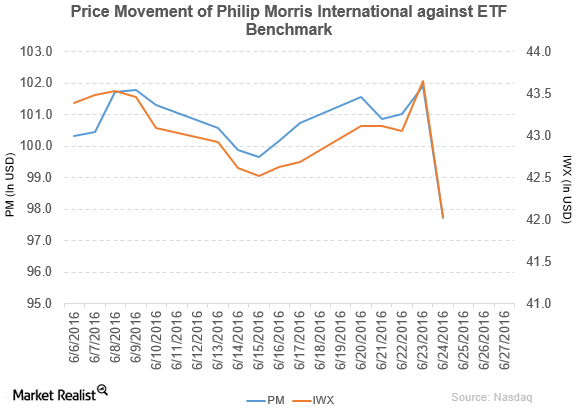
Why Did Philip Morris Fall 4% on June 24?
Philip Morris International (PM) has a market cap of $151.6 billion. It fell by 4.1% to close at $97.71 per share on June 24, 2016.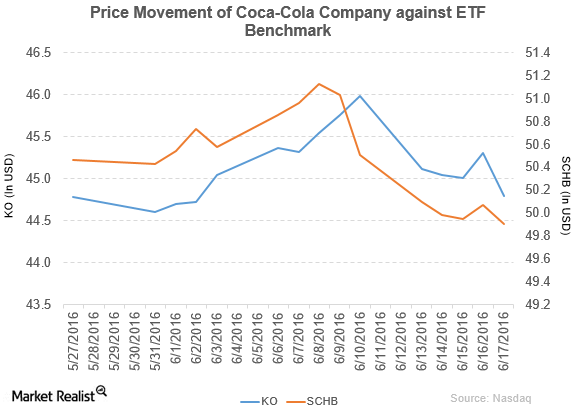
Why Did The Coca-Cola Company Fall on June 17?
The Coca-Cola Company (KO) has a market cap of $192.8 billion. It fell by 1.2% to close at $44.79 per share on June 17, 2016.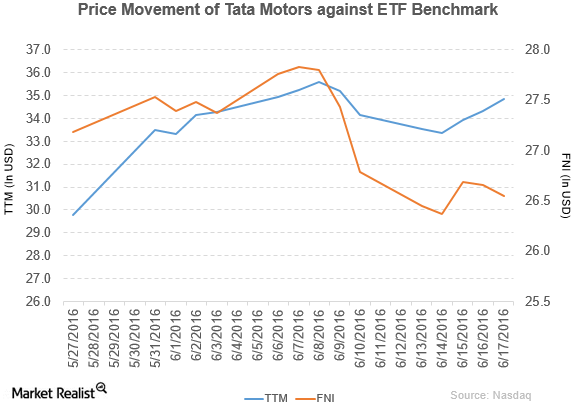
Tata Motors Opened New Plant in Brazil to Increase Profitability
Tata Motors Limited-ADR (TTM) rose by 2.1% to close at $34.83 per share at the end of the third week of June 2016.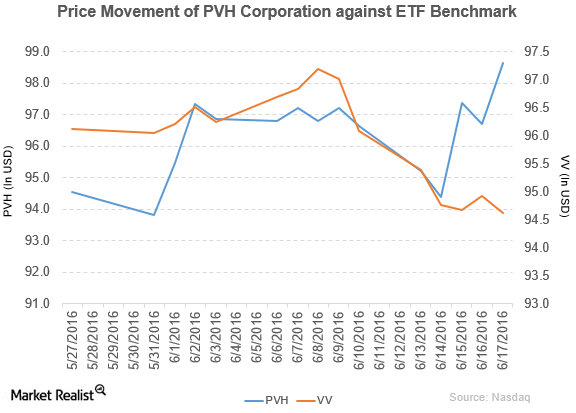
Why Did PVH Issue Senior Notes?
PVH (PVH) rose by 2.1% to close at $98.63 per share at the end of the third week of June 2016.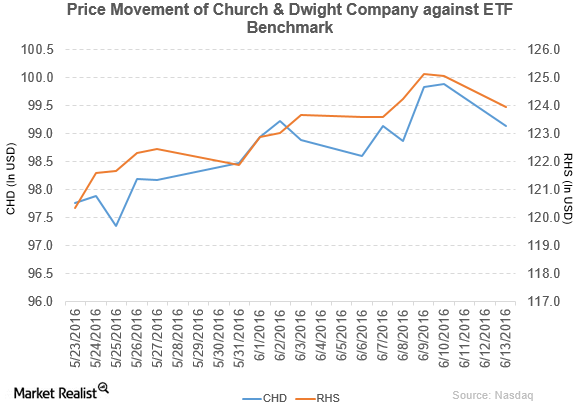
Why Church & Dwight Sold Its Brands to Armaly Brands
Church & Dwight (CHD) has a market cap of $12.7 billion. It fell by 0.74% to close at $99.14 per share on June 13, 2016.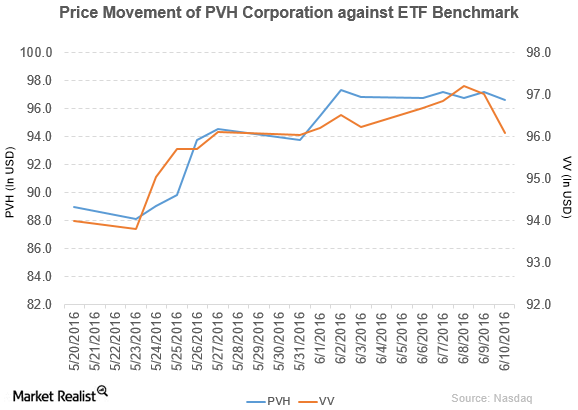
Why Did PVH Offer Senior Notes?
PVH Corporation (PVH) has a market cap of $7.8 billion. It fell by 0.58% to close at $96.65 per share on June 10, 2016.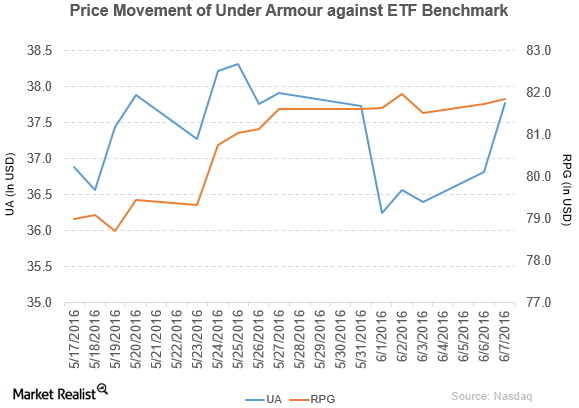
What Boosted Under Armour on June 7?
Under Armour rose by 2.6% to close at $37.77 per share on June 7. Its weekly, monthly, and YTD price movements were 0.11%, -2.4%, and -6.3%, respectively.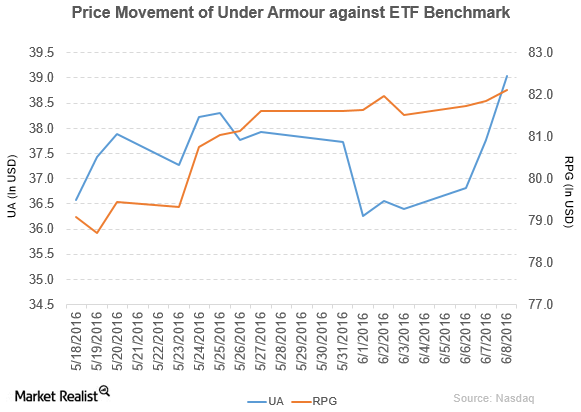
What Drove Under Armour’s Rise on June 8?
Under Armour (UA) has a market cap of $7.1 billion. It rose by 3.4% to close at $39.04 per share on June 8, 2016.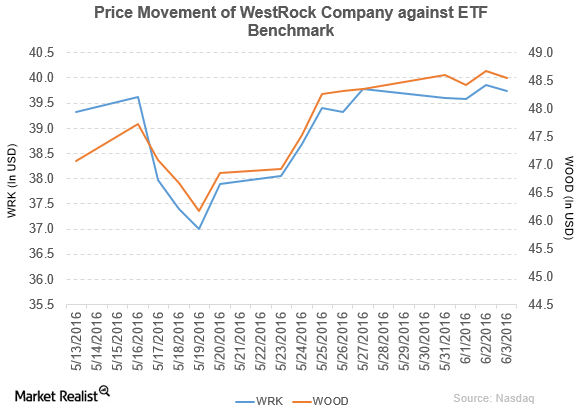
Moody’s Upgrades WestRock’s Rating to Baa2
WestRock’s (WRK) stock fell by 0.10% to close at $39.74 per share in the first week of June 2016.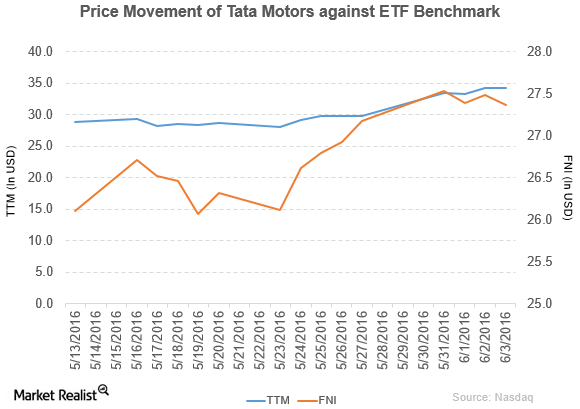
The Reason behind Tata Motors’ Complaint against Jiangling Motors
Price movement of Tata Motors Tata Motors (TTM) has a market cap of $22.1 billion. It rose by 0.32% to close at $34.28 per share on June 3, 2016. The stock’s weekly, monthly, and year-to-date (or YTD) price movements were 15.3%, 20.8%, and 16.3%, respectively, as of the same day. This means that TTM is […]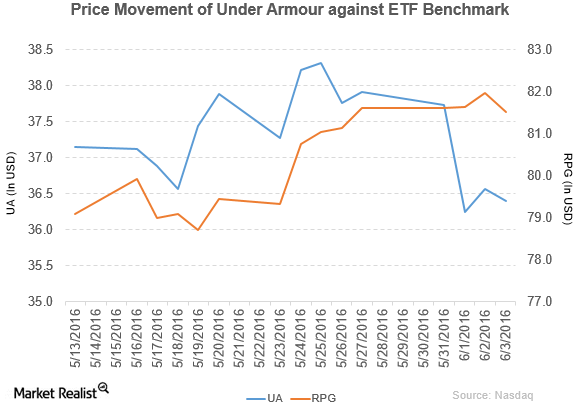
Under Armour Has Declared a Dividend for Its Class C Stock
Under Armour (UA) has a market cap of $6.7 billion. It fell by 0.44% to close at $36.40 per share on June 3, 2016.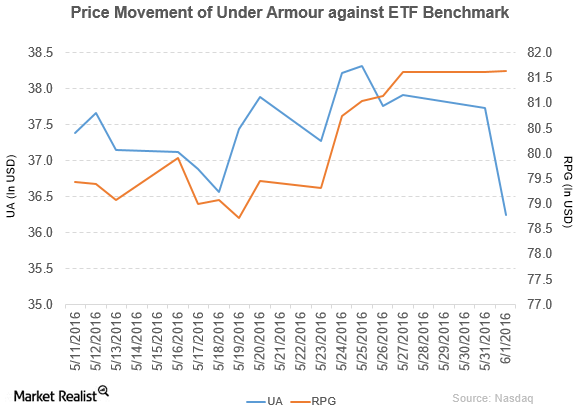
Under Armour Saw Its Price Target after Its Revised Outlook
Under Armour (UA) has a market cap of $6.6 billion. It fell by 3.9% to close at $36.25 per share on June 1, 2016.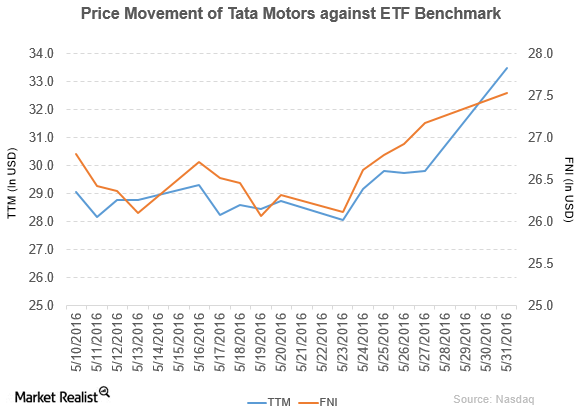
Why Tata Motors’ Top and Bottom Lines Rose in Fiscal 4Q16
Tata Motors (TTM) has a market capitalization of $21.6 billion. It rose by 12.4% to close at $33.49 per share on May 31, 2016.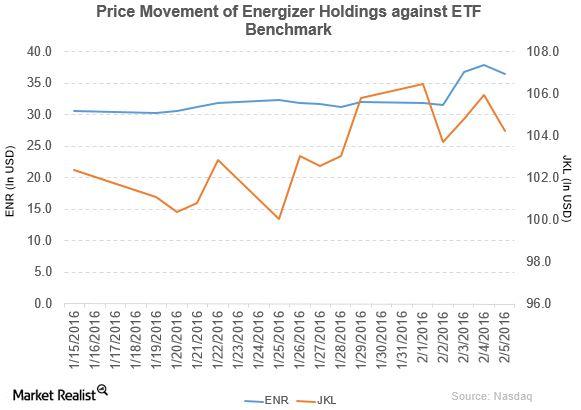
Energizer Revenue and Income Rose in Fiscal 1Q16
Energizer Holdings (ENR) rose by 13.7% to close at $36.43 per share at the end of the first week of February 2016.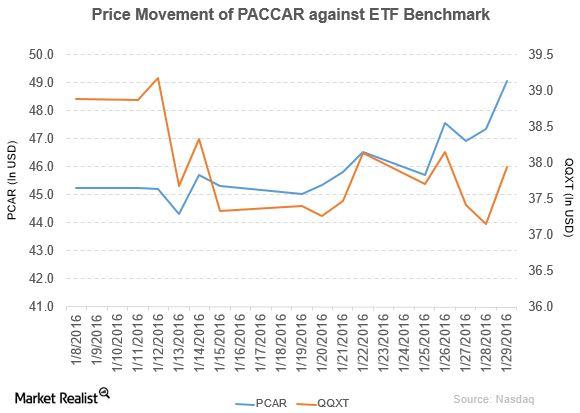
PACCAR’s Revenue and Income Rose in 2015
PACCAR (PCAR) rose by 5.5% to close at $49.07 per share at the end of the last week of January 2016.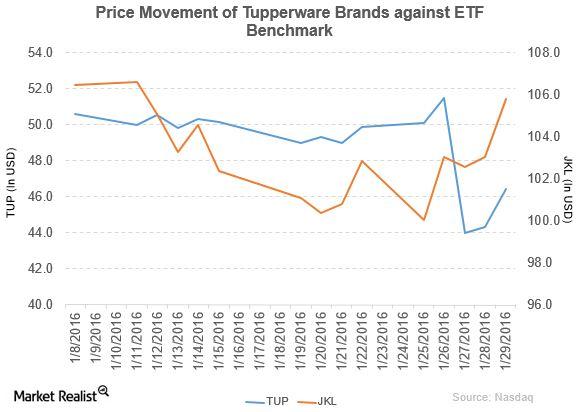
Tupperware Brands’ Revenue and Income Fell in 4Q15
Tupperware Brands (TUP) fell by 6.9% to close at $46.43 per share at the end of the last week of January 2016.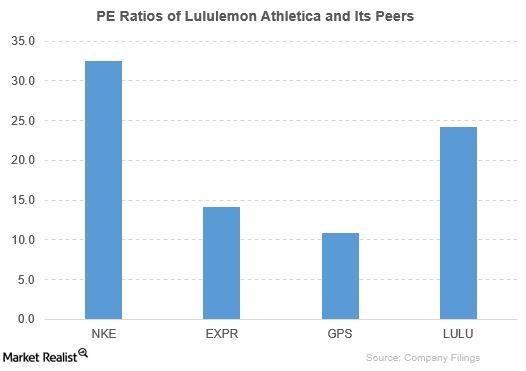
How Did Lululemon Athletica Compare to Its Peers?
Lululemon Athletica (LULU) has mostly outperformed its peers, namely NIKE (NKE), The GAP Inc. (GPS), and Express Inc. (EXPR), based on PE, PBV, and PS.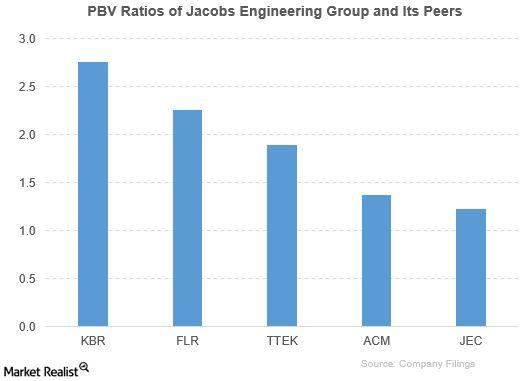
How Does Jacobs Engineering Group Compare to Its Peers?
The First Trust ISE Global Construction and Engineering ETF (FLM) invests 2.9% of its holdings in Jacobs Engineering Group.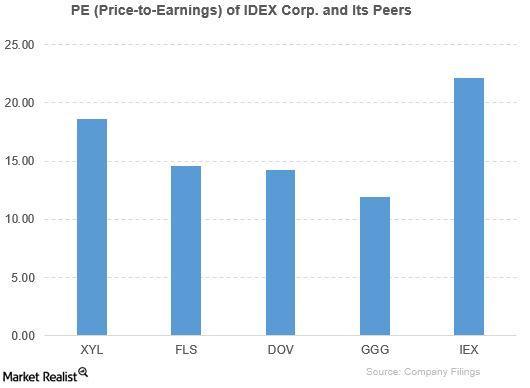
How Does IDEX Compare to Its Peers?
IDEX outperformed its peers based on the PE ratio and PBV ratio. The ETFs outperformed it based on the PE ratio. It’s ahead of its ETFs based on the PBV ratio.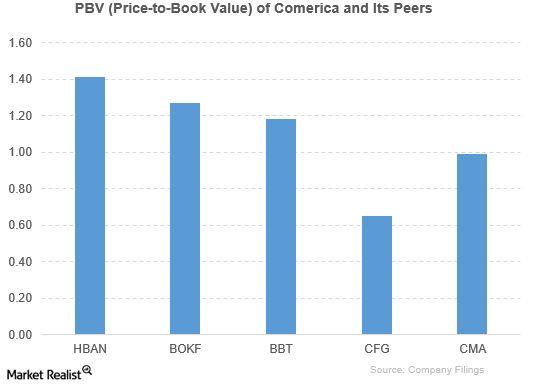
How Did Comerica Perform Compared to Its Peers?
The peers outperformed Comerica based on the PBV ratio. However, Comerica is way ahead of its peers based on the forward PE ratio.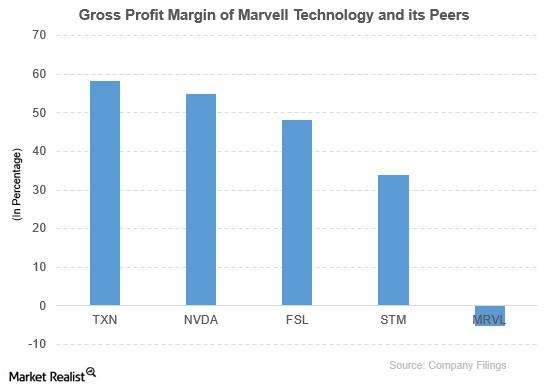
How Did Marvell Technology Compare to Its Peers?
Marvell Technology was outperformed by its peers based on the gross profit margin and PBV ratio. ETFs outperformed it based on the price movement and PBV ratio.