US Natural Gas Consumption Could Help the Prices
US natural gas consumption fell 0.17% to 57.1 Bcf/d (billion cubic feet per day) on October 12–18, 2017. It rose 3.1% from the same period in 2016.
Nov. 20 2020, Updated 11:48 a.m. ET

Weekly estimates: US natural gas consumption  
US natural gas consumption fell 0.17% to 57.1 Bcf/d (billion cubic feet per day) on October 12–18, 2017. However, US natural gas consumption rose 3.1% from the same period in 2016.
The YoY (year-over-year) rise in consumption is bullish for natural gas (UNG) (UGAZ) (GASL) prices. Changes in natural gas prices impact gas producers (IEO) (OIH) like Range Resources (RRC), WPX Energy (WPX), and Southwestern Energy (SWN).
US natural gas consumption drivers
For the week ending October 18, 2017, the power, residential, and commercial sectors’ consumption rose 4.5%, 2.6%, and 1.7%, respectively, YoY. It led to the YoY rise in natural gas consumption. The rise in consumption could have a positive impact on natural gas (DGAZ) (BOIL) prices.
EIA’s monthly estimates
According to the EIA (U.S. Energy Information Administration) US natural gas consumption was at 70.37 Bcf/d in July—the highest level since March 2017.
EIA’s annual estimates 
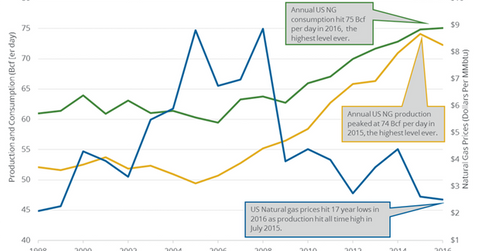
US natural gas consumption could average ~73.1 Bcf/d in 2017 and 76.8 Bcf/d in 2018. It averaged 74.6 Bcf/d in 2015 and 75.1 Bcf/d in 2016.
Impact  
US gas production could surpass consumption in 2017 and 2018. However, a rise in exports and the cold winter could drive natural gas prices. The EIA estimates that natural gas (FCG) (UGAZ) (DGAZ) prices could average $3.18 per MMBtu this winter. It’s 5% higher than last winter and 10.8% higher than the natural gas prices as of October 19, 2017.
Read What Dennis Gartman Thinks about Crude Oil Prices and Are US and OPEC Supplies Helping Crude Oil Bulls? for the latest updates on crude oil.
