What US Crude Oil Production’s 26-Month High Could Mean
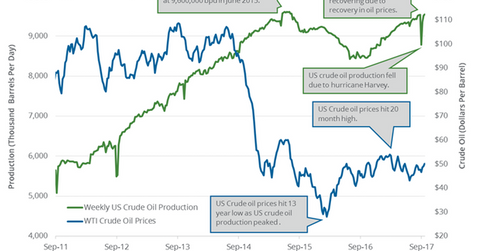
On September 27, 2017, the EIA estimated that US crude oil production rose 37,000 bpd (barrels per day) to ~9.5 MMbpd from September 15–22, 2017.
Nov. 20 2020, Updated 11:18 a.m. ET

US crude oil production  
On September 27, 2017, the EIA (US Energy Information Administration) released its Weekly Petroleum Status Report, estimating that US crude oil production rose 37,000 bpd (barrels per day) to ~9.5 MMbpd (million barrels per day) from September 15–22, 2017.
Production rose ~1.05 MMbpd, or ~12.4% YoY (year-over-year). US crude oil production is now at a 26-month high, and such high crude oil production has weighed on US crude oil (USO) (DBO) prices. Consequently, US crude oil prices have fallen 8.8% YTD (year-to-date).
Lower crude oil (UCO) (UWT) prices have a negative impact on oil and gas exploration and production companies (OIH) (IYE) like Chesapeake Energy (CHK), Continental Resources (CLR), Carrizo Oil & Gas (CRZO), and PDC Energy (PDCE). (For details on monthly US crude oil production, see Market Realist’s “US Crude Oil Production Hit a 5-Month Low.”)
US crude oil production: peaks, lows, and estimates 
US crude oil production hit 9.6 MMbpd in June 2015—the highest level ever. Production hit 8.4 MMbpd in July 2016—the lowest level since May 2014.
The EIA estimates that US crude oil production could average 9.3 MMbpd in 2017 and 9.8 MMbpd in 2018. Production averaged 9.4 MMbpd in 2015 and 8.9 MMbpd in 2016.
Impact 
US crude oil production could hit a new annual record in 2018. Any rise in crude oil production in Libya, Nigeria, Iran, Iraq, Canada, and Brazil could add to global supplies.
Meanwhile, the rise in US and global crude oil production could offset some of the impact of the major producers’ production cut deal, which could weigh on crude oil (IXC) (DWT) prices. Record US crude oil exports could also pressure oil (BNO) prices.
In the next part of this series, we’ll look at US gasoline inventories.
