What Are the Implied Volatilities of Crude Oil and Natural Gas?
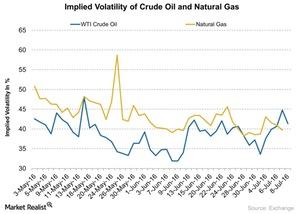
Crude oil’s (USO) (OIIL) implied volatility was 41.3% on July 8, 2016.
Aug. 18 2020, Updated 5:31 a.m. ET

Crude oil’s implied volatility
Crude oil’s (USO) (OIIL) implied volatility was 41.3% on July 8, 2016. Its 15-day average implied volatility is 39.1%. This means that its current level is 5.6% above its 15-day average.
Crude oil’s implied volatility spiked to 48.0% on May 16, 2016. Since then, its implied volatility has fallen by 13.9%. Since May 16, US crude oil has fallen by 5.4%. Last week, crude oil fell by 7.3%. The implied volatility jumped 23.0% between July 1 and July 8.
What about natural gas?
Natural gas’s (UNG) (GASL) (GASX) implied volatility was 39.7% on July 8, 2016. Its 15-day average implied volatility is 41.4%. This means that its current level of implied volatility is 4.1% below its 15-day average.
Natural gas’s implied volatility spiked to 58.7% on May 24, 2016. Since then, its implied volatility has fallen by 29.5%. Since May 24, natural gas has risen by 41.5%. Last week, natural gas futures fell by 6.2%.
