Triangle Petroleum Corp
Latest Triangle Petroleum Corp News and Updates
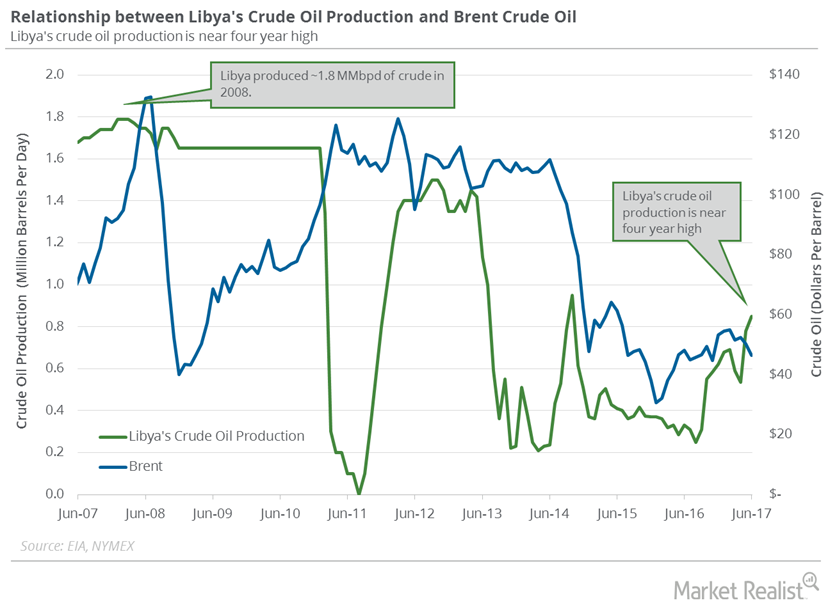
Libya’s Crude Oil Production: Bears Could Control Oil Prices
Libya’s crude oil production was at 1,030,000 bpd in July 2017. Production has risen ~60% from its levels in January 2017.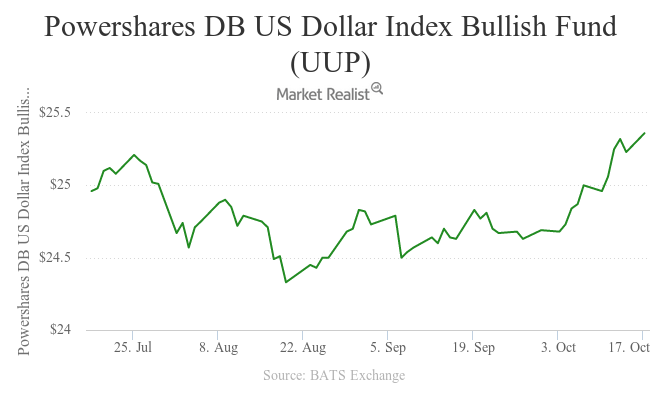
US Dollar near 7-Month High: Will It Pressure Crude Oil Prices?
November West Texas Intermediate crude oil futures contracts fell 0.8% and settled at $49.94 per barrel on October 17, 2016.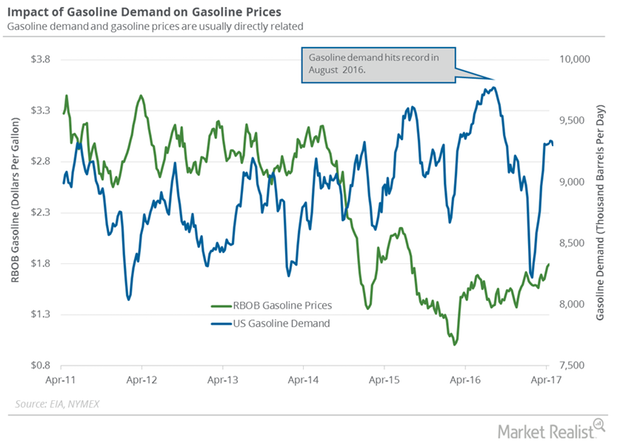
Why Investors Are Tracking US Gasoline Demand
The EIA (U.S. Energy Information Administration) estimated that four-week average US gasoline demand fell by 80,000 bpd to 9,237,000 bpd on April 14–21.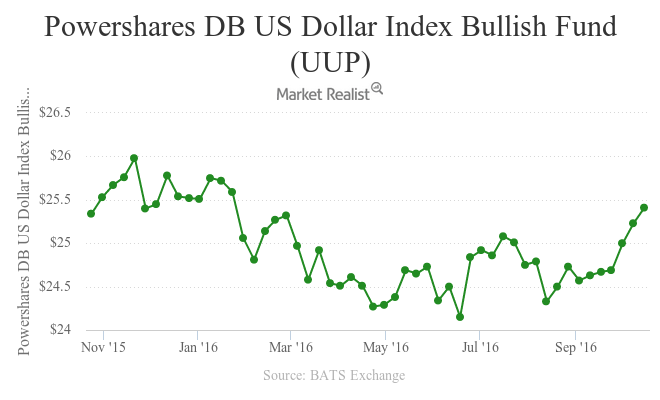
US Dollar near 9-Month High: Is It Bearish for Crude Oil Prices?
December WTI crude oil futures contracts rose on October 21, 2016, due to expectations of OPEC and Russia reaching an agreement to cap production.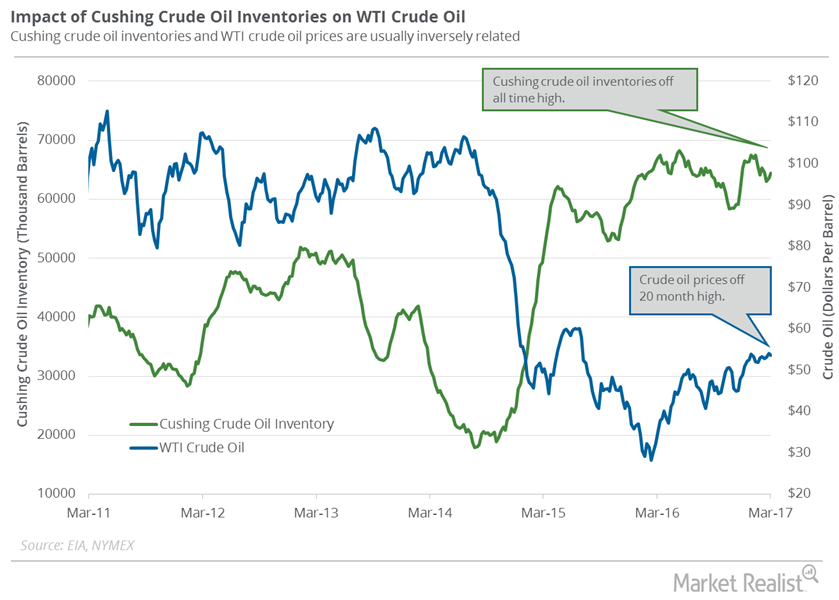
Cushing Crude Oil Inventories: More Pain for Oil Prices?
Market surveys estimate that Cushing crude oil inventories rose from March 3–10. A rise in crude oil inventories could pressure US crude oil prices.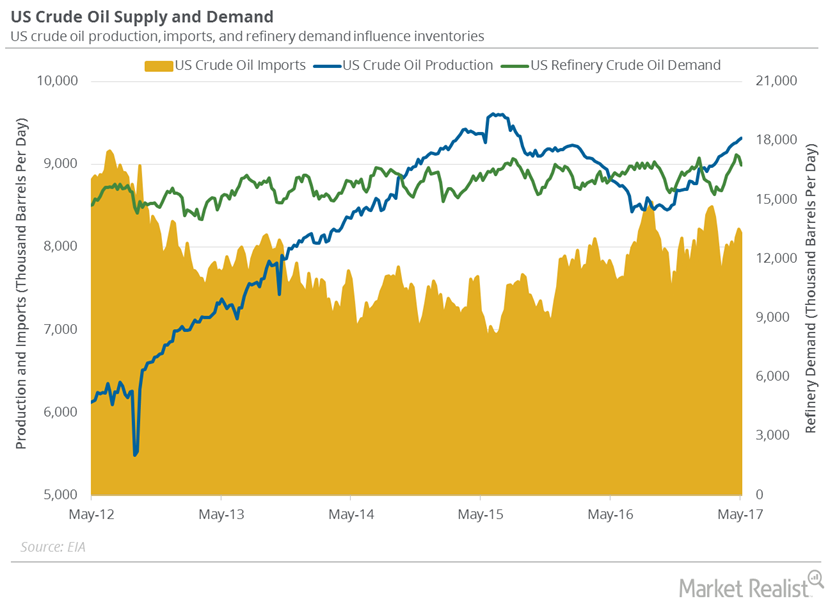
Fall in US Refinery Demand and Imports Impacted Inventories
US refineries operated at 91.5% of their operable capacity in the week ending May 5, 2017. The US refinery demand fell for the second consecutive week.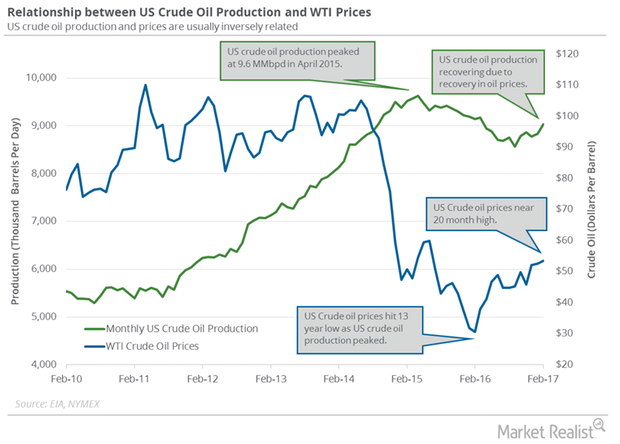
Could US Crude Oil Production Push Production Cut Deal Past 2017?
The EIA reported that monthly US crude oil production rose 196,000 bpd to 9.0 MMbpd in February 2017.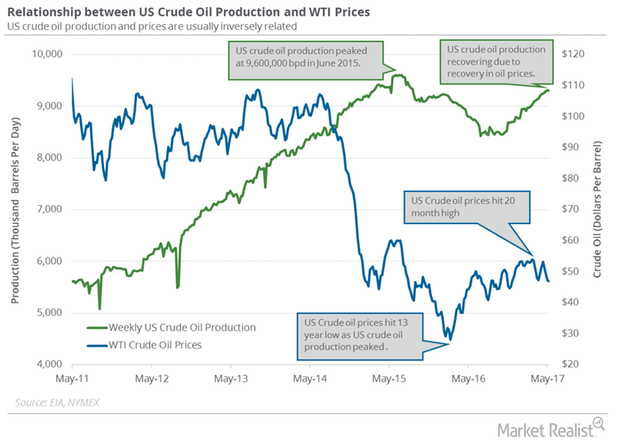
US Crude Oil Production Fell for the First Time since February
US crude oil production fell by 9,000 bpd to 9,305,000 bpd on May 5–12, 2017. Production fell 0.1% week-over-week, but rose 5.8% year-over-year.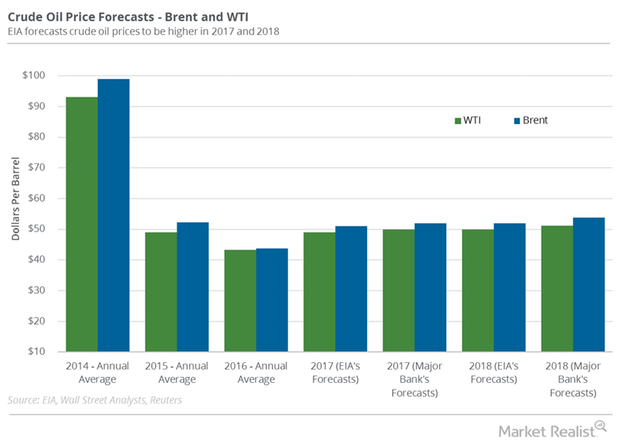
Why Were Crude Oil Price Forecasts Downgraded Again?
A Wall Street Journal survey estimates that US crude oil prices could average $51 per barrel in 2018—$2 per barrel lower than previous estimates.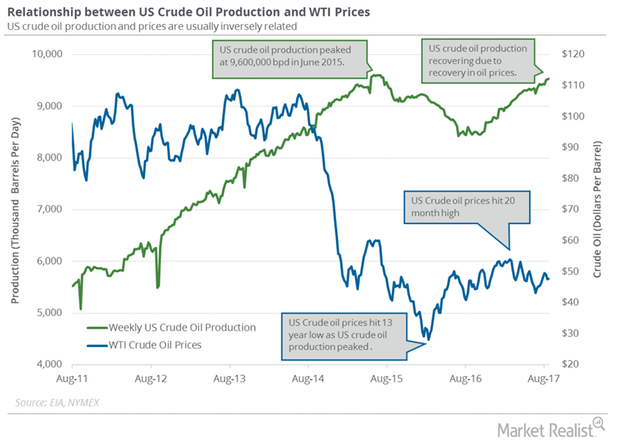
How Hurricane Harvey May Impact US Crude Oil Production
US crude oil production The EIA (U.S. Energy Information Administration) estimates that US crude oil production rose by 2,000 bpd (barrels per day) to 9,530,000 bpd between August 18 and 25, 2017. Production rose 1,042,000 bpd, or 12.3%, from the same period in 2016. It has risen for three consecutive weeks to August 25, and has reached […]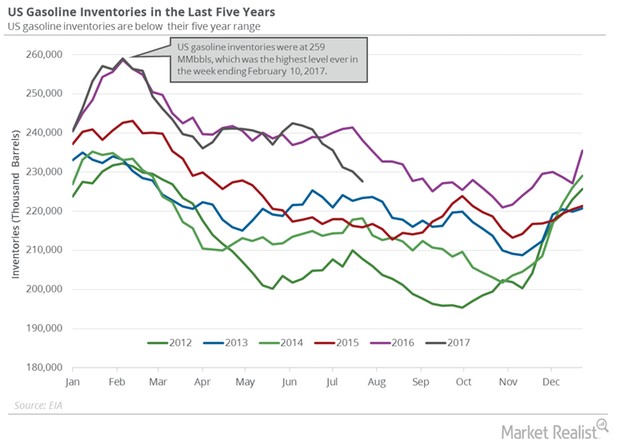
Will US Crude Oil and Gasoline Inventories Support Oil Prices?
September WTI (West Texas Intermediate) crude oil (OIH) (SCO) (DIG) futures contracts rose 0.5% to $47.81 per barrel in electronic trading at 1:50 AM EST on August 16, 2017.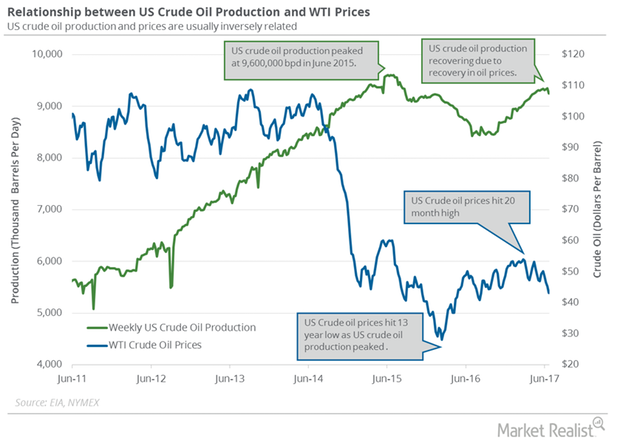
US Crude Oil Production: Biggest Weekly Fall since July 2016
The EIA (U.S. Energy Information Administration) reported that US crude oil production fell by 100,000 bpd to 9,250,000 bpd on June 16–23, 2017.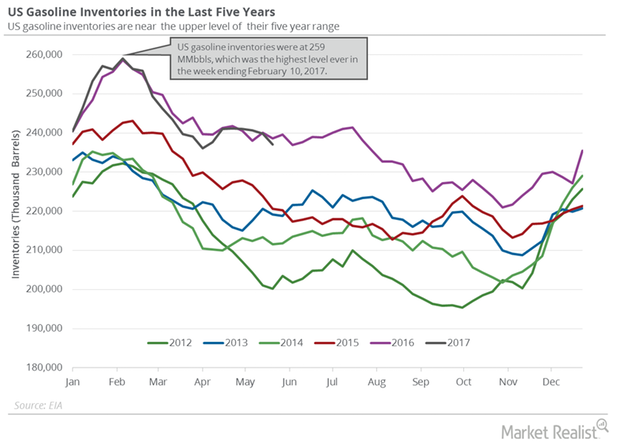
US Gasoline Inventories: More Concerns for Crude Oil Prices
US gasoline inventories are 7.2% below their all-time high. The expectation of a fall in gasoline inventories could support gasoline prices.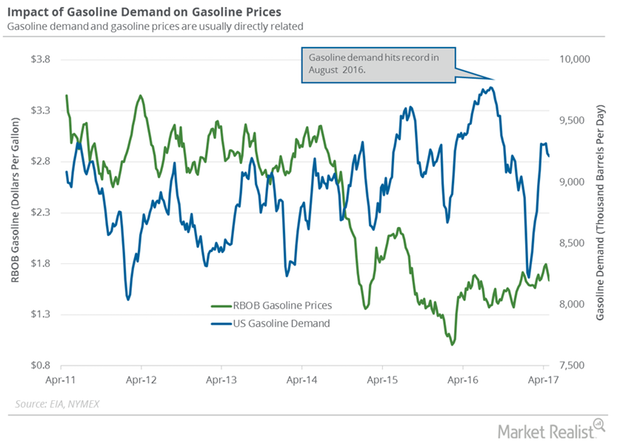
Is US Gasoline Demand Turning Bearish?
The EIA estimated that four-week average US gasoline demand fell by 22,000 bpd (barrels per day) to 9,215,000 bpd on April 21–28, 2017.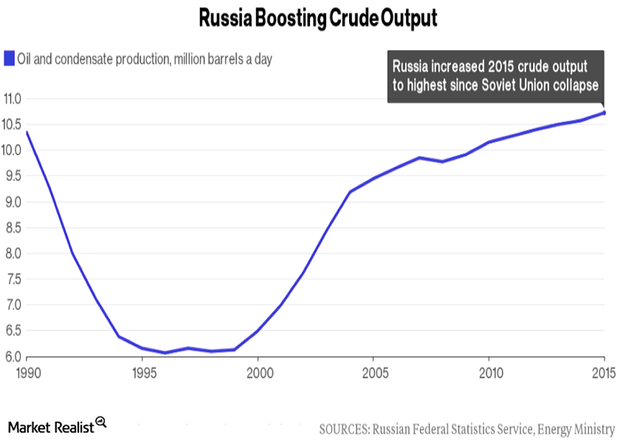
Russia’s Crude Oil Production Will Pressure the Crude Oil Market
Russia’s crude oil production rose to 10.84 MMbpd in June 2016—compared to the previous month—according to sources from the Russian Energy Ministry.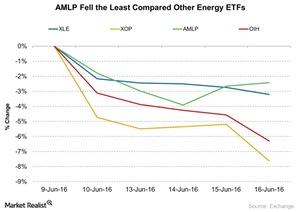
AMLP Fell: Did It Outperform Other Energy ETFs?
The Alerian MLP ETF (AMLP) outperformed other energy ETFs from June 9–16, 2016. Falling crude oil has less of an impact on midstream companies.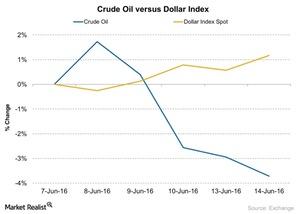
Will the Dollar’s Recovery Affect Crude Oil?
Between June 7 and June 14, 2016, crude oil (USO) fell by ~3.7% while the US dollar index (UUP) rose by around 1.2%.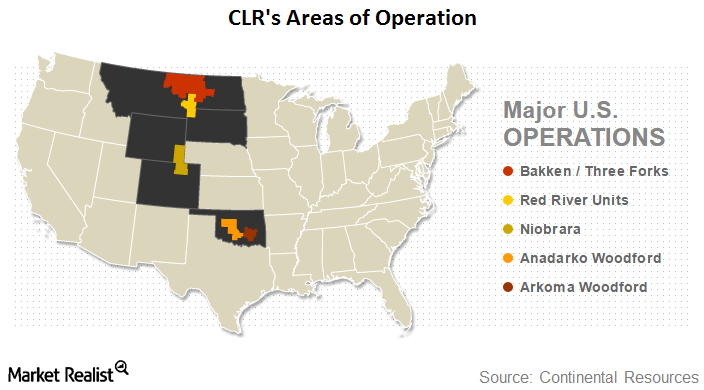
Continental Resources: An Introduction
In this series, we will analyze how badly Continental Resources (CLR) was hit by weak oil prices, and what measures it has taken to counter this situation. In 2015, crude oil accounted for 66% of CLR’s total production and 85% of its revenues.
How Did the Consumer Price Index Affect Crude Oil Prices?
The US (SPY) (VOO) CPI (consumer price index) rose 0.4% on a month-over-month basis in April, according to a US Department of Labor report on May 17, 2016.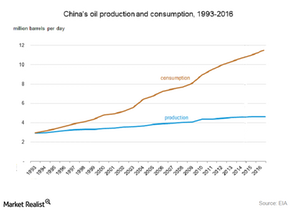
How Will China and India Impact the Crude Oil Market in 2016?
China’s crude oil production fell to the lowest level in four years. It fell by 5.6% YoY (year-over-year) to 16.6 metric tons in April 2016.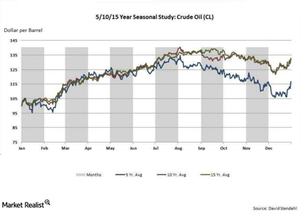
How Seasonality Impacts Crude Oil Prices
Seasonality plays a key role in influencing crude oil prices. Crude oil prices tend to rise in August due to the summer driving season, which results in a rise in gasoline demand.