Why Did UNG Outperform USO?
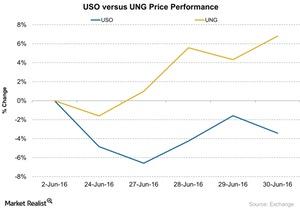
From June 23—30, the United States Natural Gas ETF (UNG) outperformed the United States Oil ETF (USO). UNG rose ~6.8%, while USO fell ~3.4%.
Oct. 8 2020, Updated 1:12 p.m. ET

USO versus UNG
From June 23—30, the United States Natural Gas ETF (UNG) outperformed the United States Oil ETF (USO). UNG rose ~6.8%, while USO fell ~3.4%.
UNG ended June 30 with a rise of ~2.4% after the EIA (U.S. Energy Information Administration) announced a 42 Bcf (billion cubic feet) addition to natural gas (UNG) (GASL) inventory levels. Analysts expected an addition of 46 Bcf, according to S&P Global Platts.
Natural gas July futures rose 2.1% and closed on June 30 at $2.92 per MMBtu (million British thermal units)—the highest level for 2016 and since August 2015, on a closing price basis. UNG tracks natural gas futures.
USO tracks crude oil futures. It fell due to bearishness in the Brexit aftermath. On June 30, US crude oil (SCO) (UCO) (UWTI) fell to $48.33 per barrel. This is 3.1% below its previous session’s closing price.
Since June 23, USO has fallen along with crude oil futures. It fell 3.4% between June 23 and 30, while crude oil futures fell 3.6% during that period.
Analyzing UNG’s performance
UNG rose 46.2% between March 3 and June 30, 2016. During that period, natural gas futures rose 78.3%. On March 3, natural gas futures hit 17-year lows.
From June 20, 2014, to date, UNG has fallen about 66.6%. Natural gas futures have fallen 35.5%. The almost two-year downturn in crude oil prices started from a peak on June 20, 2014. This has lowered the sentiment in the entire energy complex.
These numbers show UNG’s low returns compared to crude oil futures. This is due to the small losses that UNG suffers when the fund rolls its exposure to active natural gas futures that are at a higher price than the expiring futures contracts in the fund.
Investors can look at energy ETFs such as the Energy Select Sector SPDR ETF (XLE) and the SPDR S&P Oil & Gas Exploration & Production ETF (XOP) for exposure to the energy sector. They invest in oil and natural gas–weighted stocks as opposed to direct exposure to UNG.
Oil-weighted stocks such as Synergy Resources (SYRG), Carrizo Oil & Gas (CRZO), Bonanza Creek Energy (BCEI), and Halcon Resources (HK) are part of XOP.
In the next part, we’ll look at XLE and how it outperformed other SPDR ETFs.
