Halcon Resources Corp
Latest Halcon Resources Corp News and Updates
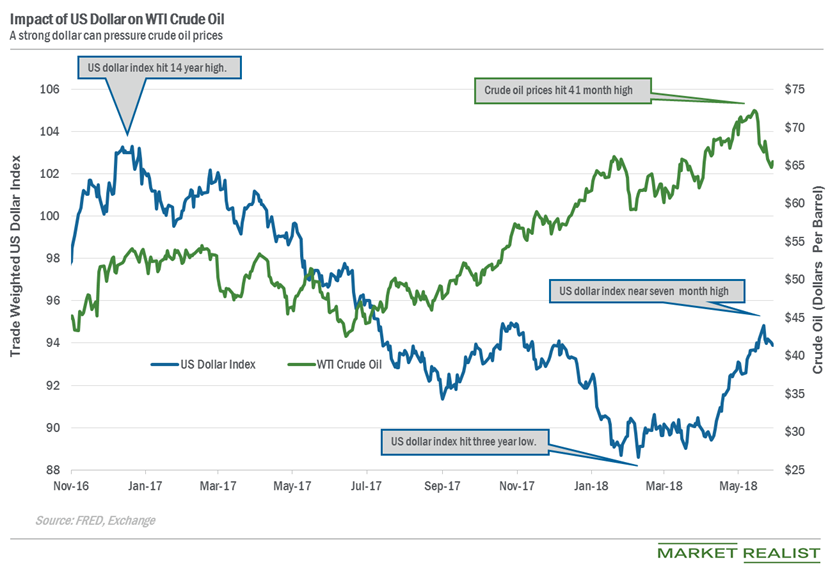
Can the US Dollar Index Help WTI Crude Oil Prices?
The US Dollar Index fell ~0.13% to 93.89, and July WTI oil futures rose ~1.2% on June 5.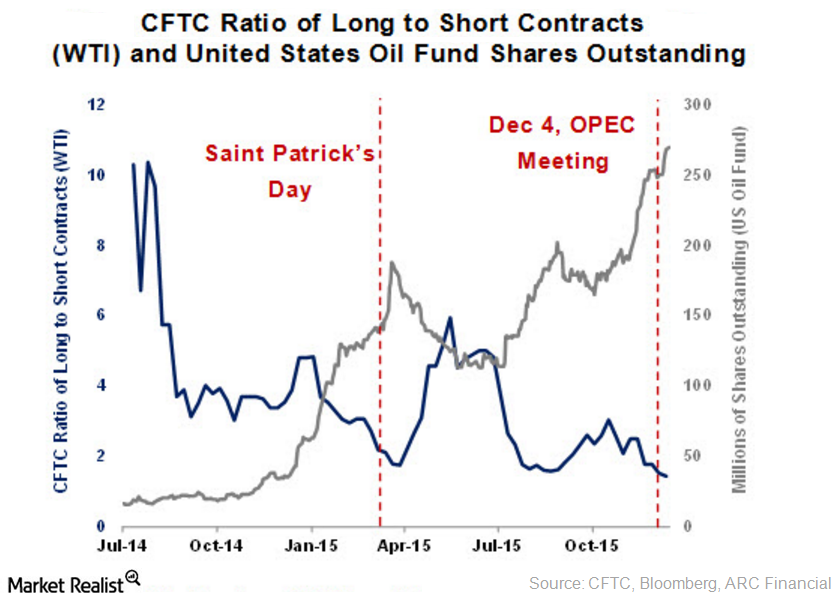
Long Positions Fall in the CFTC’s Commitment of Traders Report
The CFTC’s COT report states that hedge funds reduced their long positions for the week ending January 12, 2016. The net long positions fell by 20,673 contracts to 163,504 contracts during the week.
US Tech Companies Face Hong Kong National Security Law
China’s controversial Hong Kong national security law could be a nightmare for US tech companies. Overall, the law would give China more power.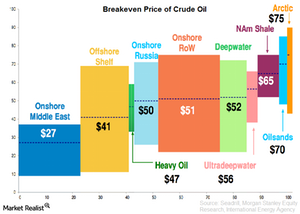
Why is the breakeven price of crude oil so important?
Knowing the breakeven price of crude oil is important when trying to figure out what OPEC needs in order to regain market share.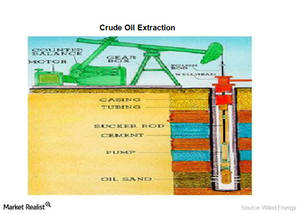
Why it’s important to know the crude oil extraction process
Before learning the costs components of crude oil extraction, let’s take a look at how producers extract crude oil from the ground.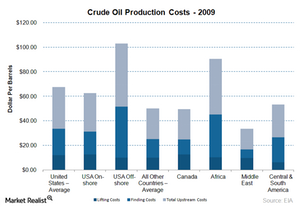
How does the production cost of crude oil affect oil prices?
Recent consensus says the production cost of crude oil could range from $20 to $25 per barrel.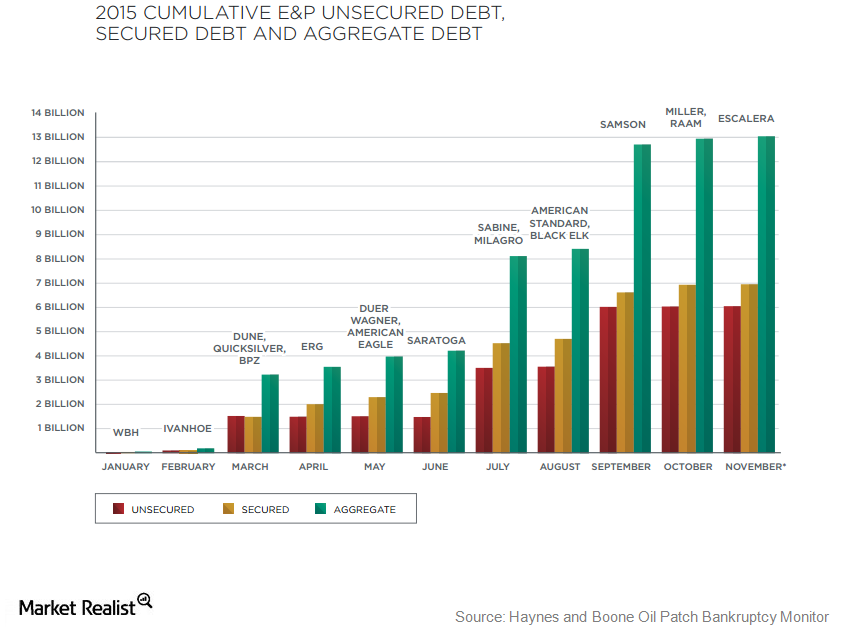
US Oil and Gas Companies’ Debt Exceeds $200 Billion
US oil and gas exploration and production companies are under severe pressure.