Comparing GlaxoSmithKline with Its Peers
Pharmaceutical companies like GlaxoSmithKline are capital-intensive, with high debt on their balance sheets due to heavy setup costs and huge research and development expenses.
July 17 2015, Updated 9:05 a.m. ET

GlaxoSmithKline and peers
British pharmaceutical giant GlaxoSmithKline’s (GSK) close competitors include Merck (MRK), Novartis AG (NVS), Sanofi (SNY), Pfizer (PFE), AstraZeneca (AZN), and Teva Pharmaceuticals (TEVA).
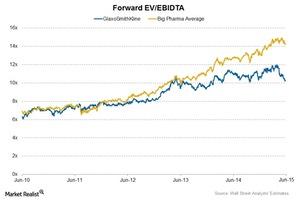
Pharmaceuticals and healthcare companies are capital-intensive companies, with high debt on their balance sheets due to heavy setup costs and huge research and development expenses. The EV/EBITDA ratio (or enterprise value to earnings before interest, tax, depreciation, and amortization) is often used to value capital-intensive companies. The chart below shows the forward enterprise multiple (or forward EV/EBIDTA multiple) trend since June 2010 for GlaxoSmithKline, along with change in the EBIDTA margin over the same period.
EV/EBIDTA multiple
The forward EV/EBIDTA multiple for GlaxoSmithKline is ~10x, which is much lower than the industry average of ~14x. Johnson & Johnson (JNJ) has an enterprise multiple of ~11x, Merck (MRK) has ~12x, AstraZeneca has ~13x, Eli Lilly and Co. (LLY) has ~17x, and Bristol Myers Squibb (BMY) has an enterprise multiple of ~24x.
PE Multiple
The price-to-earnings (or PE) multiple is one of the simplest multiples used for valuations. A forward PE multiple represents the estimates of a company’s PE multiple for the next 12 months. The forward PE ratio for GlaxoSmithKline is ~16x for 2015, while it is ~19.6x for the industry. The cross-sectional study indicates a direct relation between EPS growth and the forward PE for GSK.
Funds like the Health Care Select Sector SPDR ETF (XLV) and the iShares US Healthcare ETF (IYH) are focused on pharmaceutical companies.
