Where Does Johnson & Johnson Stand in the Industry?
Estimates suggest that Johnson & Johnson’s forward PE ratio increased from 15.5x in 2014 to 16.1x in 2015. The PE ratio is hovering around 19x for the industry.
March 18 2015, Updated 5:05 p.m. ET

Johnson & Johnson and its peers
Johnson & Johnson (JNJ) is a diversified company. It has operations in the Consumer Products, Medical Devices and Diagnostic, and Pharmaceuticals segments. Some of the other big pharma companies include Pfizer (PFE), Merck and Co. (MRK), and Novartis AG (NVS).
For medical devices, large companies include Medtronic (MDT) and Boston Scientific (BSX). For orthopedic implants, the major pharmaceutical companies include Stryker (SYK) and Zimmer Holdings (ZMH). For consumer products, other prominent companies include Procter & Gamble (PG) and Unilever NV (UN).
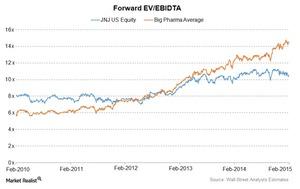
Big pharma and healthcare companies generally carry high debt on accounting balance sheets. Therefore, EV/EBITDA (enterprise value to earnings before interest, tax, depreciation, and amortization) is often used to value capital-intensive companies. The above chart shows Johnson & Johnson’s forward EV/EBIDTA multiple trend over five years—compared to the industry trend.
EV/EBIDTA multiple
The forward EV/EBIDTA multiple represents the futuristic enterprise multiple over the next 12 months. Johnson & Johnson’s EV/EBIDTA multiple is much lower than the industry average. Stocks like Bristol-Myers Squibb Co. (BMY) and Eli Lily and Company (LLY) have a higher enterprise multiple.
PE multiple
The price-to-earnings, or PE, multiple is one of the simplest multiples used for valuations. A forward PE multiple represents the estimates of the PE multiple for the next 12 months. Analysts’ estimates suggest that Johnson & Johnson’s forward PE ratio increased from 15.5x in 2014 to 16.1x in 2015. The PE ratio is hovering around 19x for the industry.
Also, the estimate for the PEG, or PE-to-growth, ratio is 2.76. The company is trailing at a lower PE due to Remicade’s expected patent expiration. It’s the largest selling drug. It contributes to over 9% of the total revenue. However, the forward PE is expected to be higher due to an estimated increase in sales and new product launches.
When Johnson & Johnson is compared with its peers—including Pfizer, Merck and Co., and Eli Lily and Company—it’s the only company that had an increase in revenue and net earnings year-over-year, or YoY, for the last three years.
Annualized returns
Johnson & Johnson’s annualized returns are 14.14%, 19.77%, and 13.58%, respectively, for one-year, three-years, and five-years. For the industry, the returns are 16.19%, 20.54%, and 15.39%, for similar periods, respectively.
