Could US Crude Oil Production Push Production Cut Deal Past 2017?
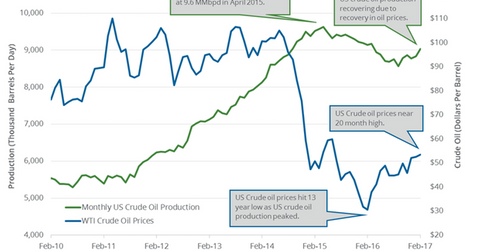
The EIA reported that monthly US crude oil production rose 196,000 bpd to 9.0 MMbpd in February 2017.
Nov. 20 2020, Updated 1:00 p.m. ET

Monthly US crude oil production
The EIA (U.S. Energy Information Administration) reported that monthly US crude oil production rose 196,000 bpd (barrels per day) to 9.0 MMbpd (million barrels per day) in February 2017 compared to the previous month. Production rose 2.2% month-over-month but fell 1.2% year-over-year. Production has risen four times in the last five months.
Production is at the highest level since April 2016. The rise in US crude oil production could pressure crude oil (DIG) (FENY) (SCO) prices. For more on crude oil prices, read Part 1 of this series. Also read US Crude Oil Production Is near August 2015 High for more on weekly US crude oil production and production estimates for 2017 and 2018.
Monthly US crude oil production: Peaks and lows 
US crude oil production peaked at 9.6 MMbpd in April 2015. In July 2016, production hit 8.6 MMbpd, the lowest monthly level since April 2014. Since then, US crude oil production has risen ~4.7%.
The rise in US crude oil production impacts the earnings of oil producers such as Chesapeake Energy (CHK), ExxonMobil (XOM), SM Energy (SM), Stone Energy (SGY), and Triangle Petroleum (TPLM).
OPEC and the production cut deal
Below are some reasons OPEC (Organization of the Petroleum Exporting Countries) may need to extend the production cut deal beyond 2017:
- US crude oil production at 48-year high by 2018
- US crude oil rigs rising to two-year high
- near-record US crude oil inventories
- rise in US crude oil exports to offset the cut in production overseas
- rise in gasoline and distillate inventories in the past few weeks, which would pressure gasoline prices and in turn pressure oil (VDE) (XES) prices
So the United States could be the main producer to offset a fall in the crude oil supply from the major oil producers’ output cut deal.
For more on crude oil prices, be sure to read What Can Investors Expect in the Crude Oil Market in 2017? and Is It Time for OPEC to Rebalance the Crude Oil Market?
Read Will Crude Oil Prices Test 3 Digits Again? for more on crude oil price forecasts.
For related analysis, visit Market Realist’s Energy and Power page.
