Guggenheim S&P 500® Equal Wt Energy ETF
Latest Guggenheim S&P 500® Equal Wt Energy ETF News and Updates
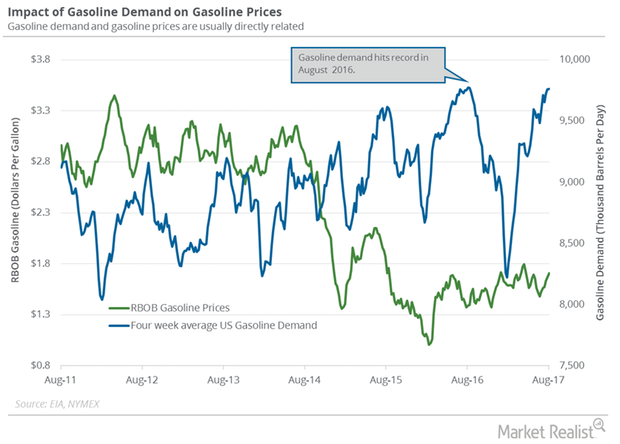
What to Expect from US Gasoline Demand
The EIA (U.S. Energy Information Administration) estimates that weekly US gasoline demand fell by 45,000 bpd (barrels per day), or 0.45%, to 9,797,000 bpd between July 28 and August 4, 2017.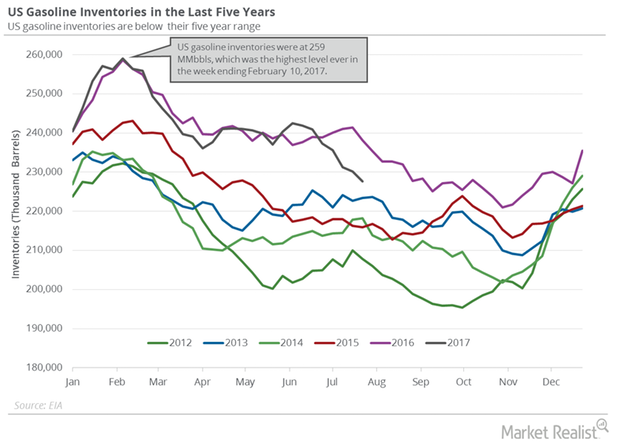
US Gasoline Inventories Limit the Upside for Crude Oil Futures
US gasoline inventories rose by 3.4 MMbbls to 231.1 MMbbls on July 28–August 4, 2017. Inventories rose for the third time in the last ten weeks.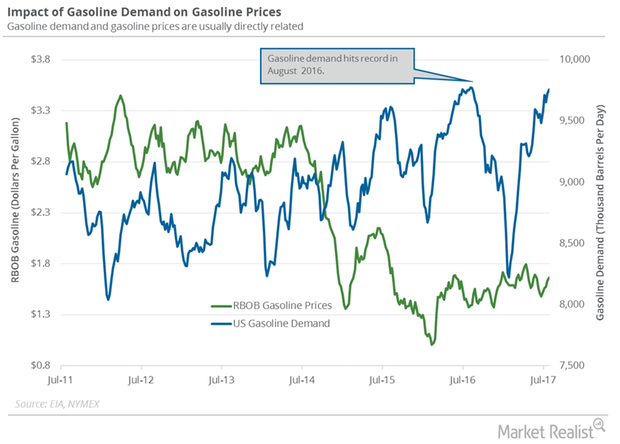
US Gasoline Demand Hit a Record: What’s Next?
The EIA estimates that weekly US gasoline demand rose by 21,000 bpd (barrels per day) to 9,842,000 bpd on July 21–28, 2017. It’s the highest level ever.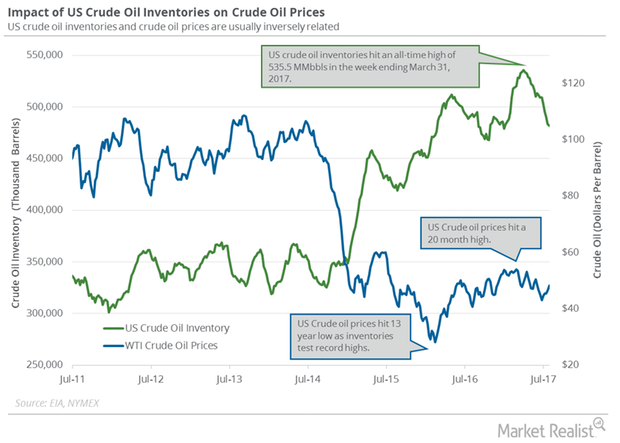
Crude Oil Futures Fell despite OPEC’s Meeting and API Data
September US crude oil futures contracts fell 0.4% to $49.17 per barrel on August 8. Brent crude oil futures fell 0.4% to $52.14 per barrel on the same day.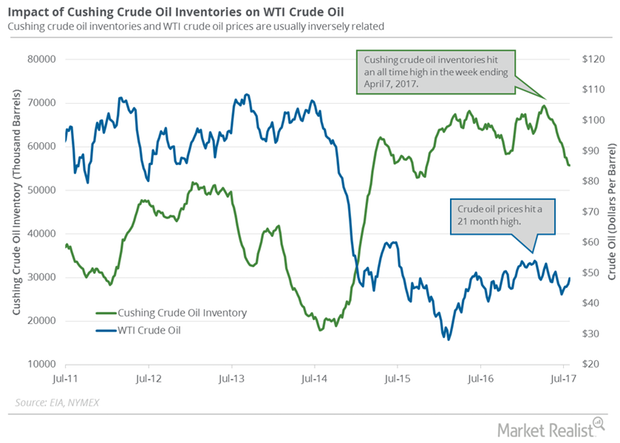
Cushing Inventories Fell 20% from the Peak
A preliminary market survey estimates that Cushing inventories fell on July 28–August 4, 2017. Inventories fell for the 11th consecutive week.
Problems for Crude Oil Bulls as OPEC Production Hits 2017 High
September US crude oil futures contracts rose 0.20% and were trading at $50.29 per barrel in electronic trading at 1:35 AM EST on August 1, 2017.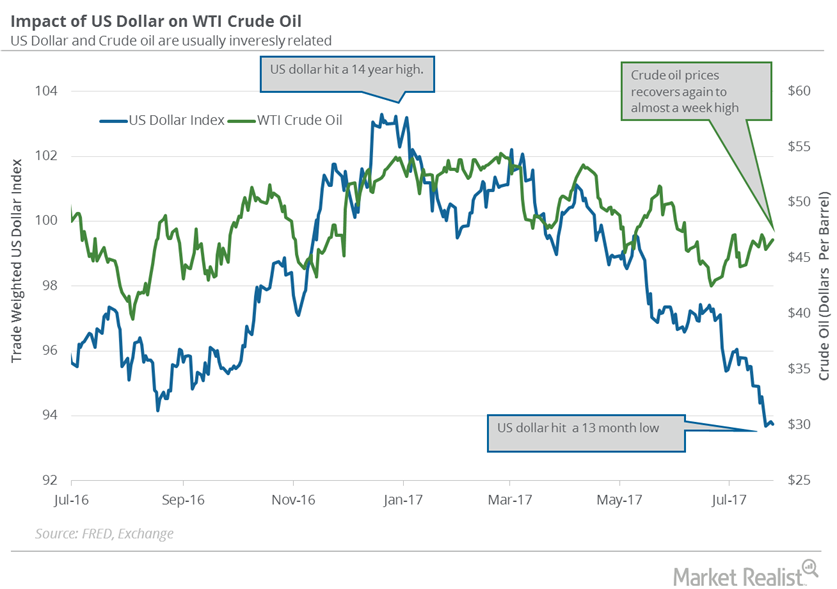
US Dollar Is near a 13-Month Low: What’s Next?
The US dollar hit 93.68 on July 21, 2017—the lowest level in 13 months. The US dollar has fallen more than 8% in 2017.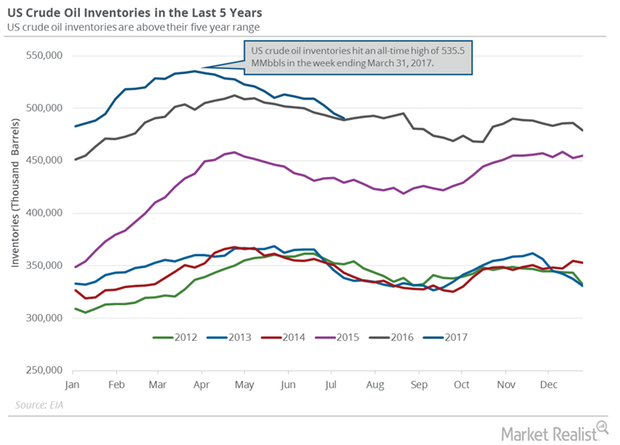
US Crude Oil Inventories Could Fall below the 5-Year Average
The EIA estimates that US crude oil inventories fell by 4.7 MMbbls (million barrels) to 490.6 MMbbls on July 7–14, 2017.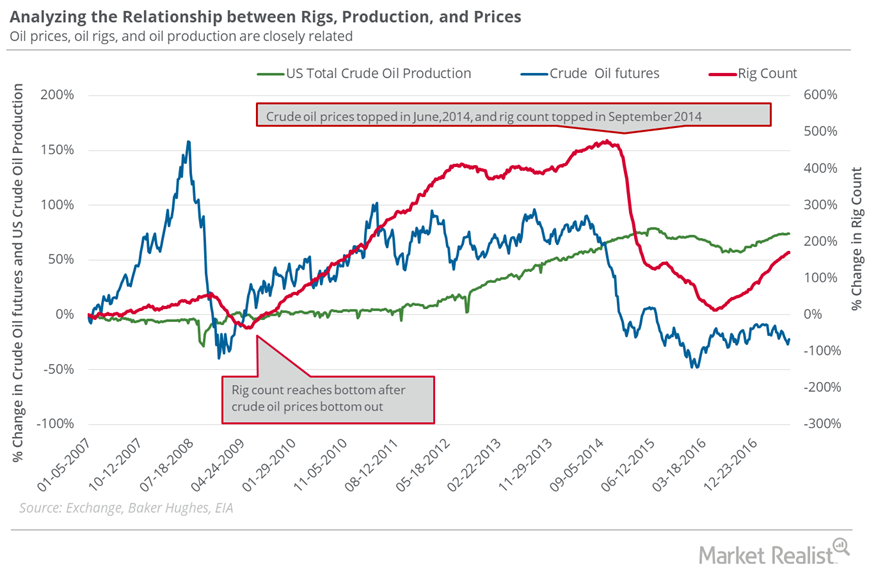
Oil Rigs: Oil Prices Could Make a U-Turn
The US oil rig count extended to 765 in the week ending July 14, 2017—a gain of two rigs compared to the previous week.
Near Record US Gasoline Demand: Are the Bulls Taking Control?
The EIA estimates that the four-week average for US gasoline demand rose 129,000 bpd (barrels per day) to 9.7 MMbpd (million barrels per day) from July 7 to 14, 2017.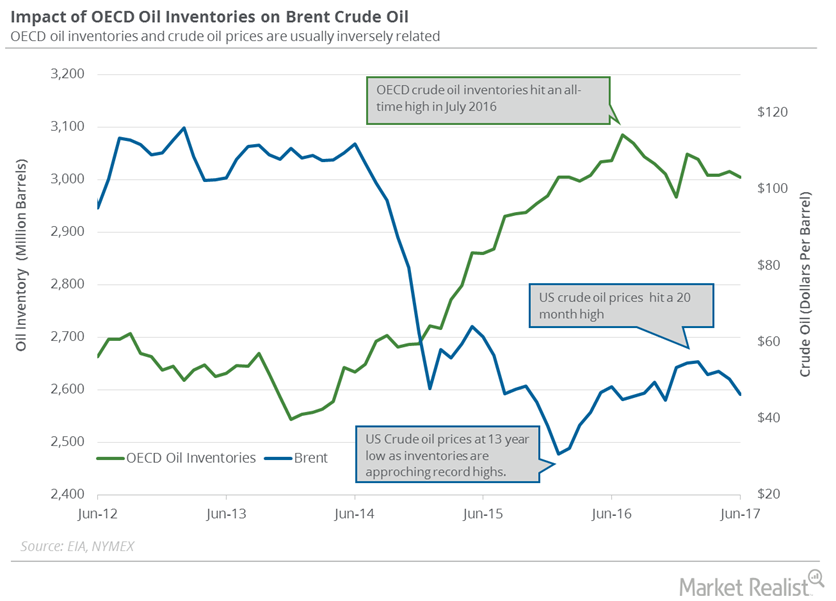
Will OECD’s Crude Oil Inventories Fall below the 5-Year Average?
The EIA estimates that OECD’s crude oil inventories fell by 10.13 MMbbls (million barrels) to 3,005 MMbbls in June 2017—compared to May 2017.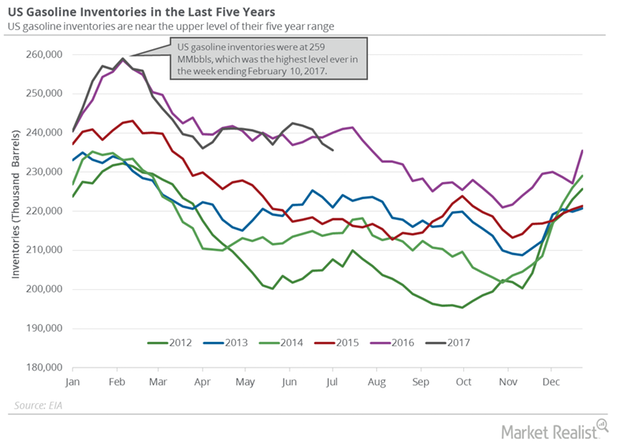
US Gasoline Inventories Support Gasoline, Crude Oil Futures
The EIA reported that US gasoline inventories fell 1.6 MMbbls (million barrels) to 235.6 MMbbls between June 30, 2017, and July 7, 2017.
Why Oil Prices Could Plunge
The US oil rig count rose by seven to 763 in the week ended July 7, 2017. This was the rig count’s highest level since April 10, 2015.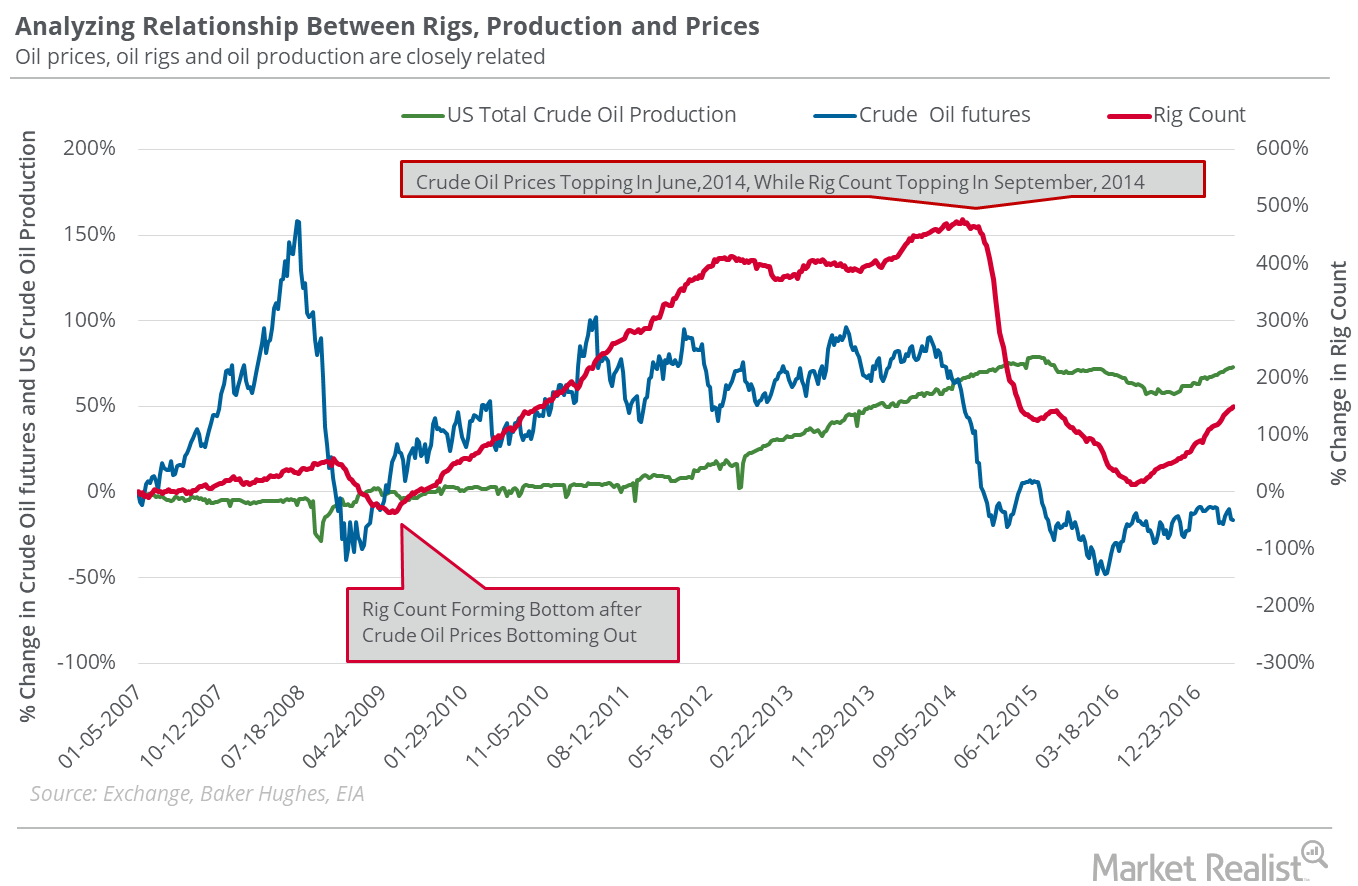
Oil Rigs: Will Oil Prices Rise More?
On June 23–June 30, the US oil rig count fell by two to 756. The fall was marginal, but it was the first fall after rising for 23 consecutive weeks.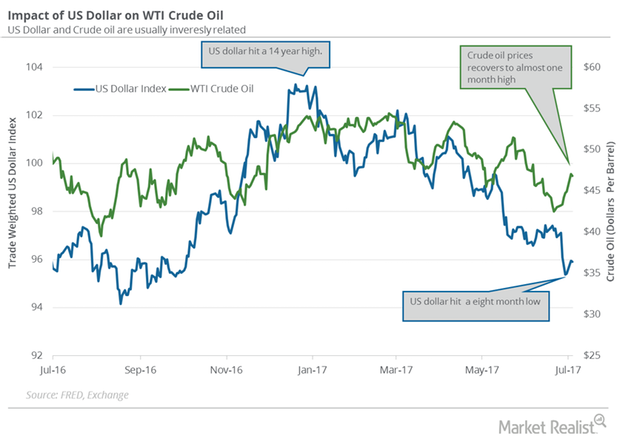
Will the US Dollar Continue Its Bearish Momentum This Week?
August 2017 West Texas Intermediate crude oil futures contracts fell 0.5% and were trading at $46.83 per barrel in electronic trade at 1:45 AM EST on July 4, 2017.
OPEC’s Crude Oil Production Hit a 2017 High
OPEC’s production cut compliance was at 92% in June 2017. Lower compliance from OPEC members and Russia could pressure crude oil prices.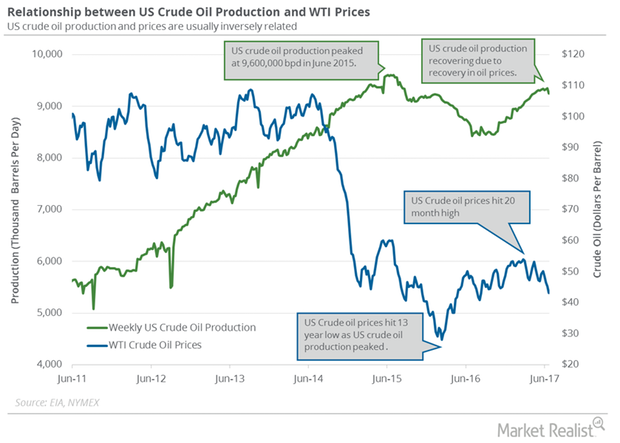
Will Libya and Iran Swing Crude Oil Prices?
Market surveys project that Libya’s crude oil production is near 1 MMbpd—the highest level in three years. High production could pressure crude oil prices.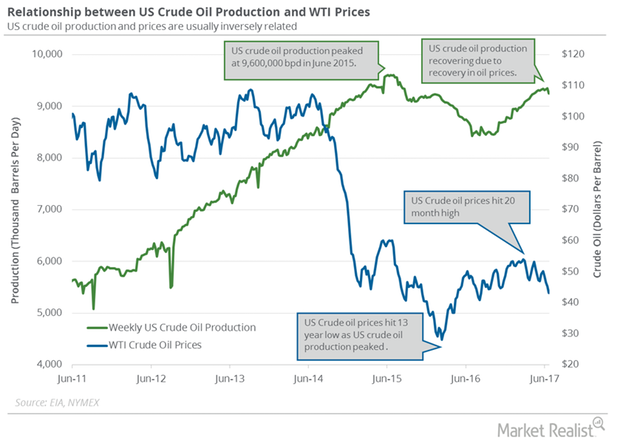
US Crude Oil Production: Biggest Weekly Fall since July 2016
The EIA (U.S. Energy Information Administration) reported that US crude oil production fell by 100,000 bpd to 9,250,000 bpd on June 16–23, 2017.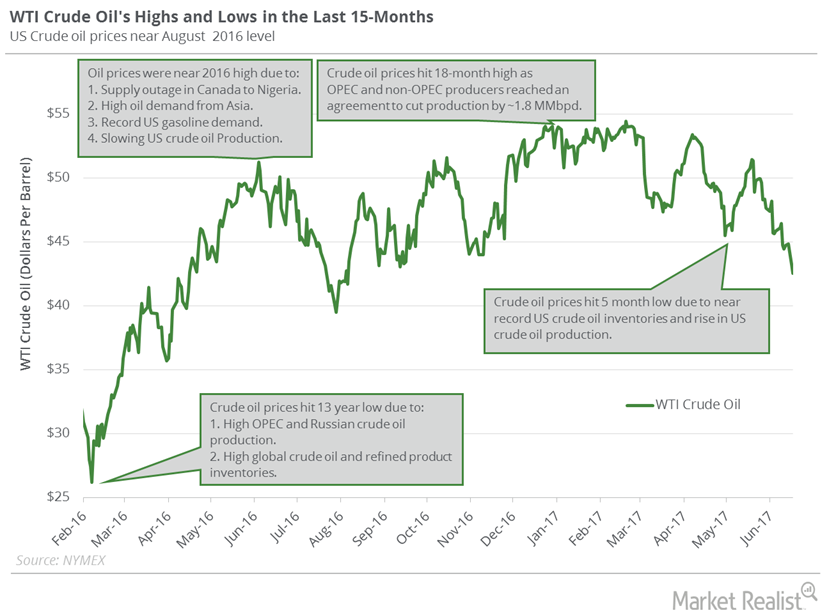
US Crude Oil Prices Could Be Range Bound Next Week
August WTI (West Texas Intermediate) crude oil (XOP) (VDE) (RYE) futures contracts rose 0.5% and closed at $42.74 per barrel on June 22, 2017.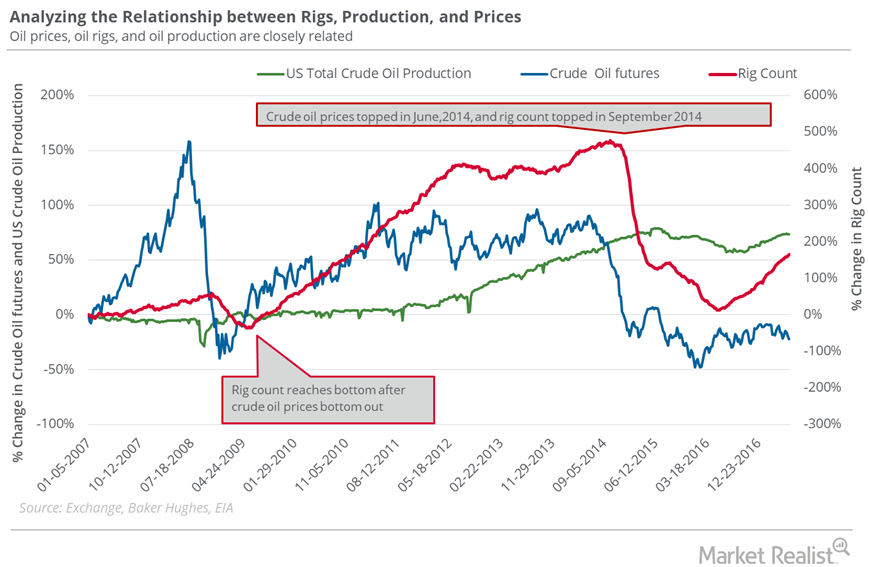
Rising Oil Rigs: Oil Bears’ Friend, Oil Bulls’ Foe
In the week ended June 16, 2017, the US oil rig count was 747, its highest level since the week ended April 17, 2015.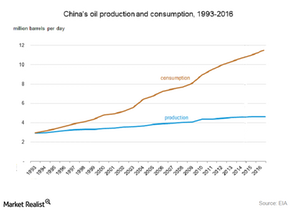
How Will China and India Impact the Crude Oil Market in 2016?
China’s crude oil production fell to the lowest level in four years. It fell by 5.6% YoY (year-over-year) to 16.6 metric tons in April 2016.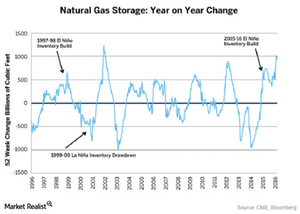
How Do El-Niño and La-Nina Impact Natural Gas Prices?
When El-Niño occurs, it keeps the sea surfaces warmer. This causes milder-than-normal cold temperatures across the sea and some parts of the US.
