Cabot Oil & Gas Corp.
Latest Cabot Oil & Gas Corp. News and Updates
Materials Must-know: Why onshore rig counts are at a 2-year high
The U.S. onshore, or land-based, rig count increased by four rigs—from 1,865 to 1,869—during the week ending September 19. Land-based rigs include 13 inland water rigs. This is the highest onshore rig count in the past two years. It’s the highest rig count since August 17, 2012. This marks the eighth increase in the past ten weeks.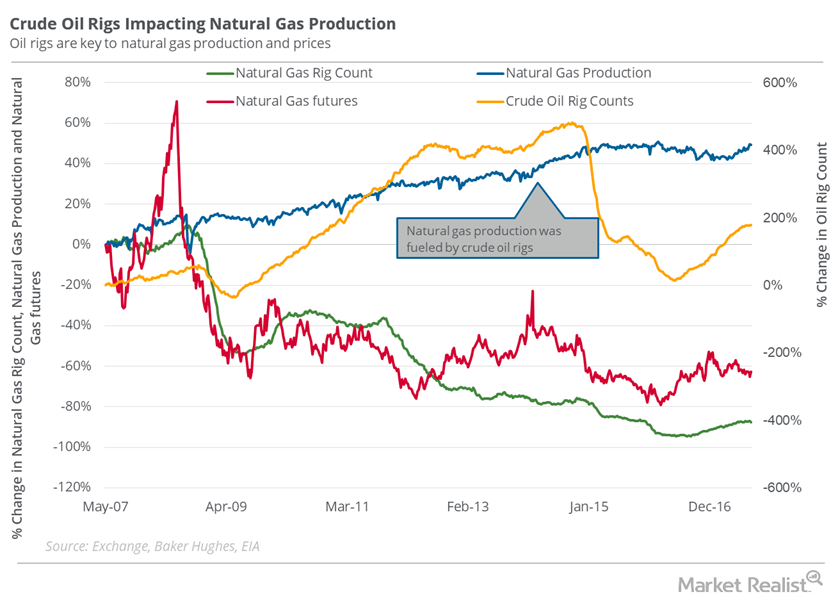
Will the Oil Rig Count Increase Natural Gas Downside Risk?
Since 2008, the natural gas rig count has fallen ~89% from its record high. But the fall was unable to stop the rise in natural gas supplies.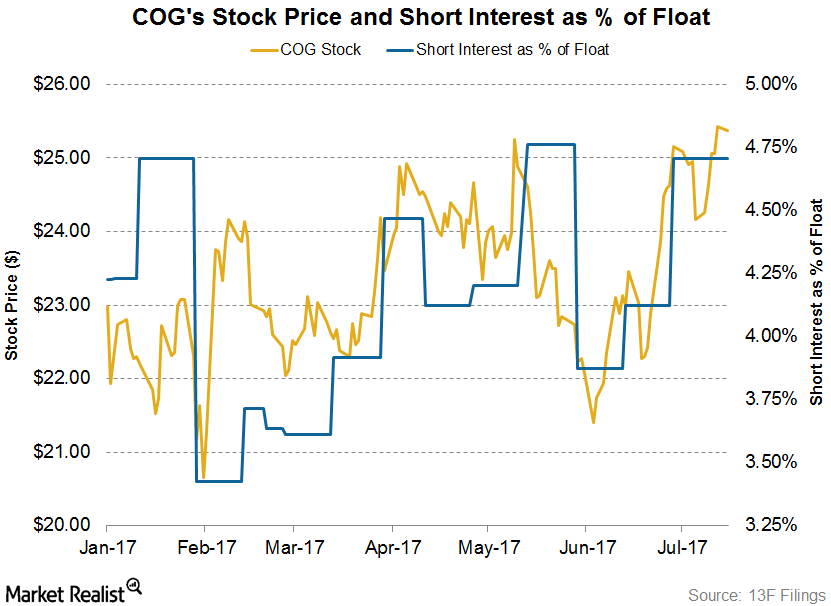
Cabot Oil & Gas: Short Interest Trends in Its Stock
On July 18, 2017, Cabot Oil & Gas’s (COG) short interest ratio was ~4.7%. At the beginning of the year, its short interest ratio was 4.2%.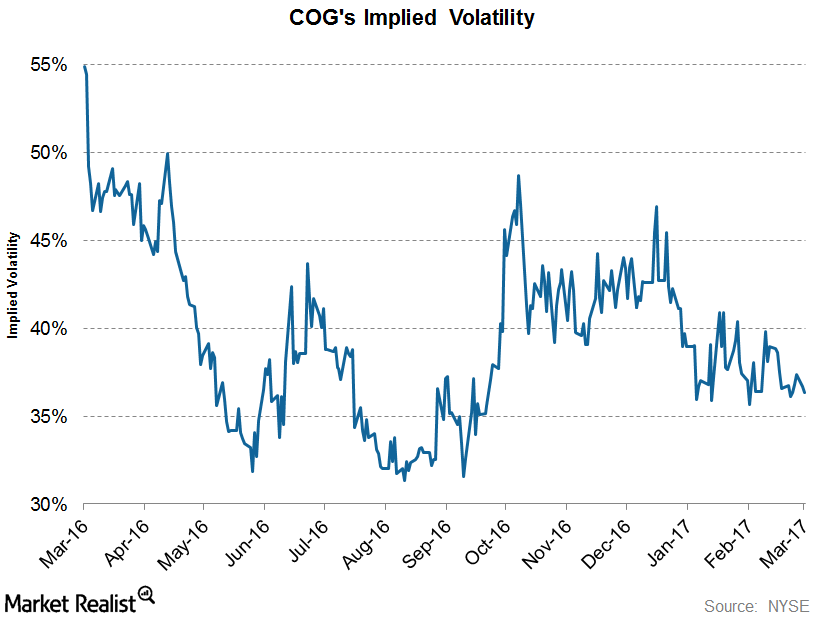
COG’s Implied Volatility Has Fallen Significantly since Early 2016
Cabot Oil and Gas’s (COG) current implied volatility is ~36.4%, ~3% lower than its 15-day average of 37.4%.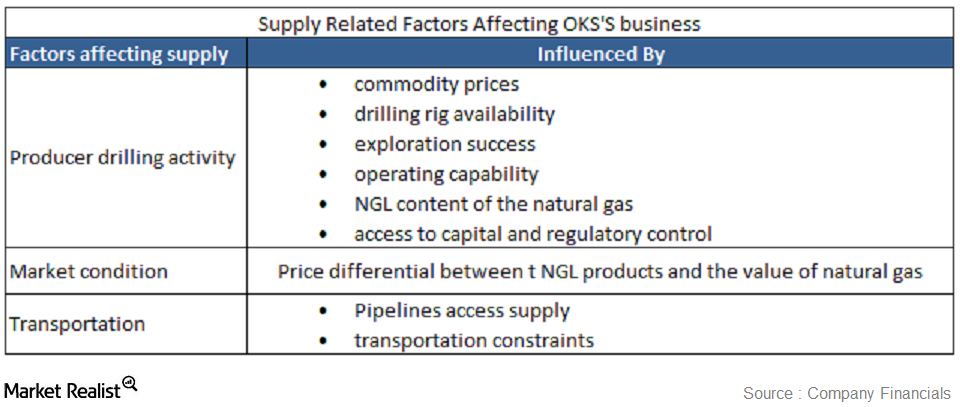
Must-know: Supply-related factors that affect ONEOK Partners
Natural gas, crude oil, and NGL (or natural gas liquid) supply is affected by several factors that could be supply related or demand related.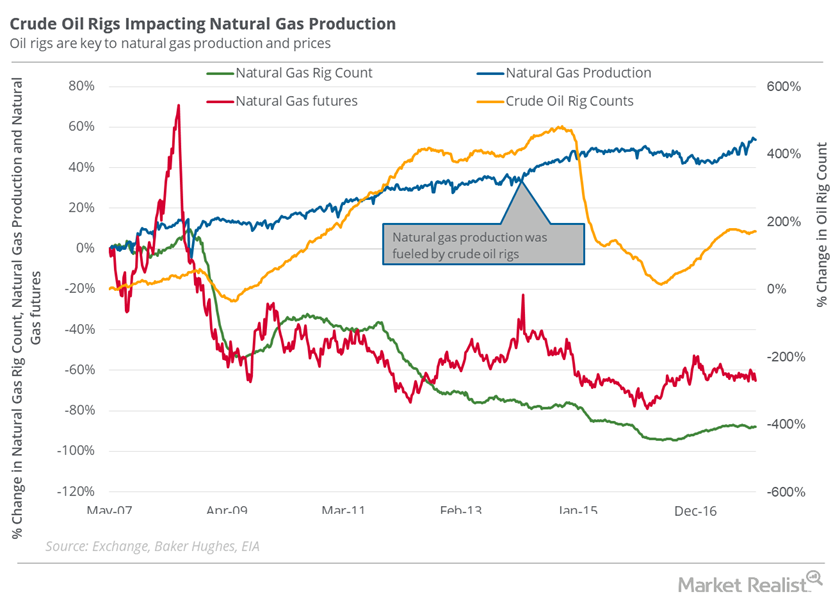
A Look at the Rig Count and Natural Gas
On December 15, 2017, the natural gas rig count was 88.6% lower than its record high in 2008.
Could Oil Rig Count Stop Natural Gas Fall?
In the week ended October 6, 2017, the natural gas rig count fell by two to 187.Financials What’s the Dow Theory?
The Dow Theory was developed by Charles Dow. It identifies and signals the change in the stock market trends. It’s useful for trading and investing. The Dow Theory has six components.Financials Technical indicators and the Relative Strength Index
The Real Strength Index (or RSI) is a measure of a stock’s overbought and oversold position. The commonly used RSI is a 14-day RSI. It refers to the 14-day stock price that’s used to calculate the RSI.Financials Double top and double bottom patterns in technical analysis
The double top pattern forms in the uptrend. In this pattern, two consecutive peaks are formed. The peaks both have roughly the same price level.Energy & Utilities What are the advantages of technical analysis?
Entry and exit strategy is recommended for short and long-term trading in technical analysis. Fundamental analysis is used for the long-term entry and exit point.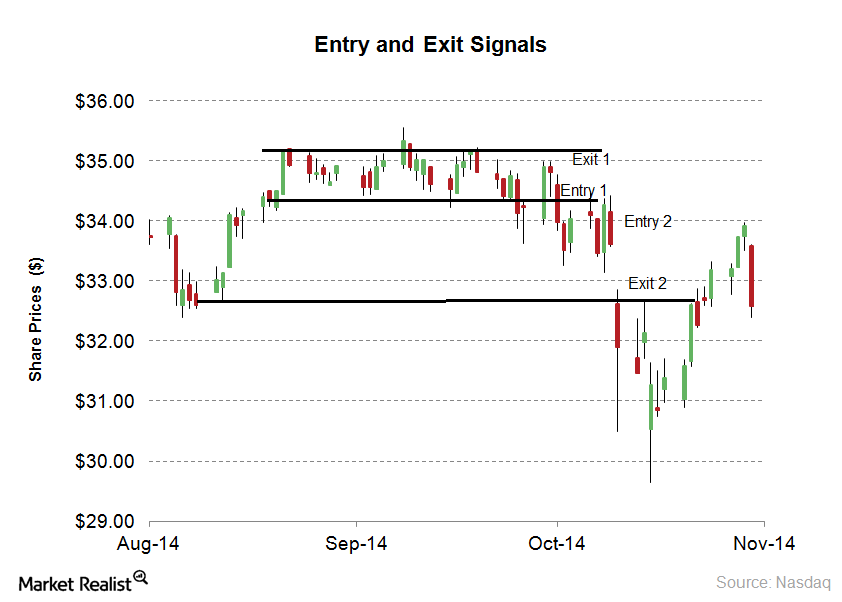
What are the disadvantages of technical analysis?
Technical analysis is used to forecast stocks. All of the technical indicators give possible entry and exit points. The forecasting accuracy isn’t 100%. This is one of disadvantages of technical analysis.
Where Is US Crude Oil Headed? An Energy Update
On August 30, US crude oil October futures settled at $55.1 per barrel. On a week-over-week basis, US crude oil prices rose 1.7%.
Range Resources: What Do Analysts Recommend?
On June 14, BMO reduced its target price on Range Resources by $2 to $6. On June 12, Citigroup reduced its target price by $4.5 to $7.5.
Is Oil Dominating Over Natural Gas-Weighted Stocks?
Except Cabot Oil and Gas (COG), all of these natural gas–weighted stocks had a correlation of at least 75% with the S&P 500 Index (SPY).
Where Cabot Oil & Gas’s Stock Price Could Be by May’s End
On May 24, Cabot Oil & Gas’s (COG) implied volatility was 28.6%, ~4.4% higher than its 15-day average.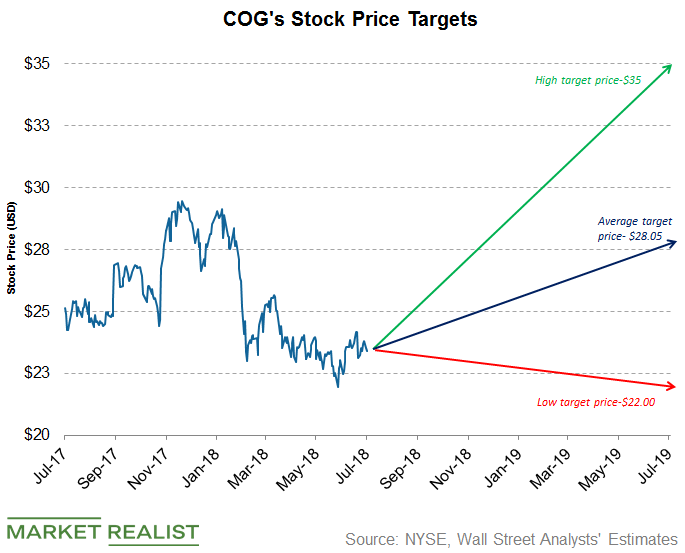
Analysts’ Price Targets for Cabot Oil & Gas’s Next 12 Months
Approximately 66.66% of analysts covering Cabot Oil & Gas (COG) recommend “buy,” and 33.33% recommend “hold.”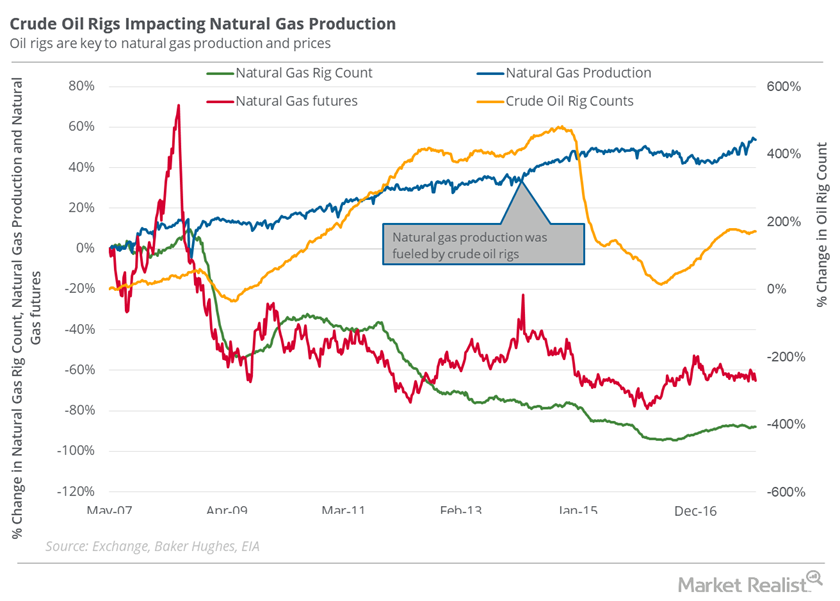
Why the Oil Rig Count Could Be a Concern for Natural Gas Bulls
In the week ended December 22, the natural gas rig count was 88.5% below its record high of 1,606 in 2008.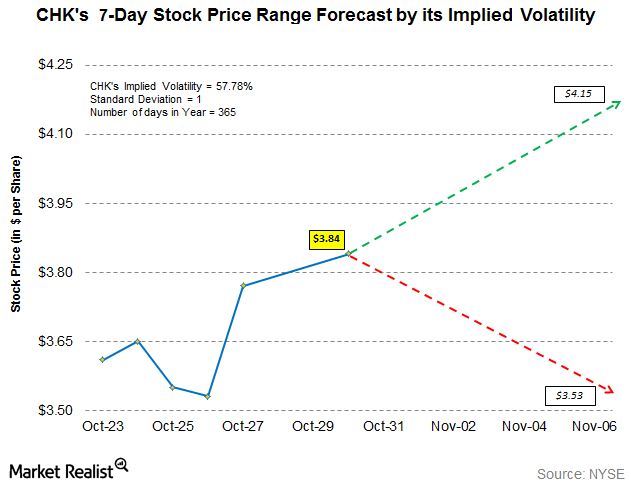
Chesapeake’s Implied Volatility: Stock Price Range Forecast
Chesapeake Energy’s (CHK) implied volatility as of October 30, 2017, was ~58%—9% higher than its 15-day average of ~53%.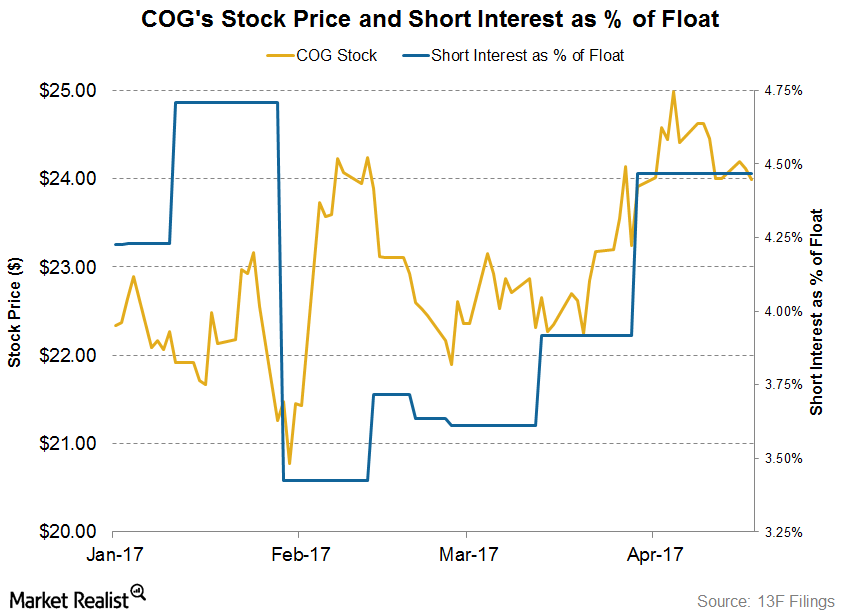
Short Interest Trends in Cabot Oil & Gas Stock
On April 19, Cabot Oil and Gas’s short interest as a percentage of its float was ~4.5%. At the beginning of the year, its short interest ratio was 4.2%.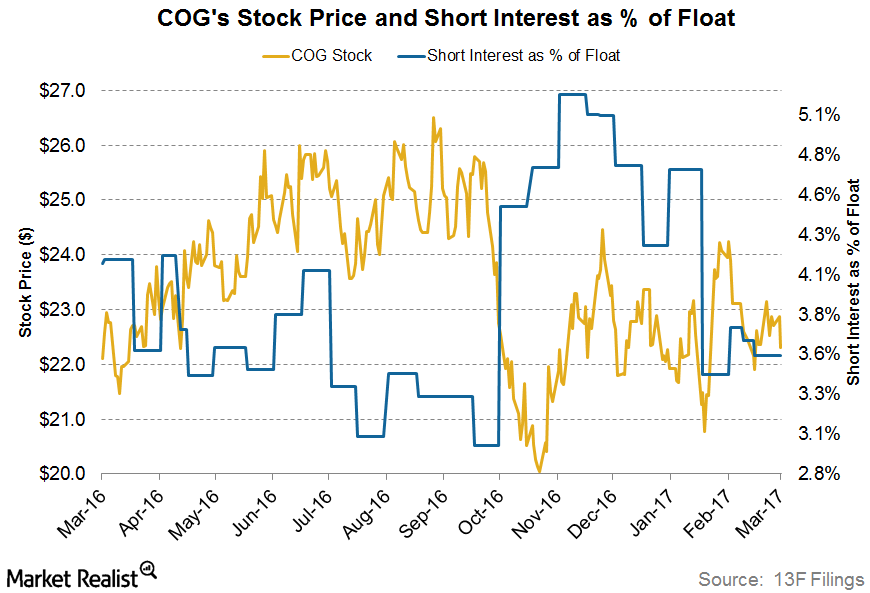
How Short Interest in COG Stock Has Been Trending
On March 14, 2017, Cabot Oil and Gas’s (COG) short interest as a percentage of its float (or its short interest ratio) was ~3.5%.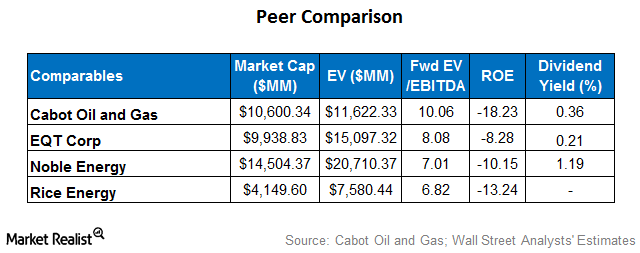
How Cabot Oil and Gas’s Relative Valuation Compares to Peers
A peer group comparison shows that Cabot’s forward EV-to-EBITDA multiple of ~10.1x is higher than that of its peers.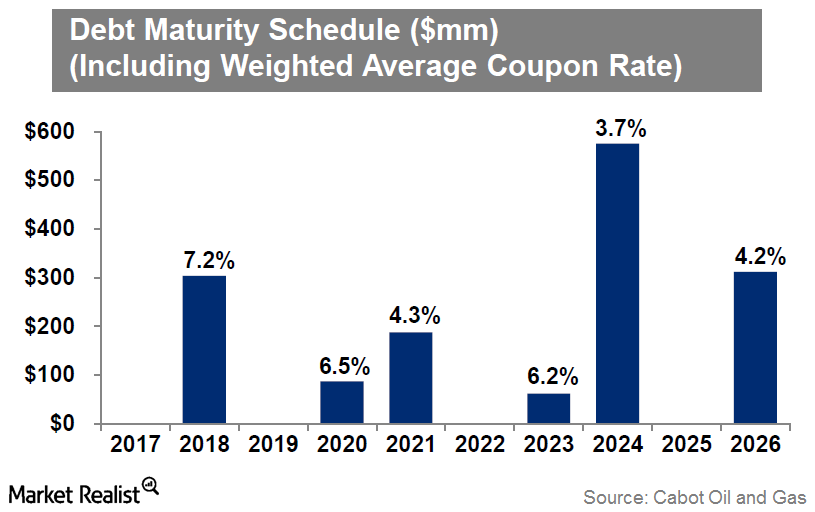
Analyzing Cabot Oil and Gas’s Debt Maturity Profile
Cabot Oil and Gas (COG) noted that it doesn’t have any debt maturing until 2018.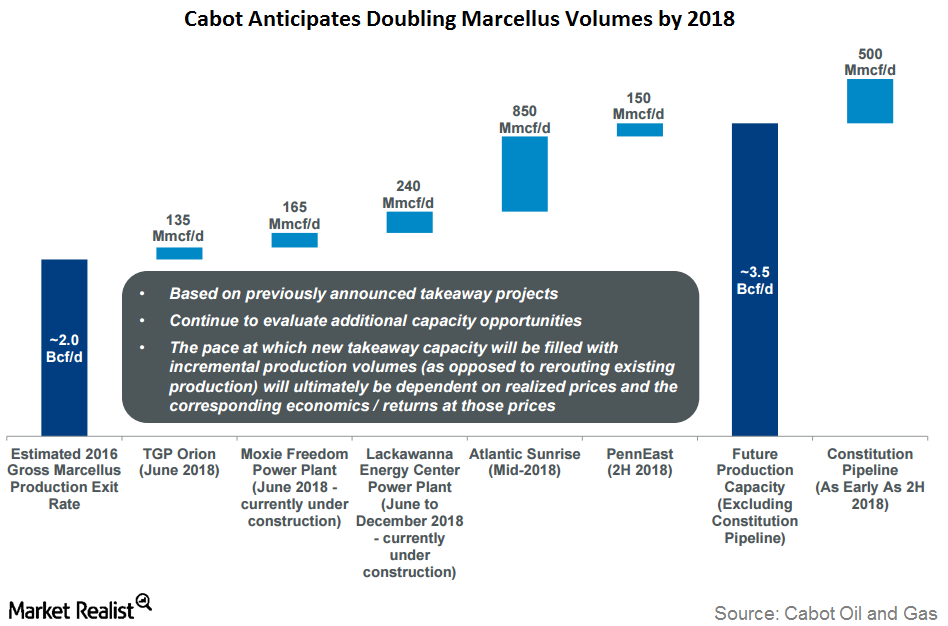
Why Cabot Awaits the Atlantic and Constitution Pipeline Projects
Cabot Oil & Gas’s stock price momentum has slowed, but its stock has recently been rising, mirroring natural gas prices.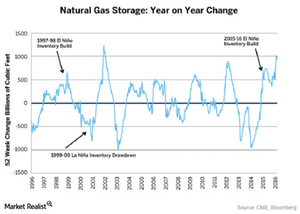
How Do El-Niño and La-Nina Impact Natural Gas Prices?
When El-Niño occurs, it keeps the sea surfaces warmer. This causes milder-than-normal cold temperatures across the sea and some parts of the US.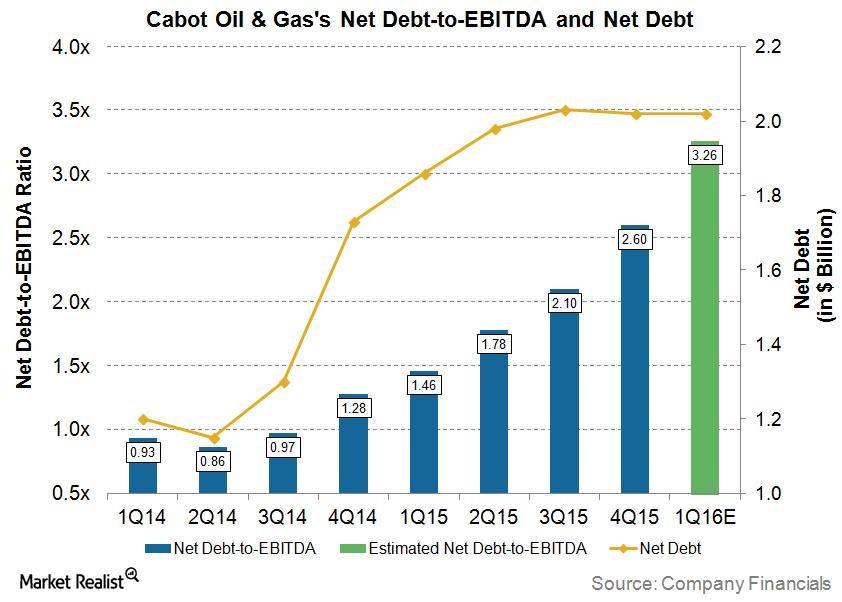
How Is Cabot Oil & Gas Dealing with Its High Debt?
On February 26, 2016, in an attempt to deal with falling earnings and high debt, Cabot Oil & Gas (COG) closed a public offering of 44 million shares of its common stock.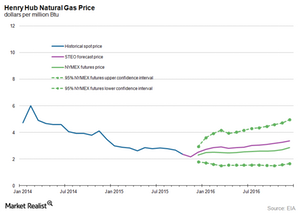
What’s the Long-Term Forecast for Natural Gas Prices?
US natural gas prices have fallen for the third time in the last five trading sessions. Prices are following the long-term bearish trend and trading close to 16-year lows.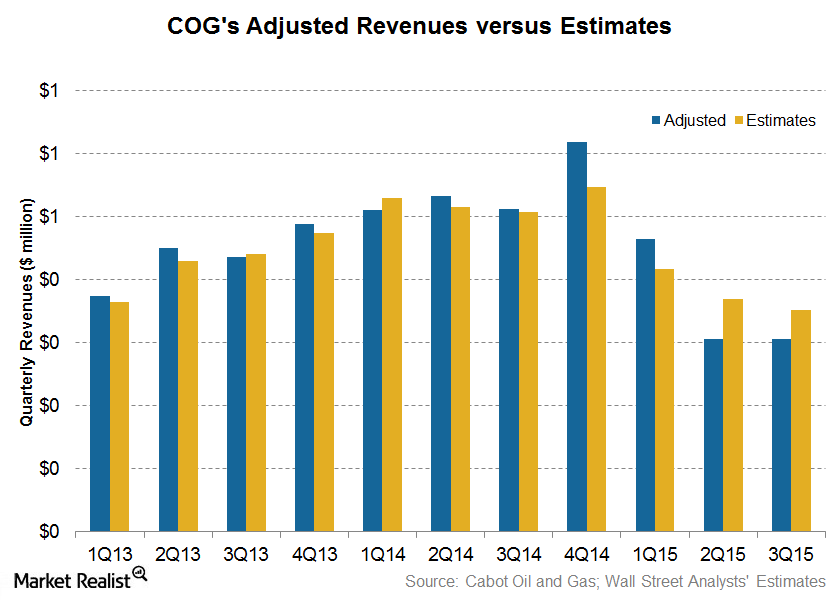
3Q15 Earnings: Cabot Oil and Gas’s Revenue Missed Estimates
Wall Street analysts’ estimate for Cabot Oil and Gas’s revenue was ~$352 million for 3Q15. The company announced adjusted revenue of ~$305 million.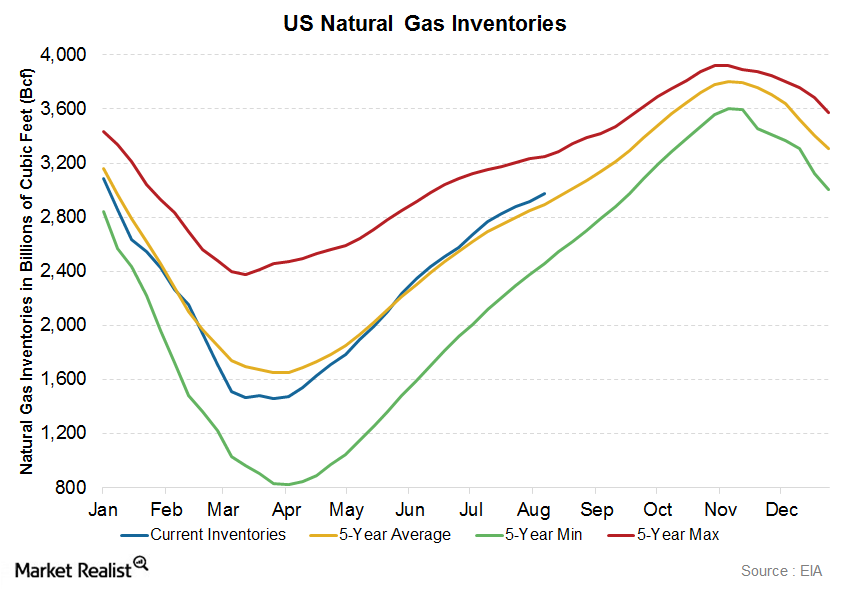
Natural Gas Inventories Beat Expectations: How Will Prices React?
On Thursday, August 13, the EIA (U.S. Energy Information Administration) published its “Natural Gas Weekly Update” for the week ended August 7.
