AvalonBay: What’s Driving the Dividend and Valuations?
AvalonBay’s revenue grew 7% in the first quarter, driven by rental and other income.
Nov. 20 2020, Updated 3:45 p.m. ET

AvalonBay Communities stock
In this part, we’ll look at AvalonBay Communities (AVB). The stock has beaten the S&P 500 (SPY), the Dow Jones Industrial Average (DIA), and the Nasdaq Composite (ONEQ) with its dividend yield. However, it has been beaten by the broad-based indexes in terms of YTD (year-to-date) returns. Its PE ratio is close to Extra Space Storage’s (EXR) ratio.
What drove revenue and EPS in fiscal 2017?
AvalonBay’s revenue grew 6% in fiscal 2017, driven by rental and other income and partially offset by management, development, and other fees.
Its operating expenses rose 8%, leading to a 2% growth in operating income.
Its interest expenses rose 6%. Other expenses rose substantially, driven by loss on debt extinguishment, investments and investment management, impairment, and loss on disposal of assets. Those were partially offset by growth in joint venture income. As a result, both net income and EPS declined 15% and 16%, respectively. FFO (fund flow from operations) grew 5%.
What drove revenue and EPS in the first quarter?
AvalonBay’s revenue grew 7% in the first quarter, driven by rental and other income, partially offset by management, development, and other fees.
Its operating expenses rose 11%, leading to a 2% growth in operating income.
Its interest expenses rose 12%. Other expenses rose, driven by losses on debt extinguishment, investments and investment management, and other expenses. Joint venture income declined substantially. As a result, net income and EPS declined 40%. FFO grew 4%.
How did the dividend and valuation shape up?
AvalonBay’s fiscal 2017 results were followed by a 4% increase in its dividend for the first quarter. The slight increase in dividend yield was due to dividend growth and price loss.
PE and PS (price-to-sales) ratios of 27.0x and 10.9x, respectively, compare to sector average PE and PS ratios of 45.3x and 5.9x, respectively.
You can see the valuation and dividend yield projections in the chart below.
What are the rental income and EPS projections?
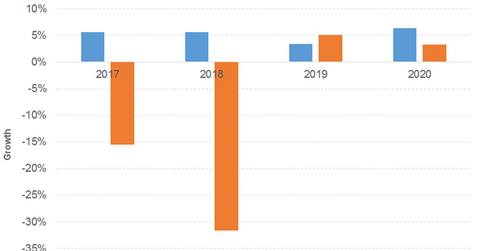
Rental income and other income has been projected to grow 6%, 3%, and 6% in 2018, 2019, and 2020, respectively. EPS has been projected to decline 32% in 2018 followed by 5% and 3% growth in 2019 and 2020, respectively.
Dividend ETFs
The iShares International Select Dividend ETF (IDV) offers a 5% dividend yield at a PE ratio of 13.5x. It has a 32% exposure to financials. Its top five holdings include AstraZeneca (AZN), Macquarie Group (MQG), Royal Dutch Shell (RDSA), Commonwealth Bank of Australia (CBA), and Galliford Try (GFRD).
The First Trust Value Line Dividend Index (FVD) offers a 2% dividend yield at a PE ratio of 20.4x. It has a 22% and 16% exposure to utilities and financials, respectively. Its top five holdings include Williams-Sonoma (WSM), Healthcare Services Group (HCSG), Campbell Soup (CPB), Sempra Energy (SRE), and Mid-America Apartment Communities (MAA).
