How US Gasoline Inventories Support Crude Oil Futures
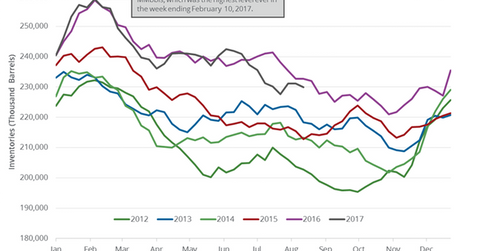
The US Energy Information Administration reported that US gasoline inventories fell by 1.2 MMbbls (million barrels) to 229.9 MMbbls (million barrels) between August 11, 2017, and August 18, 2017.
Aug. 24 2017, Updated 2:36 p.m. ET

US gasoline inventories
The US Energy Information Administration reported that US gasoline inventories fell by 1.2 MMbbls (million barrels) to 229.9 MMbbls (million barrels) between August 11, 2017, and August 18, 2017. Inventories fell 0.5% week-over-week and 2.7 MMbbls, or 1.2%, year-over-year. Inventories fell for the eighth time in ten weeks.
A Reuters survey estimated that US gasoline inventories would fall by 0.6 MMbbls between August 11, 2017, and August 18, 2017. A larger-than-expected fall in gasoline supported gasoline (UGA) and crude oil (DIG) (ERY) (ERX) futures on August 23, 2017.
US gasoline (UGA) futures rose 1.7% to $1.61 per gallon on August 23, 2017. Higher gasoline and crude oil (XLE) (XOP) prices have a positive impact on energy producers and refiners. The energy sector’s top gainers as of August 23, 2017, are as follows:
US gasoline production, imports, and demand
US gasoline production rose by 518,000 bpd (barrels per day) to 10.6 MMbpd (million barrels per day) between August 11, 2017, and August 18, 2017. Production rose 5.1% week-over-week and 531,000 bpd or 5.3% year-over-year.
US gasoline imports fell by 112,000 bpd to 555,000 bpd between August 11, 2017, and August 18, 2017. Imports fell 17% week-over-week and 246,000 bpd or 31% year-over-year.
US gasoline demand rose by 107,000 bpd to 9.6 MMbpd between August 11, 2017, and August 18, 2017. Demand rose 1.1% week-over-week but fell 30,000 bpd or 0.3% year-over-year.
